Visual Analysis of Multidimensional Clusters

a clustering and visual analysis technology, applied in the field of information visualization techniques, can solve the problems of difficult understanding and evaluating clustering results, difficult to understand and evaluate clustering results, and difficult to understand abstract relationships, so as to maintain the stability of voronoi regions

Inactive Publication Date: 2012-12-06
IBM CORP
View PDF11 Cites 83 Cited by
  • Summary
  • Abstract
  • Description
  • Claims
  • Application Information

AI Technical Summary

Benefits of technology

[0011]In one exemplary embodiment, a stabilized Voronoi-based icon layout algorithm is employed to substantially maintain a stability of Voronoi regions when cluster changes occur. Likewise, a stabilize...

Problems solved by technology

While this clustering technique is powerful, users often have difficulty understanding the semantic meaning of the resulting clusters and evaluating the quality of the results, especially for high-dimensional data.
There are several issues which make understanding and evaluating clustering results difficult.
Understanding these abstract relationships can be challenging.
This sub-cluster struc...

Method used


Image

  • Visual Analysis of Multidimensional Clusters
  • Visual Analysis of Multidimensional Clusters
  • Visual Analysis of Multidimensional Clusters

Examples


Embodiment Construction

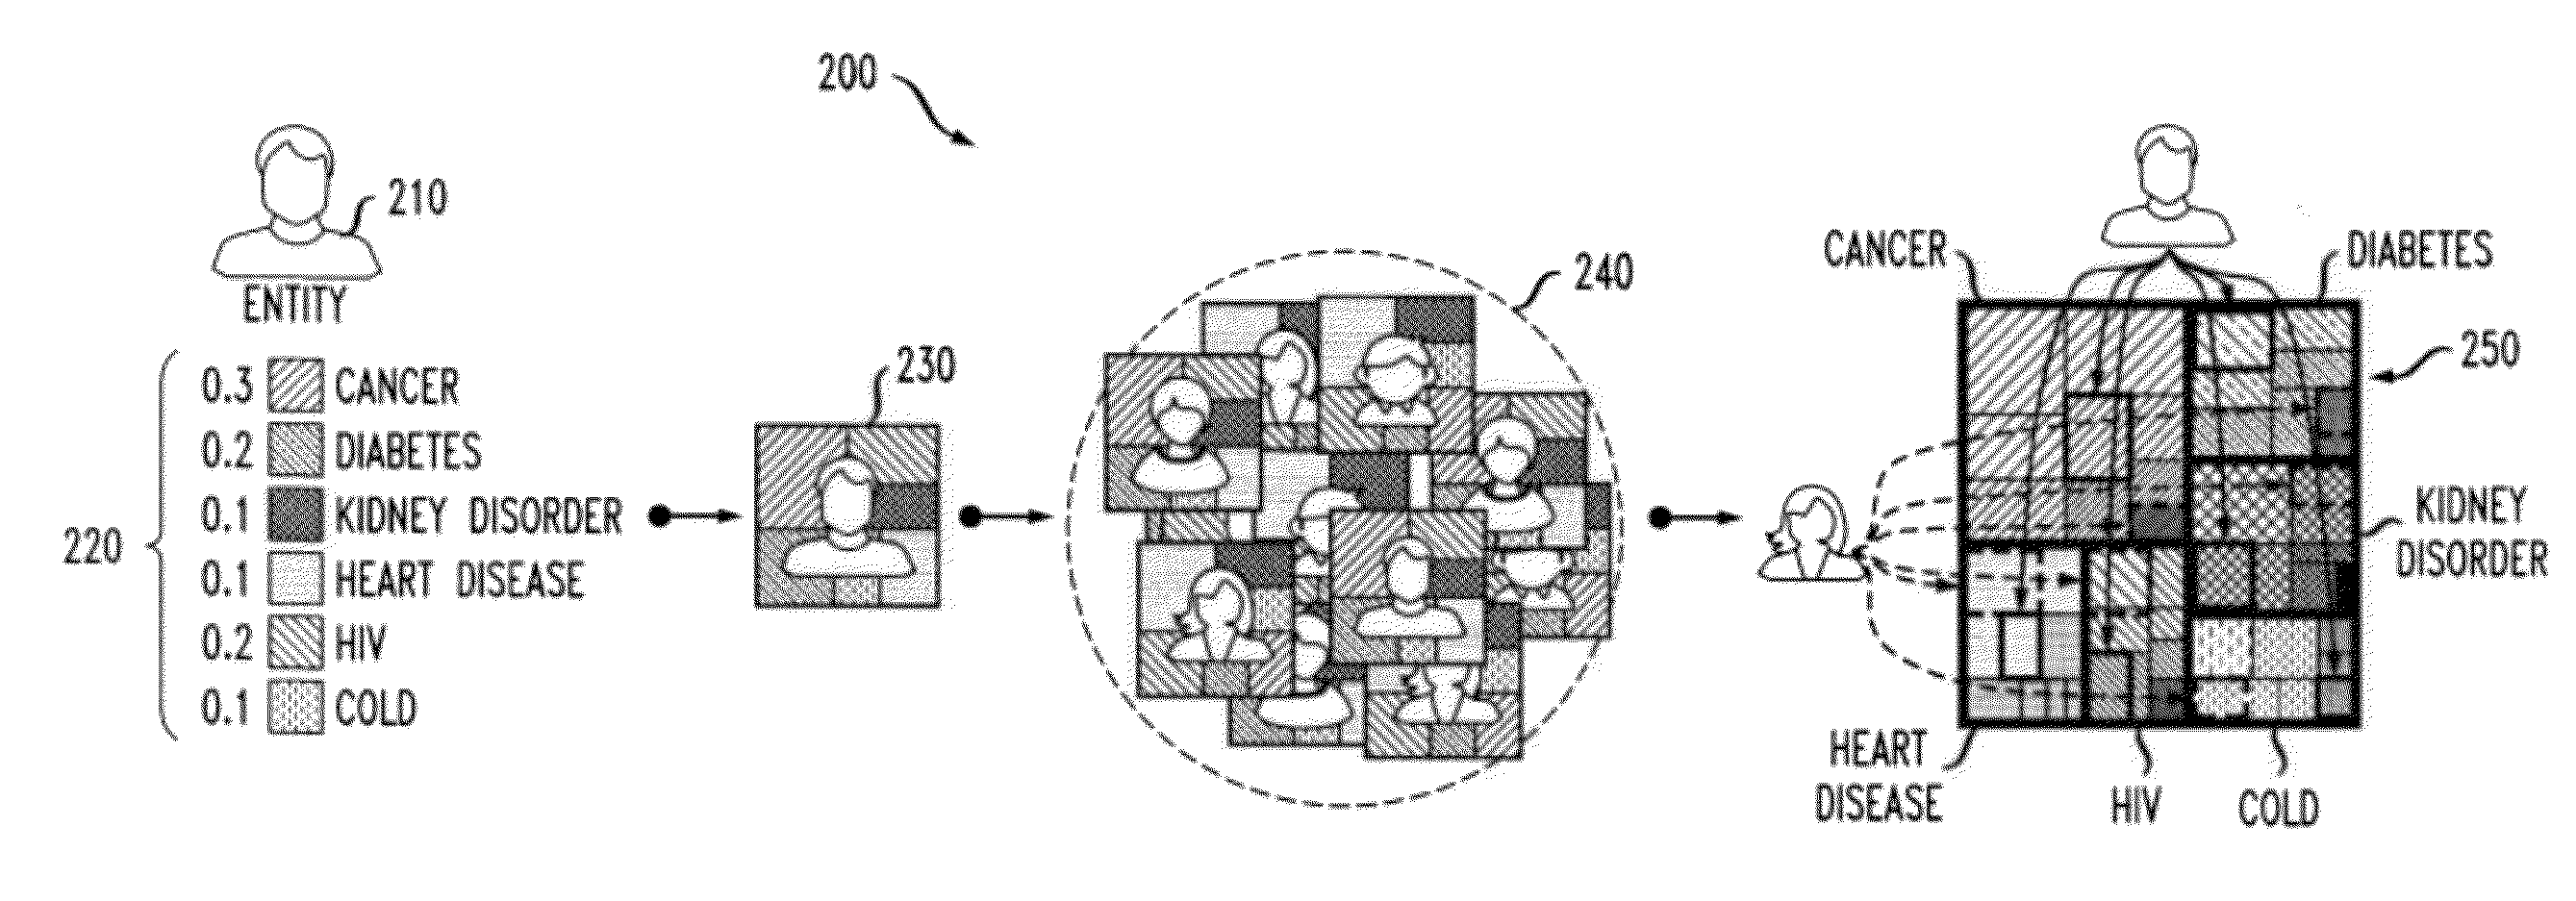
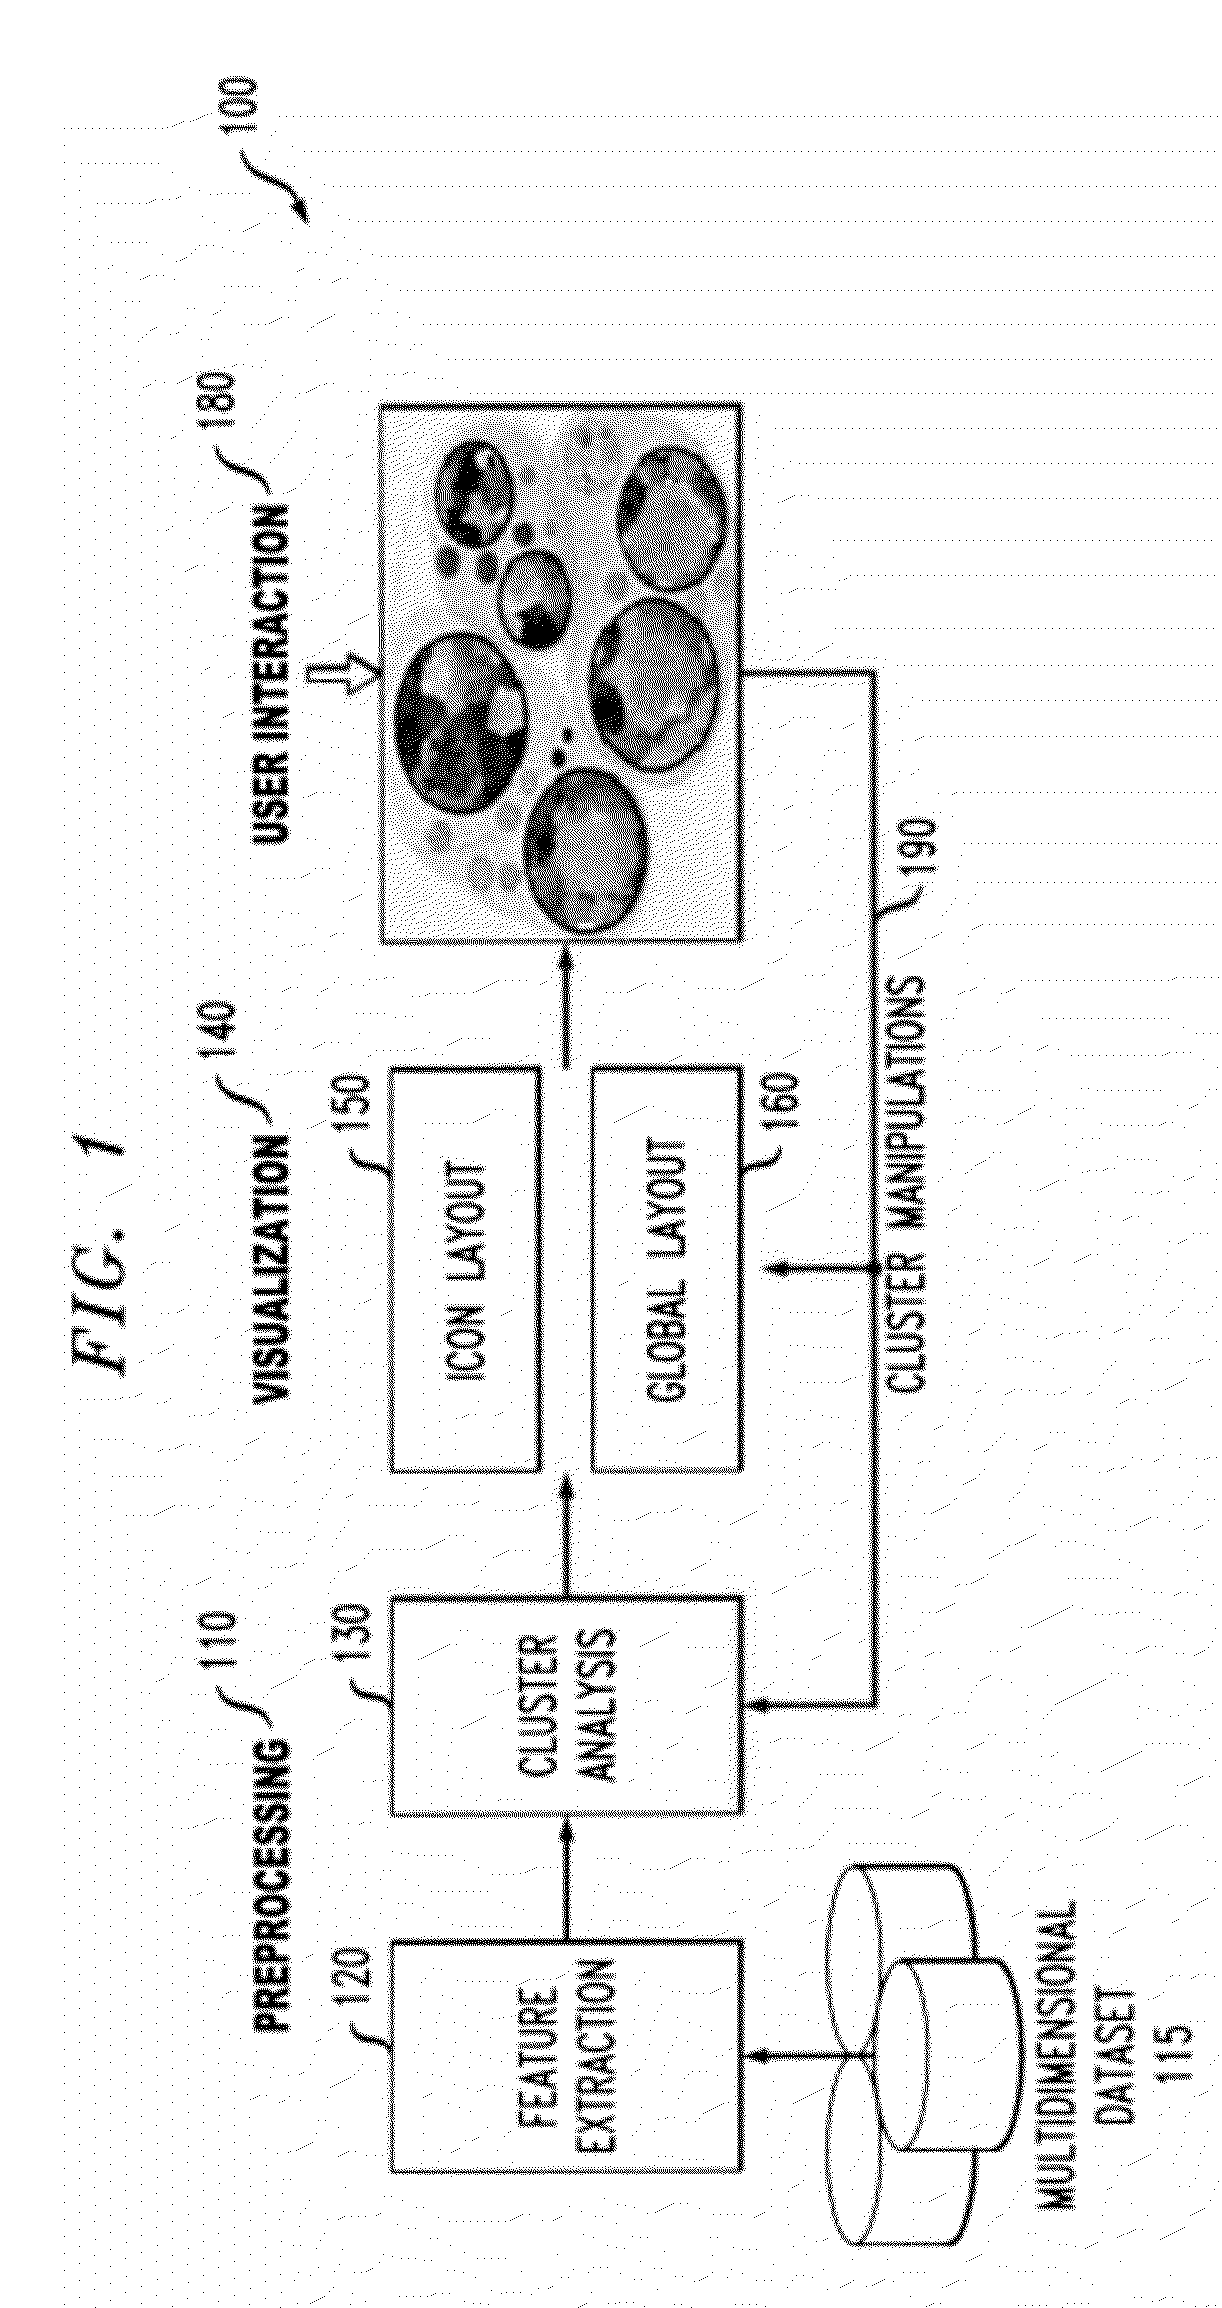
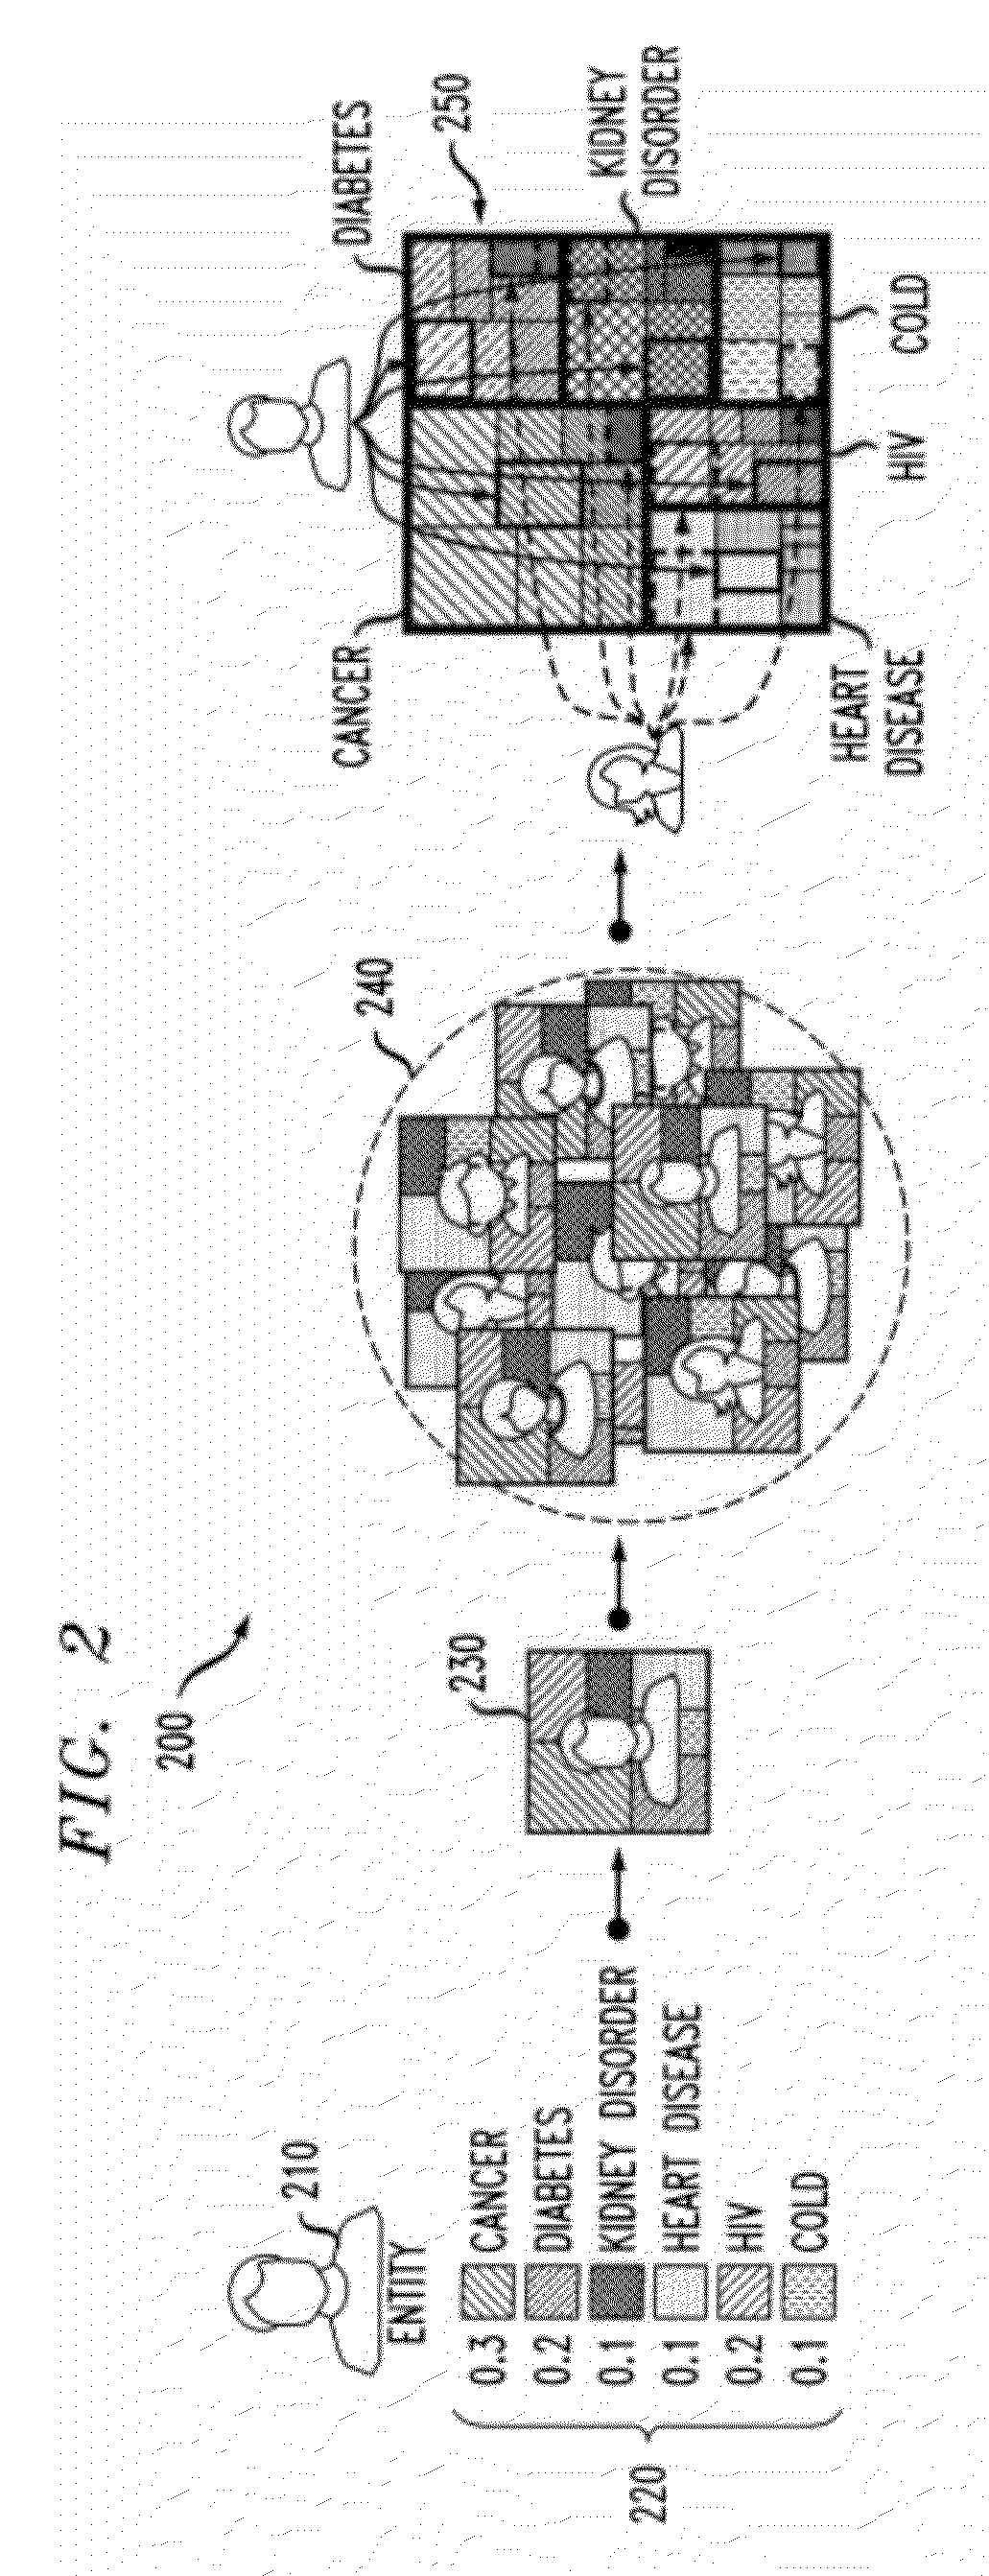
[0024]The present invention provides a dynamic icon-based visualization system 100 that helps users understand, evaluate, and adjust complex multidimensional clustering results. The disclosed dynamic icon-based visualization system 100 encodes the raw data values in multiple dimensions as well as the statistical information related to cluster quality. The encoded statistical information provides visual cues to facilitate cluster evaluation and adjustment. The disclosed dynamic icon-based visualization system 100 employs an icon design that can be conveniently embedded into a wide range of presentations. Moreover, the disclosed dynamic icon-based visualization system 100 supports intuitive user interactions for cluster refinement.

[0025]According to one aspect of the invention, a multidimensional cluster icon design is provided that encodes multiple data attributes as well as derived statistical information for cluster interpretation and quality evaluation. According to another aspect...


PUM


Abstract

Visualization techniques are provided for a clustered multidimensional dataset. A data set is visualized by obtaining a clustering of a multidimensional dataset comprising a plurality of entities, wherein the entities are instances of a particular concept and wherein each entity comprises a plurality of features; and generating an icon for at least one of the entities, the icon having a plurality of regions, wherein each region corresponds to one of the features of the at least one entity, and wherein a size of each region is based on a value of the corresponding feature. Each icon can convey statistical measures. A stabilized Voronoi-based icon layout algorithm is optionally employed. Icons can be embedded in a visualization of the multidimensional dataset. A hierarchical encoding scheme can be employed to encode a data cluster into the icon, such as a hierarchy of cluster, feature type and entity.

Description

FIELD OF THE INVENTION[0001]The present invention relates generally to the electrical, electronic and computer arts, and, more particularly, to information visualization techniques.BACKGROUND OF THE INVENTION[0002]Clustering is a widely used method to group data entities into subsets called clusters such that the entities in each cluster are similar in some way. A powerful feature of clustering algorithms is that they can generate clusters without any pre-defined labels or categories, which makes them an ideal choice for analyzing data with little or no a priori information. Unlike classification, in which categories with clear semantic meanings are pre-defined, clustering by definition works without these initial constraints on how data entities should be grouped. Users are only required to choose a distance function (e.g., Euclidean distance) that measures how similar two data items are in a feature space, and some other parameters such as the number of clusters or a maximum clust...

Claims


Application Information

Patent Timeline
IPC IPC(8): G06F3/048
CPCG06F17/30601G06F16/287
Inventor CAO, NANGOTZ, DAVID H.SUN, JIMENG
Owner IBM CORP
Why Eureka
Try Eureka