
Providing direct manipulation of an analytics data visualization within an analytics report

a technology of analytics report and data visualization, applied in the field of business analytics, can solve the problems of consuming computing resources, consuming time, manual refining, etc., and achieves the effect of reducing the difficulty of manual refining, and reducing the accuracy of analytics repor

Inactive Publication Date: 2013-07-18
IBM CORP
View PDF8 Cites 63 Cited by
  • Summary
  • Abstract
  • Description
  • Claims
  • Application Information

AI Technical Summary

Benefits of technology

The patent describes a reporting engine that can analyze and display data in a flexible way, using a specific format called JSON. This engine can also create new reports and save them for future use. Overall, the patent provides a way for developers to easily analyze and display data in a customizable way.

Problems solved by technology

These data sets can provide a limited amount of analytics data in the form of charts.
Manual refining typically involves recreating the report which can consume computing resources (e.g., network, storage) unnecessarily.
Further, manual refining can be time consuming and difficult for users with no experience in analytics report authoring.
As such, mobile devices which frequently have limited capabilities (e.g., power / processor / screen size constraints) can present major hurdles for obtaining analytics data not presented within an analytics reports.
For example, large data sets are often associated with analytics reporting tools and cannot be communicated to mobile devices to perform report creation capabilities.
Additionally, many analytics reporting software can be complex server-side tools which cannot be utilized on a mobile device.

Method used


Image

  • Providing direct manipulation of an analytics data visualization within an analytics report
  • Providing direct manipulation of an analytics data visualization within an analytics report
  • Providing direct manipulation of an analytics data visualization within an analytics report

Examples


Embodiment Construction

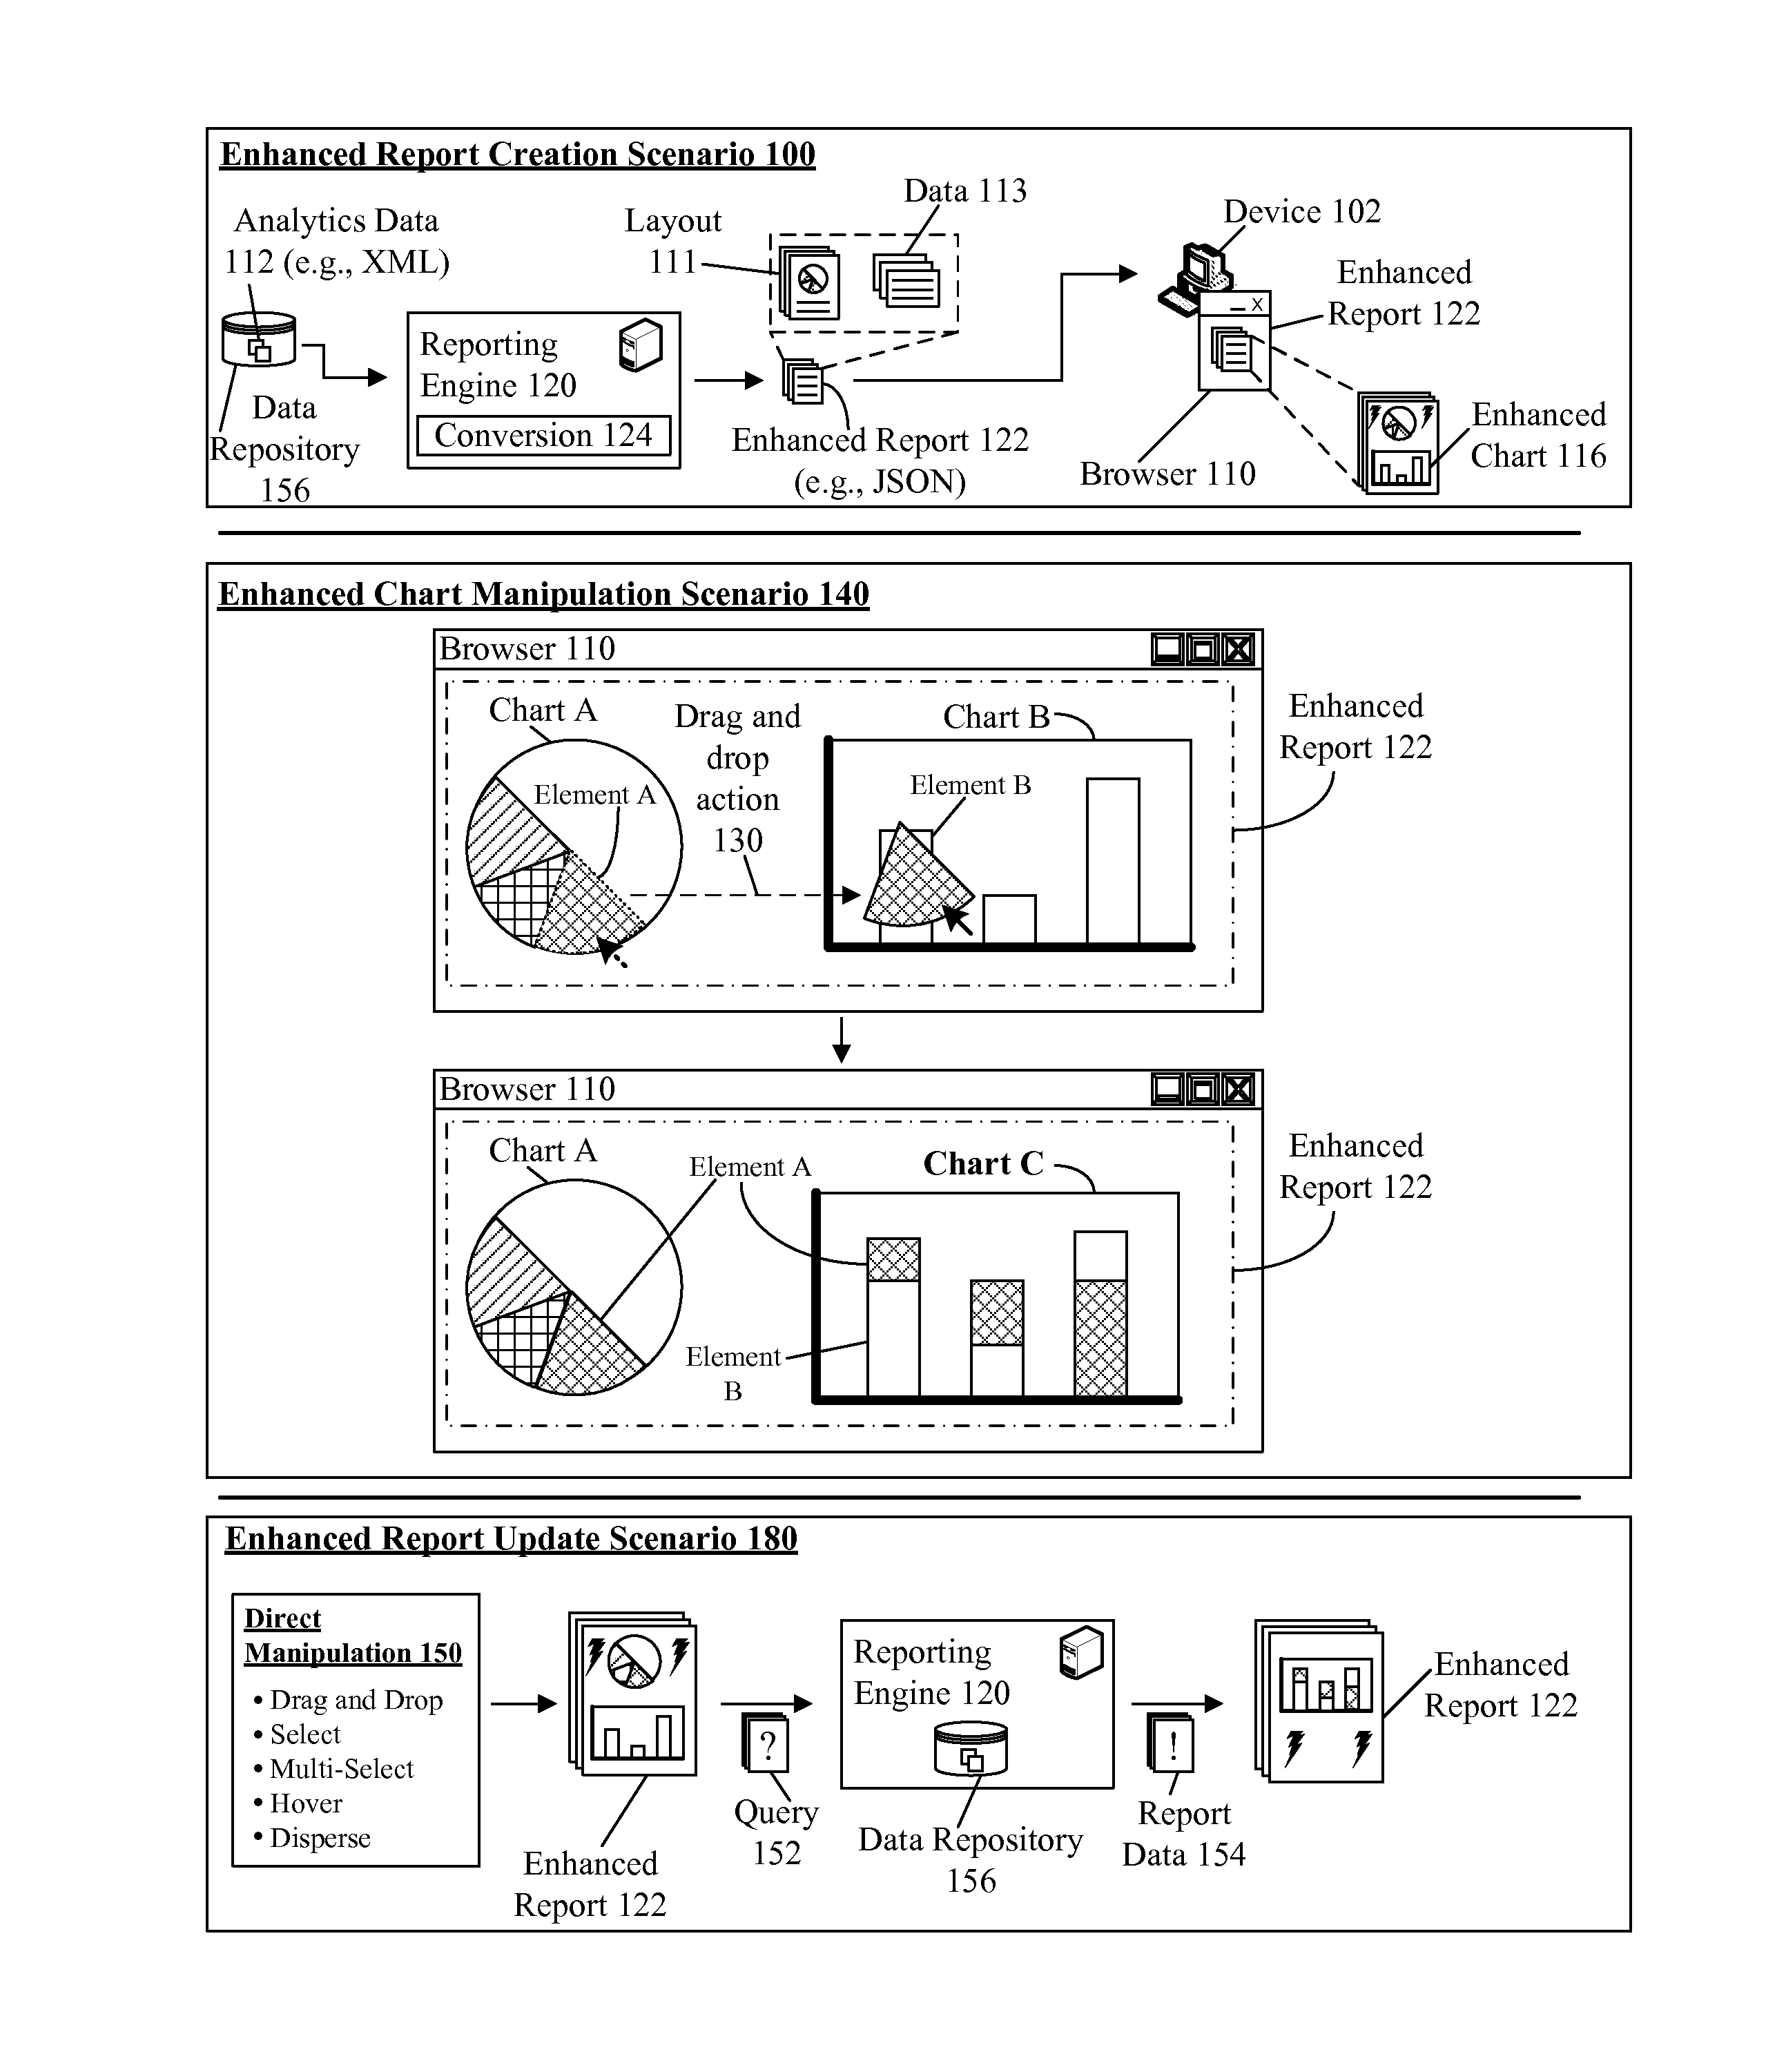
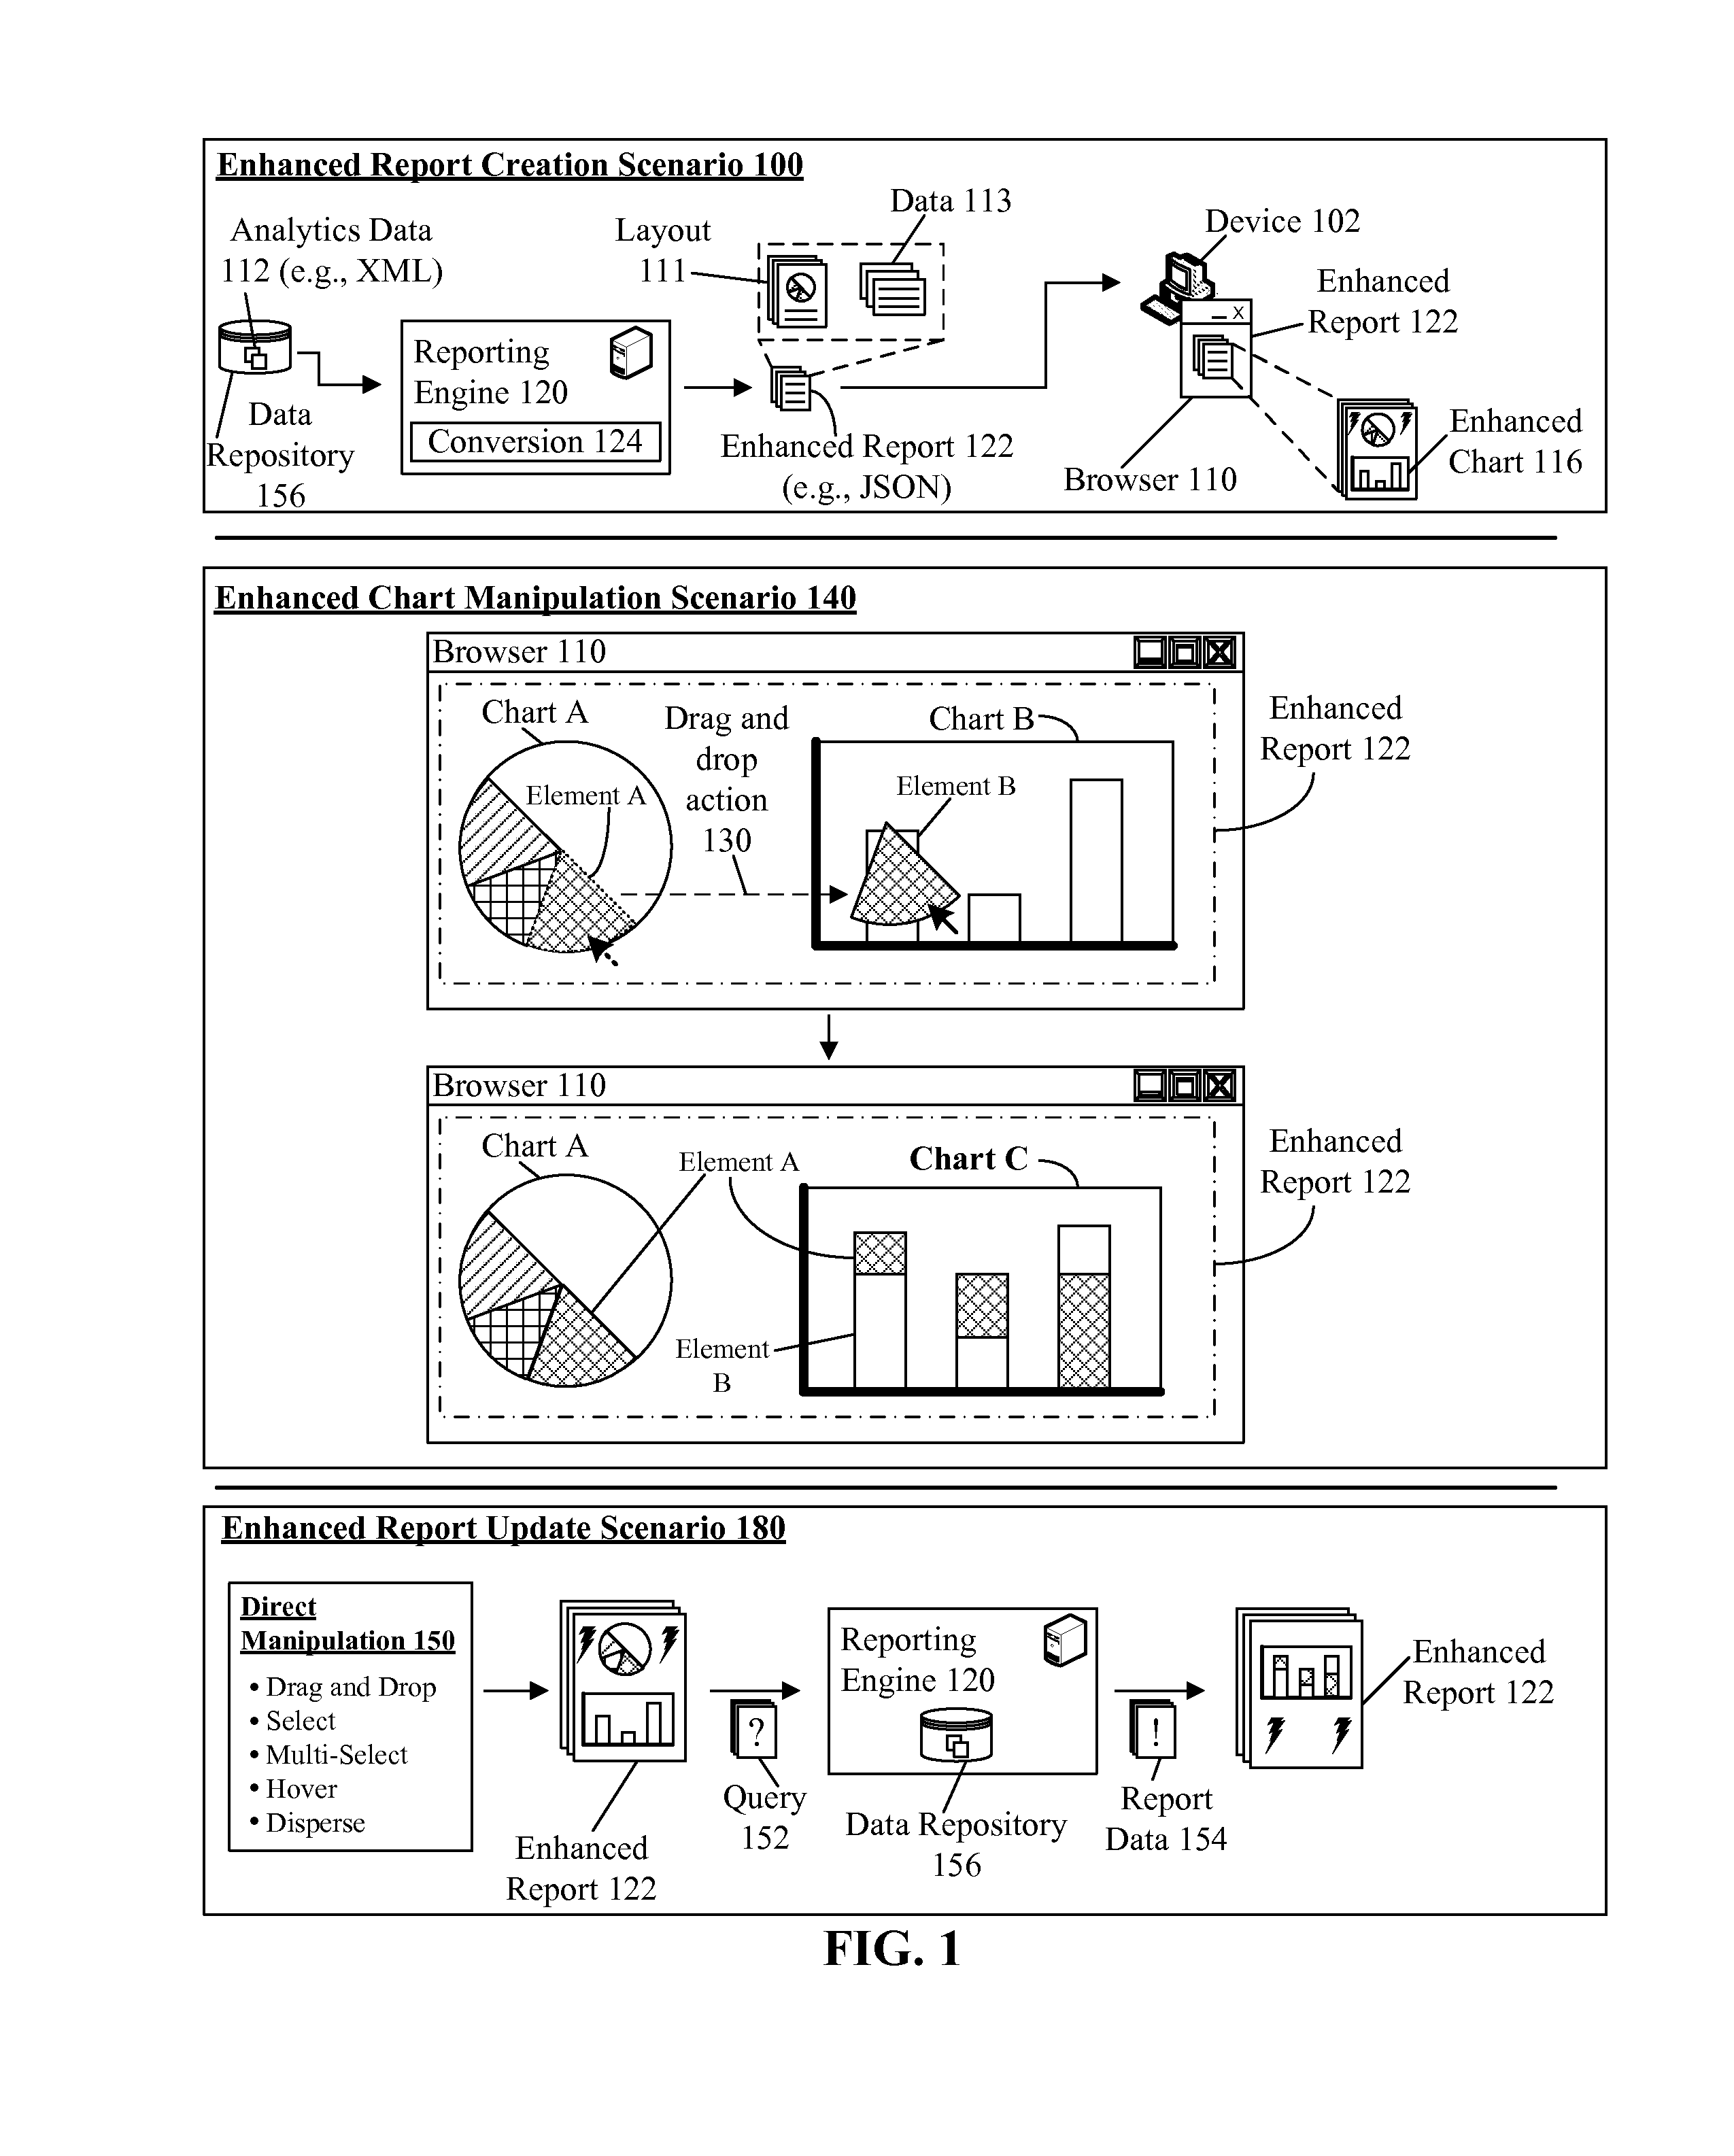
[0013]The present disclosure is a solution for providing direct manipulation of an analytics data visualization within an analytics report. In the solution, a reporting framework can permit an information graphic (e.g., chart) within an analytics report to be dynamically manipulated within an interface. Manipulation can trigger the visual modification of an information graphic. Visual modification can include, but is not limited to, combining two or more charts, dispersing a chart, adding a data set to a chart, removing a data set from a chart, and the like. Manipulation can include, but is not limited to, drag and drop, select, multiple select, hover, disperse, and the like. It should be appreciated that the visual modification is a presentation layer functionality and can be rendered immediately.

[0014]As will be appreciated by one skilled in the art, aspects of the present invention may be embodied as a system, method or computer program product. Accordingly, aspects of the presen...


PUM


Abstract

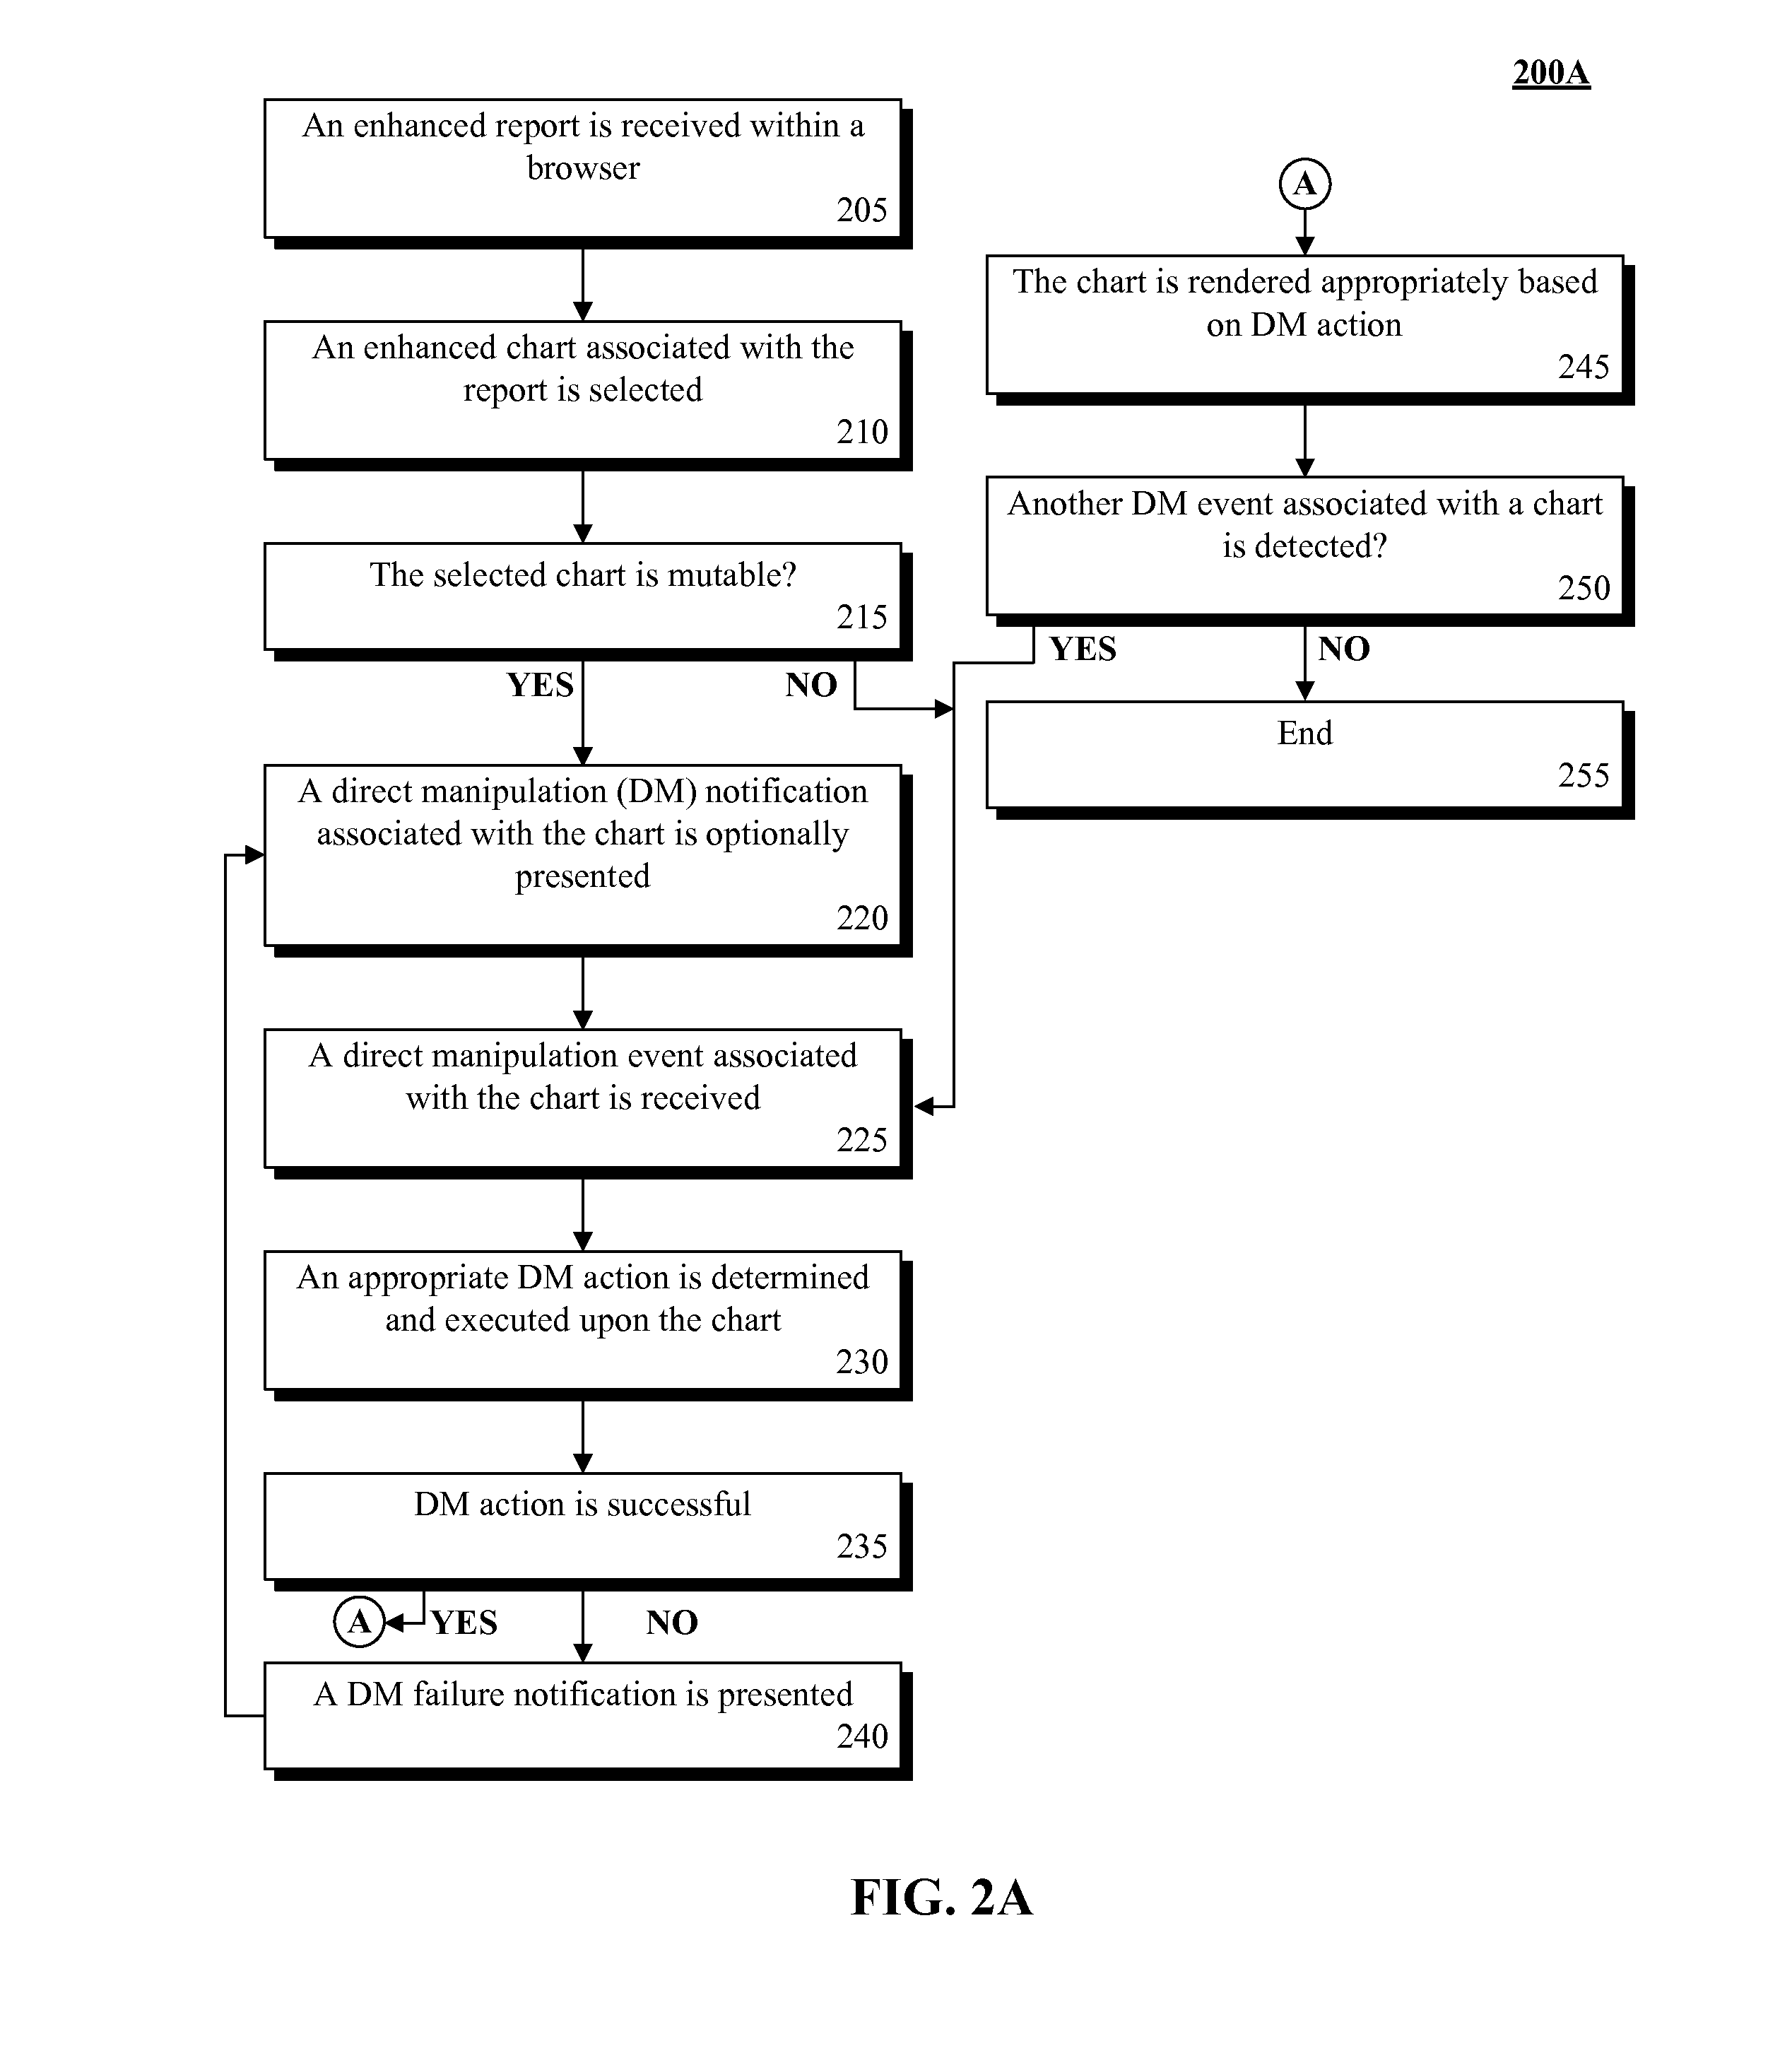
A direct manipulation event associated with a chart of an analytics report can be detected. The event can be a user interface input and the chart can be an information graphic. The graphic can be a graphically rendered HTML compliant element and a data set. The report can conform to a JAVASCRIPT OBJECT NOTATION (JSON) format. The analytics report can be presented within a browser. An action can be run responsive to the detecting. The action can be an immediate rendering of the graphic based on the event. When the action executes a request for data not in the data set data from a different data set can be obtained. When the action executes a request for data in the data set, the data from the data set can be automatically retrieved. The analytics data can be immediately rendered as a chart within the canvas element of an HTML document.

Description

BACKGROUND[0001]The present invention relates to the field of business analytics and, more particularly, to providing direct manipulation of an analytics data visualization within an analytics report.[0002]Analytics often provide key insight into industry changes which companies can frequently leverage to achieve success. Analytic processes can analyze and organize data (e.g., from a database) into human readable analytics reports which can aid business analysts in making critical business decisions. Frequently, reports can be generated from enormous data stores (e.g., Big Data) which can reduce large quantities of data into smaller, intelligible data sets. These data sets can provide a limited amount of analytics data in the form of charts. For example, analytics reports often include a number of static representations like pie charts, bar charts, and line charts which indicate trends in a data set. These charts can be atomic graphical objects (e.g., JPGs, PNGs) which can be presen...

Claims


Application Information

Patent Timeline
Patent Type & Authority Applications(United States)
IPC IPC(8): G06F17/00G06F40/143
CPCG06Q10/10G06F17/2247G06F17/227G06F17/30592G06F17/30572G06F17/30554G06F17/30126G06F16/26G06F16/283G06F16/248G06F16/168G06F40/154G06F40/143
Inventor APPLEYARD, JAMES P.FITZPATRICK, GREGORY P.
Owner IBM CORP
Learn More