Quantification of adaptive immune cell genomes in a complex mixture of cells

a technology of adaptive immune cells and complex mixtures, applied in the field of quantitative analysis of adaptive immune cell genomes in complex mixtures of cells, can solve the problems of inability to obtain meaningful quantitative data from such approaches, limited efforts to obtain meaningful quantitative data, and inability to readily isolate adaptive immune cells. to achieve the effect of reducing and increasing the relative representation of adaptive immune cells

Active Publication Date: 2013-10-31
ADAPTIVE BIOTECH +1
View PDF11 Cites 66 Cited by
  • Summary
  • Abstract
  • Description
  • Claims
  • Application Information

AI Technical Summary

Benefits of technology

[0029]Turning to another embodiment, there is provided herein a method for assessing an effect of a therapeutic treatment on relative representation of adaptive immune cells in at least one tissue of a subject, the tissue comprising adaptive immune cells and cells that are not adaptive immune cells, the method comprising: (I) obtaining one or a plurality of test biological samples from a first tissue of the subject at one or a plurality of time points prior to administering the therapeutic treatment, wherein the test biological sample contains DNA from a mixture of cells, the mixture comprising adaptive immune cells and cells that are not adaptive immune cells; (II) obtaining one or a plurality of test biological samples from a second tissue of the subject at one or a plurality of time points after administering the therapeutic treatment, wherein the test biological sample contains DNA from a mixture of cells, the mixture comprising adaptive immune cells and cells that are not adaptive immune cells; (III) for each of said test biological samples from (I) and (II): (a) amplifying test sample template DNA extracted from the test biological sample in a multiplex quantitative polymerase chain reaction (qPCR) that comprises: (i) a plurality of V-segment oligonucleotide primers that are each independently capable of specifically hybridizing to at least one polynucleotide encoding a T cell receptor (TCR) V-region polypeptide or an immunoglobulin (Ig) V-region polypeptide, wherein each V-segment primer comprises a nucleotide sequence of at least 15 contiguous nucleotides that is complementary to at least one functional TCR or Ig V-encoding gene segment and wherein the plurality of V-segment primers specifically hybridize to substantially all functional TCR or Ig V-encoding gene segments that are present in the test sample, and (ii) a plurality of J-segment oligonucleotide primers that are each independently capable of specifically hybridizing to at least one polynucleotide encoding a T cell receptor (TCR) J-region polypeptide or an immunoglobulin (Ig) J-region polypeptide, wherein each J-segment primer comprises a nucleotide sequence of at least 15 contiguous nucleotides that is complementary to at least one functional TCR or Ig J-encoding gene segment and wherein the plurality of J-segment primers specifically hybridize to substantially all functional TCR or Ig J-encoding gene segments that are present in the test sample, wherein the V-segment and J-segment primers are capable of promoting amplification in said multiplex polymerase chain reaction (PCR) of substantially all rearranged TCR or Ig CDR3-encoding regions in the test sample to produce a multiplicity of amplified rearranged DNA molecules from a population of adaptive immune cells in the test sample; and (b) concurrently with said step of amplifying, measuring at one or a plurality of time points a first DNA signal level that is detectable in said multiplicity of amplified rearranged DNA molecules of (a); (c) comparing at said one or plurality of time points the first DNA signal level measured in (b) to a second DNA signal level that is detectable in amplification products of a known amount of control adaptive immune cell template DNA extracted from a control adaptive immune cell sample that has been amplified by the plurality of V-segment oligonucleotide primers and the plurality of J-segment oligonucleotide primers, and therefrom quantifying a relative amount of adaptive immune cell DNA in the test sample template DNA extracted from the test biological sample; and (d) determining, from the relative amount of adaptive immune cell DNA quantified in (c), the relative representation of adaptive immune cell DNA in the test biological sample; and (IV) comparing the relative representation of adaptive immune cell DNA in at least one test biological sample obtained at a time point prior to administering the therapeutic treatment to the relative representation of adaptive immune cell DNA in at least one test biological sample obtained at a time point after administering the therapeutic treatment, and thereby assessing an effect of the therapeutic treatment on relative representation of adaptive immune cells in at least one tissue of a subject.
[0030]In certain further embodiments the first and second tissues are the same tissue, and in certain other further embodiments the first and second tissues are different tissues. In certain embodiments of the above described method, step (III) further comprises, for each test biological sample, quantifying a relative amount of DNA in the mixture of cells that comprises adaptive immune cells and cells that are not adaptive immune cells, the method comprising: (e) amplifying test sample template DNA extracted from the test biological sample with a set of control primers to produce internal control gene amplification products, wherein the set of control primers amplifies an internal control gene DNA segment that is not specific to adaptive immune cells; (f) concurrently with step (e), measuring at one or a plurality of time points a third DNA signal level that is detectable in the amplification products of (e); (g) comparing, at said one or plurality of time points, the third DNA signal level in (f) to a fourth DNA signal level that is detectable in amplification products of a known amount of internal control gene DNA that has been amplified by the control primers, and therefrom quantifying a relative amount of internal control gene DNA in the test sample template DNA extracted from the test biological sample; and (h) determining, from the relative amount of internal control gene DNA quantified in (g), the relative amount of DNA in the mixture of cells. In certain embodiments the method assesses a dose-related effect of the therapeutic treatment, wherein a plurality of test biological samples are obtained from the second tissue of the subject at a plurality of time points after administering the therapeutic treatment, and wherein the therapeutic treatment is administered at a plurality of different dosages. In certain embodiments the method assesses a prognosis for the subject receiving the therapeutic treatment, wherein an altered relative representation of adaptive immune cell DNA in at least one test biological sample obtained at a time point after administering the therapeutic treatment compared to the relative representation of adaptive immune cell DNA in at least one test biological sample obtained at a time point prior to administering the therapeutic treatment, indicates an effect of the therapeutic treatment on relative representation of adaptive immune cells in at least one tissue of a subject.
[0031]In certain further embodiments the method is selected from: (i) the method in which the subject has cancer and an increased relative representation of adaptive immune cell DNA in at least one test biological sample obtained at a time point after administering the therapeutic treatment compared to the relative representation of adaptive immune cell DNA in at least one test biological sample obtained at a time point prior to administering the therapeutic treatment, indicates a beneficial effect of the therapeutic treatment; (ii) the method in which the subject has an autoimmune disease and a decreased relative representation of adaptive immune cell DNA in at least one test biological sample obtained at a time point after administering the therapeutic treatment compared to the relative representation of adaptive immune cell DNA in at least one test biological sample obtained at a time point prior to administering the therapeutic treatment, indicates a beneficial effect of the therapeutic treatment; and (iii) the method in which the subject has a transplanted organ and a decreased relative representation of adaptive immune cell DNA in at least one test biological sample from the transplanted organ obtained at a time point after administering the therapeutic treatment compared to the relative representation of adaptive immune cell DNA in at least one test biological sample from the transplanted organ obtained at a time point prior to administering the therapeutic treatment, indicates beneficial effect of the therapeutic treatment. In certain embodiments the method further comprises determining a polynucleotide sequence for each amplified rearranged DNA molecule from the population of adaptive immune cells in the test sample.

Problems solved by technology

Current approaches to the detection and quantification of adaptive immune cells in tissues or organs from which adaptive immune cells cannot be readily isolated, however, are far more limited.
Efforts to obtain meaningful quantitative data from such approaches are severely limited with regard to the number of adaptive immune cells that may have infiltrated a tissue, for instance, where high statistical significance cannot be achieved when sample collection depends on the number of events that can be detected by observation of a finite number of small fields on microscope slides.
740-742), although such time-consuming and labor-intensive steps are likely to result in incomplete recovery of lymphocytes from the sample due to loss or destruction of a portion of the sample in the course of handling.
These and related limitations of the current approaches compromise the quality of quantitative data that may be obtained.

Method used


Image

  • Quantification of adaptive immune cell genomes in a complex mixture of cells
  • Quantification of adaptive immune cell genomes in a complex mixture of cells
  • Quantification of adaptive immune cell genomes in a complex mixture of cells

Examples


example 1

Quantification of Relative T Lymphocyte DNA Representation from T Cells in Normal Tissues and from Tumor—Infiltrating T Lymphocytes in a Tumor Sample

[0161]Samples of peripheral blood, fresh adipose biopsies, frozen muscle biopsy, and skin biopsies were processed for DNA extraction using the following procedure:

[0162]Samples of 1×10⁴ to 1×10⁶ fresh, frozen, or fixed cells were lysed in 200 ul of lysis buffer (50 mM TrisHCl pH7.4, 250 mM NaCl, 0.1% SDS, 0.5% Triton-X100) and 20 ul of proteinase K (10 mg / ml) using the kitted ATL buffer and proteinase K reagents from the Qiagen Blood and Tissue kit (Qiagen #69504, Qiagen Corp., Valencia, Calif.), and incubated at 56° C. for one hour with mixing every 20 minutes. The lysate was diluted with 200 ul of an ethanol / buffer mixture (20 mM Tris, pH 7.5, 2.0 mM EDTA, in 50% v / v ethanol) and mixed briefly. Alternatively, the AL buffer of the Qiagen Blood and Tissue kit was used. SDS precipitates formed on occasion, but were not observed to advers...

example 2

Quantification of Tumor—Infiltrating T Lymphocytes in a Tumor Sample Using a TCRδ V-Region Specific qPCR Probe

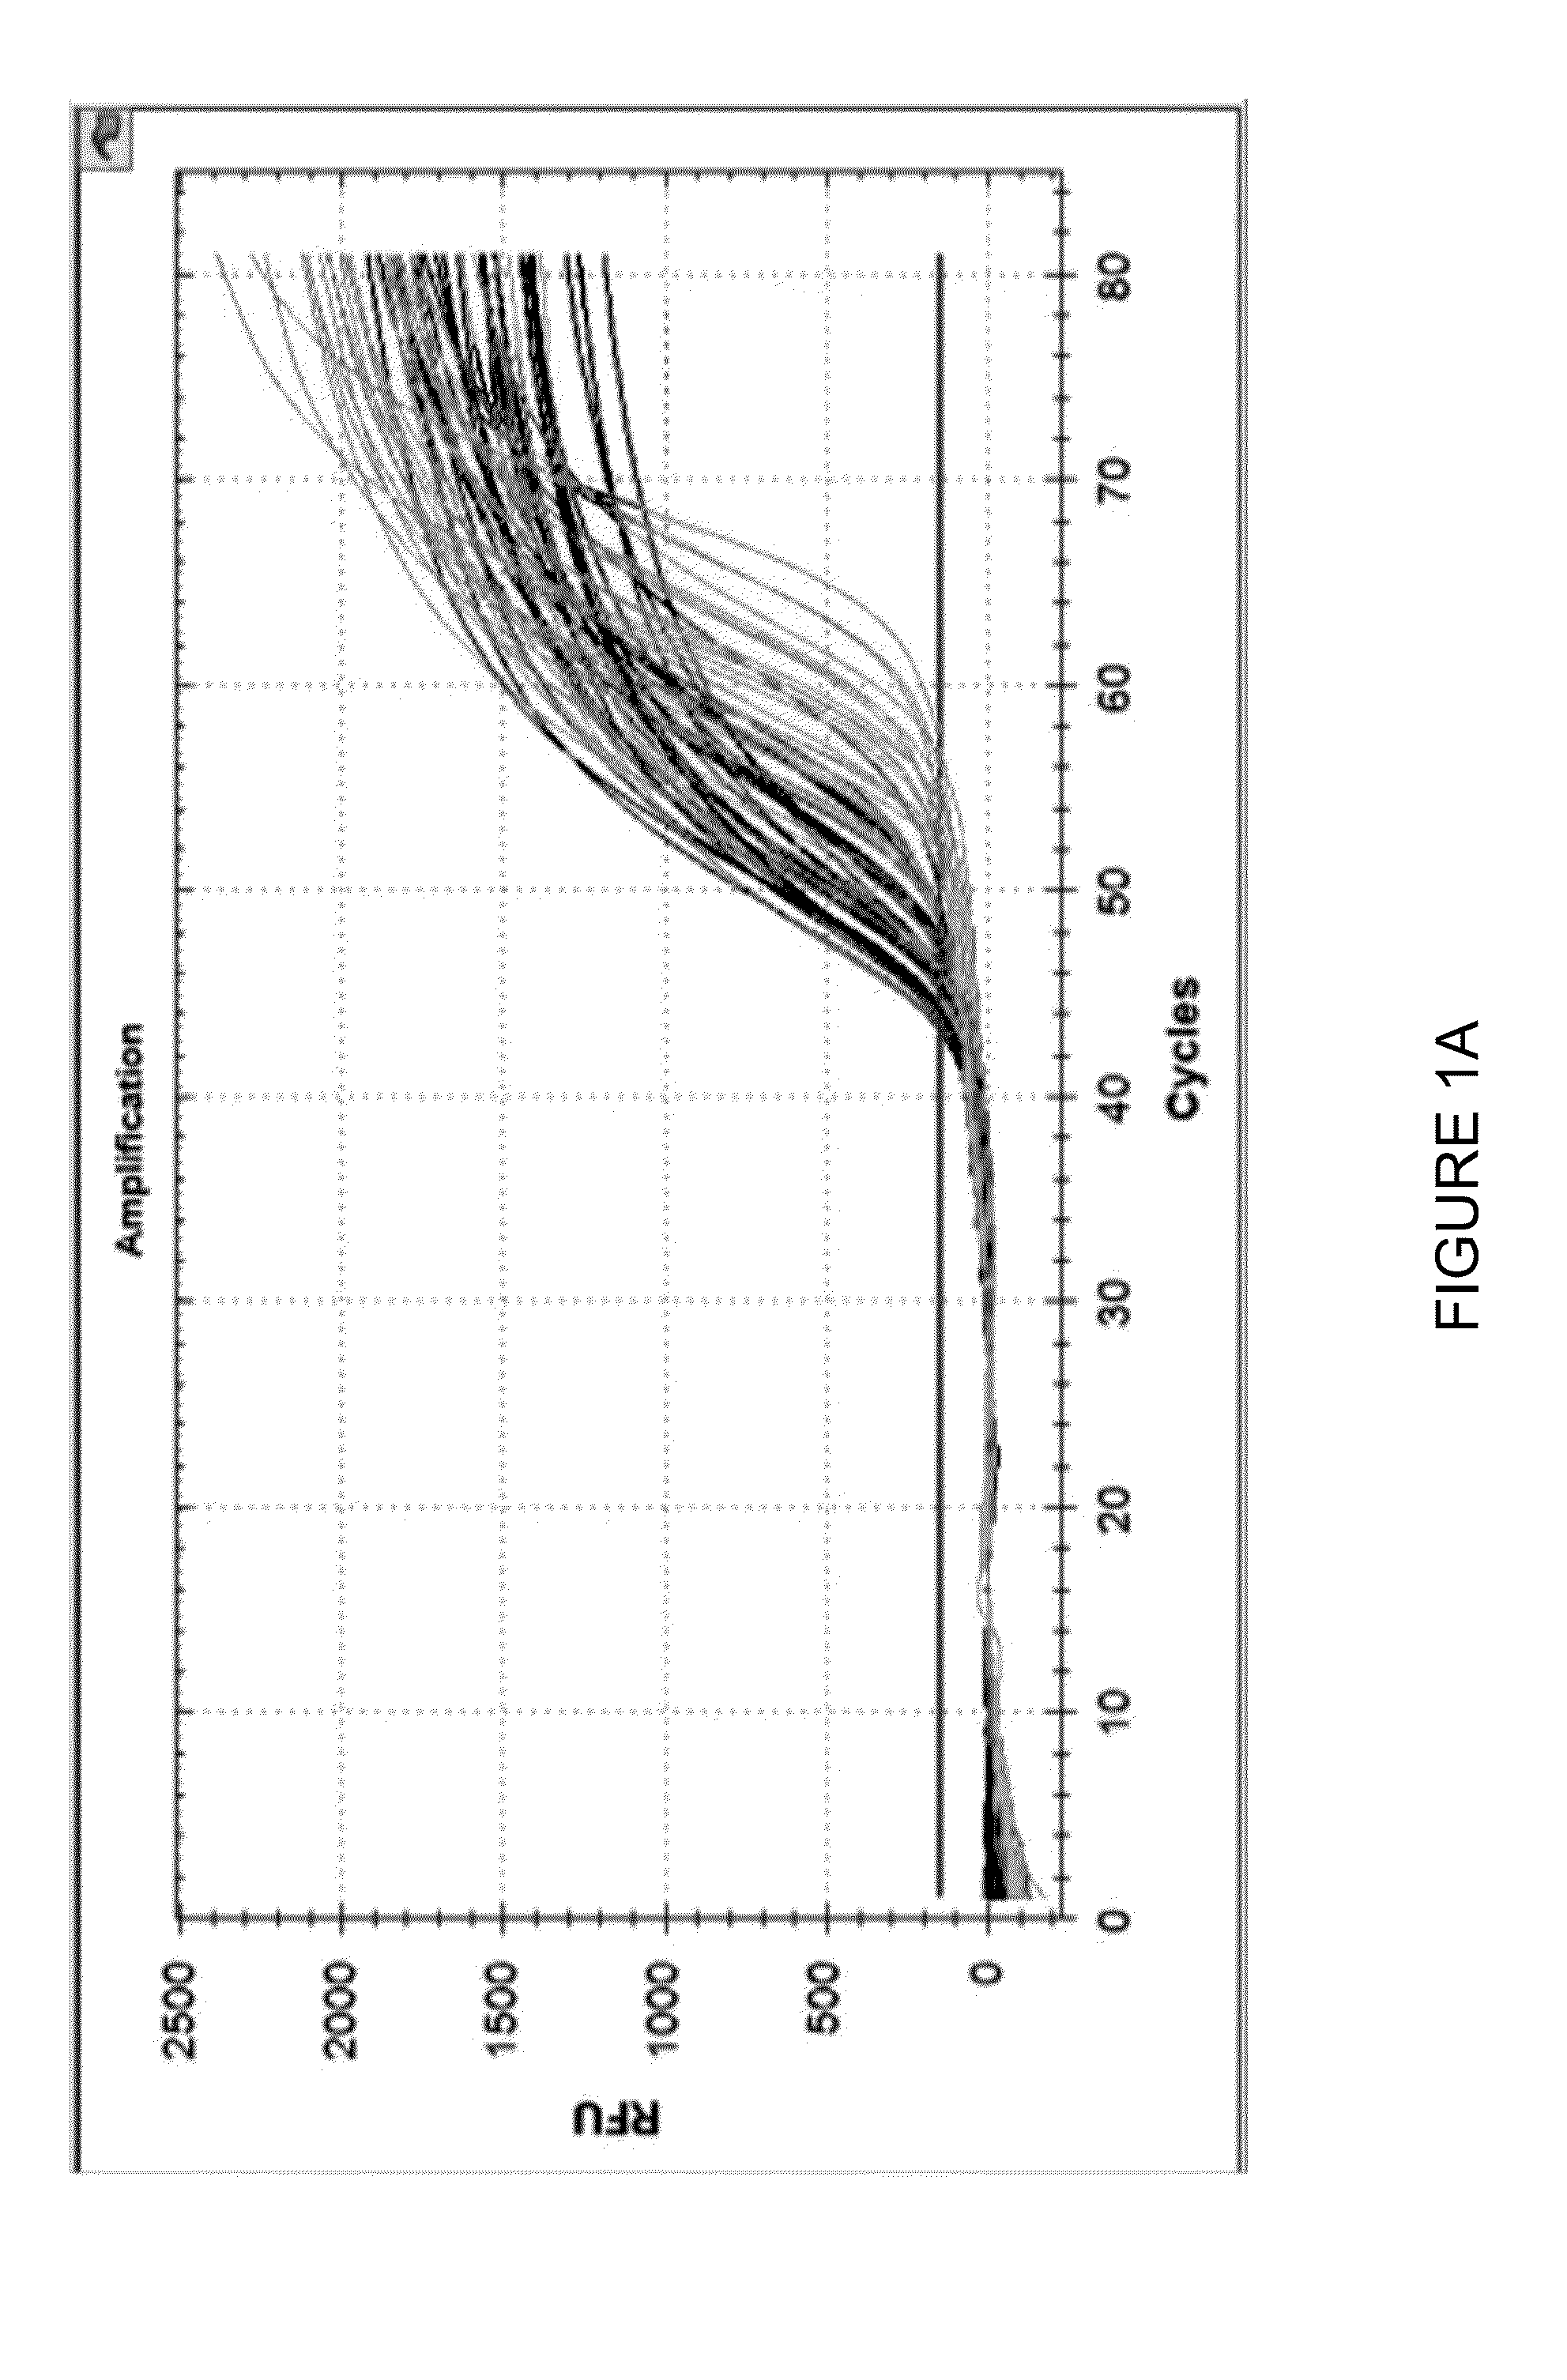
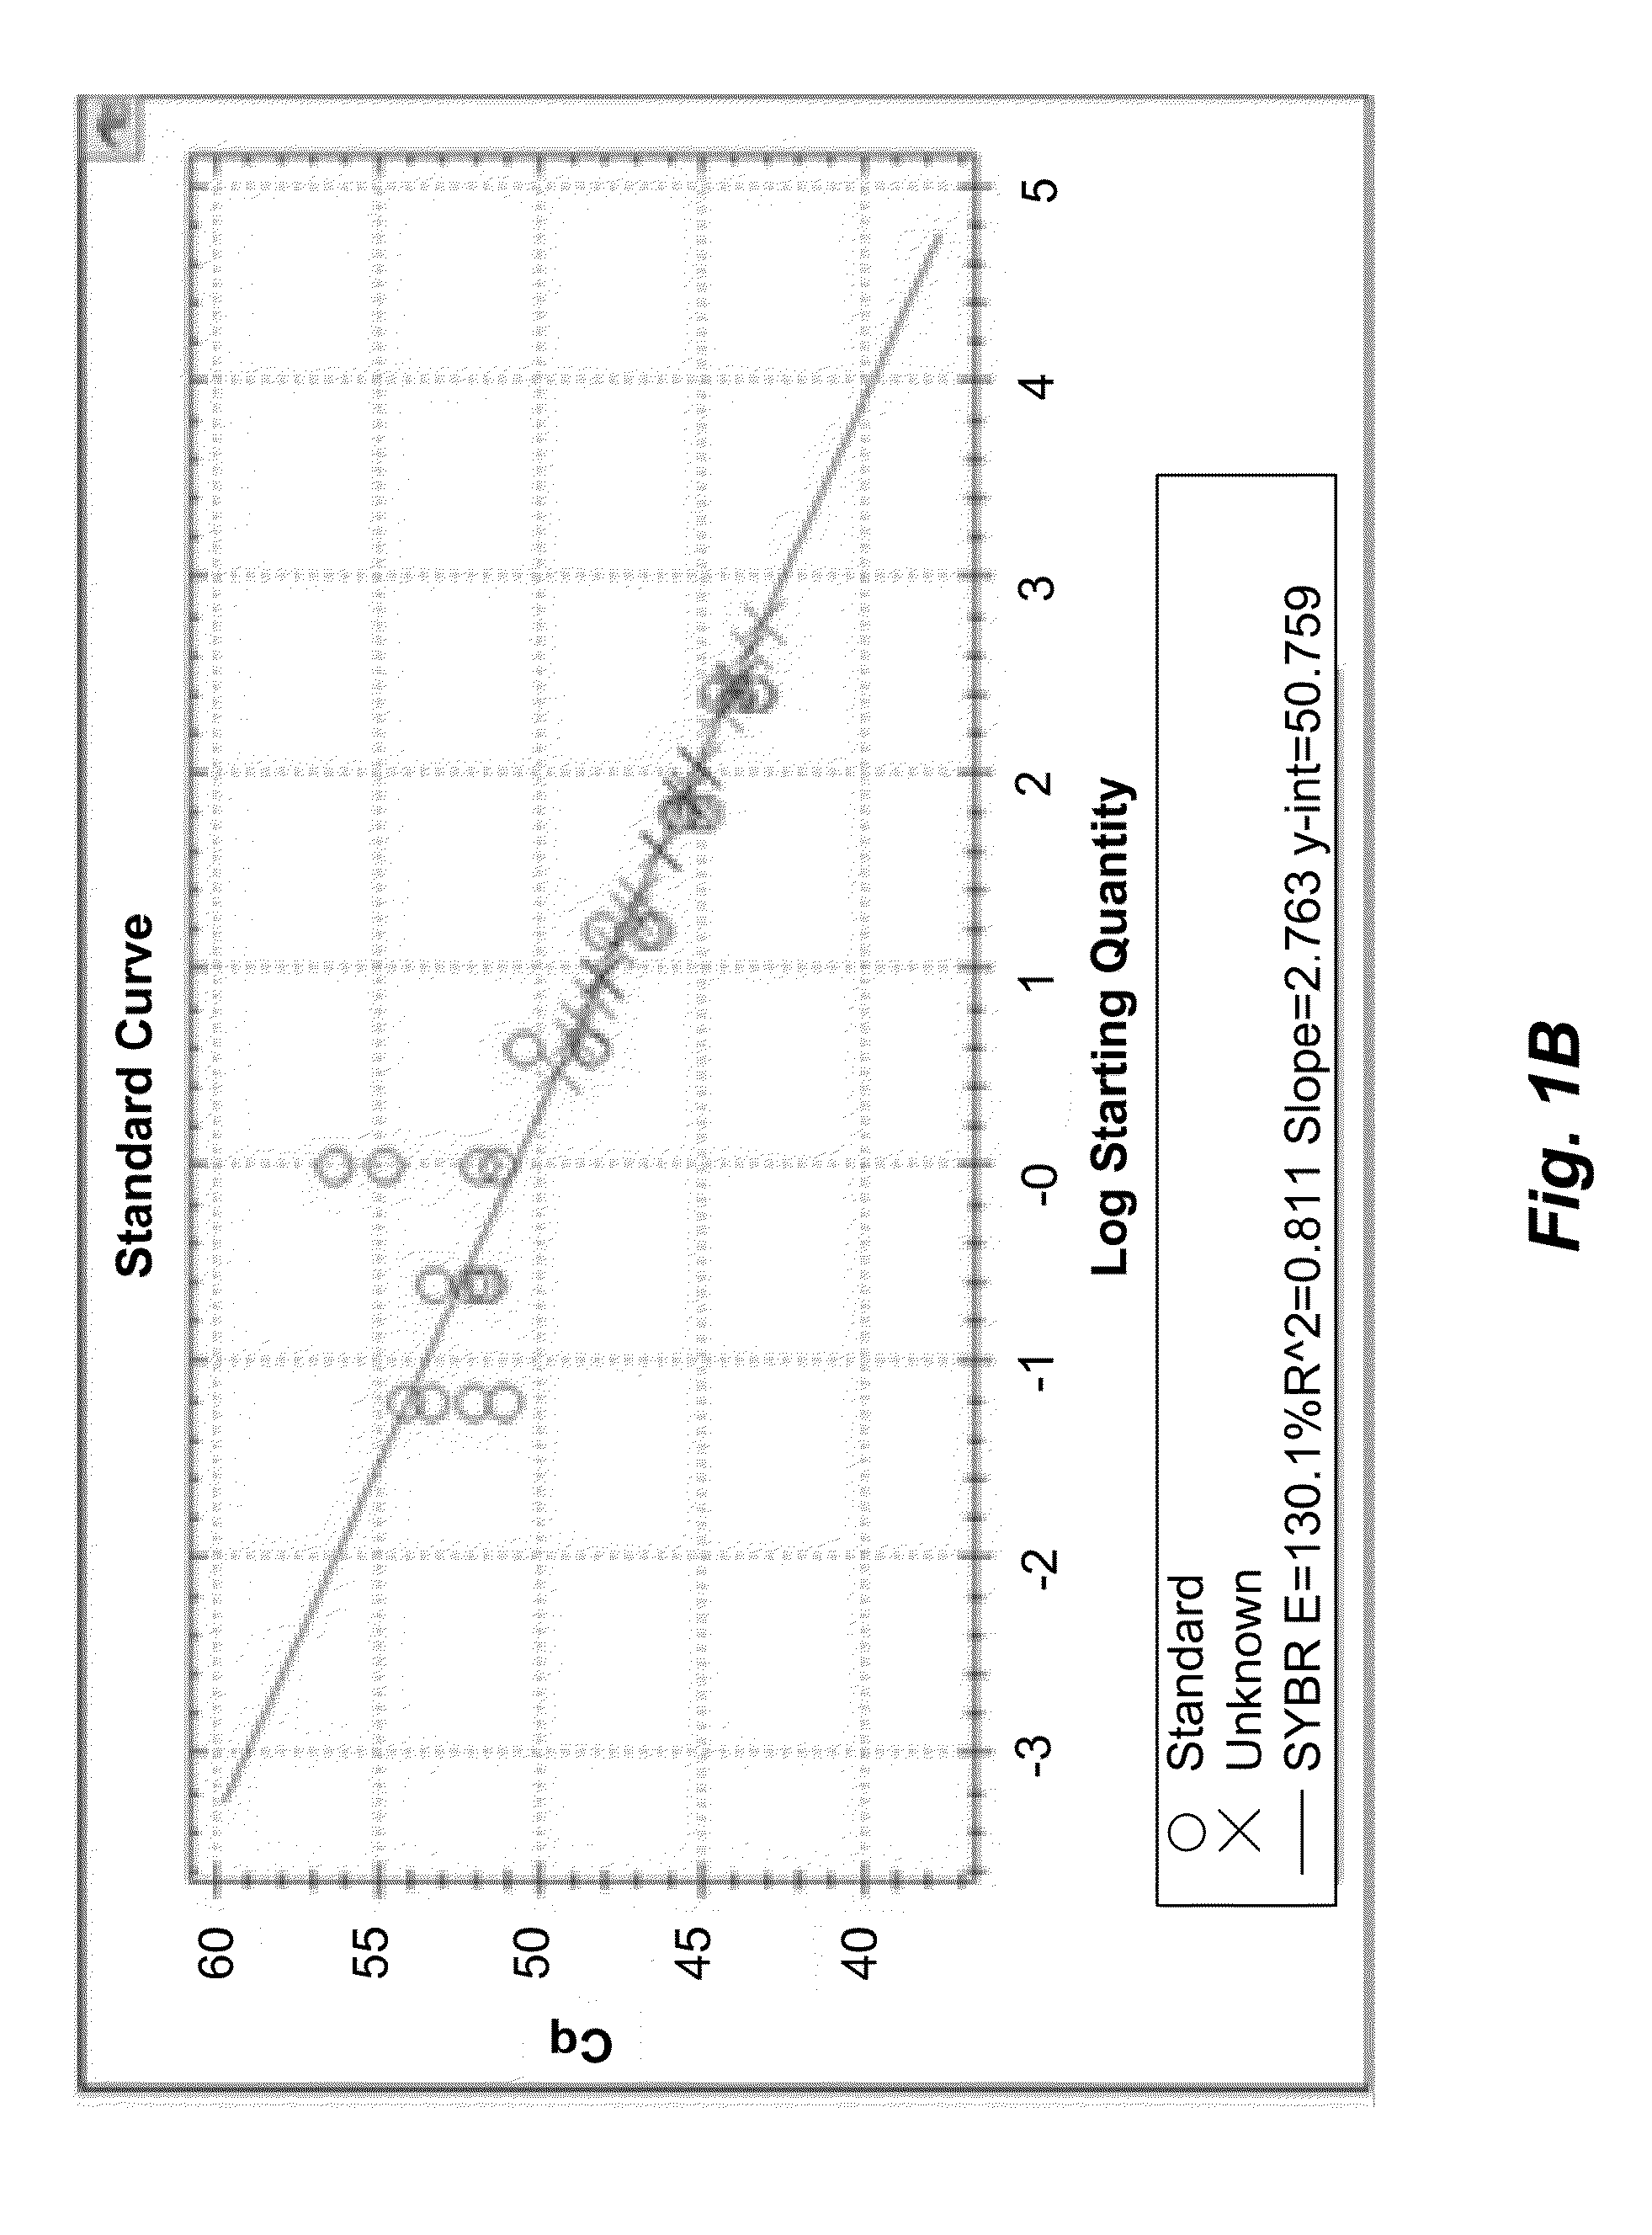
[0166]Tumor-infiltrating T lymphocytes (TILs) were quantified using a multiplex real-time PCR assay as follows.

[0167]Multiplex Primer Sequences:

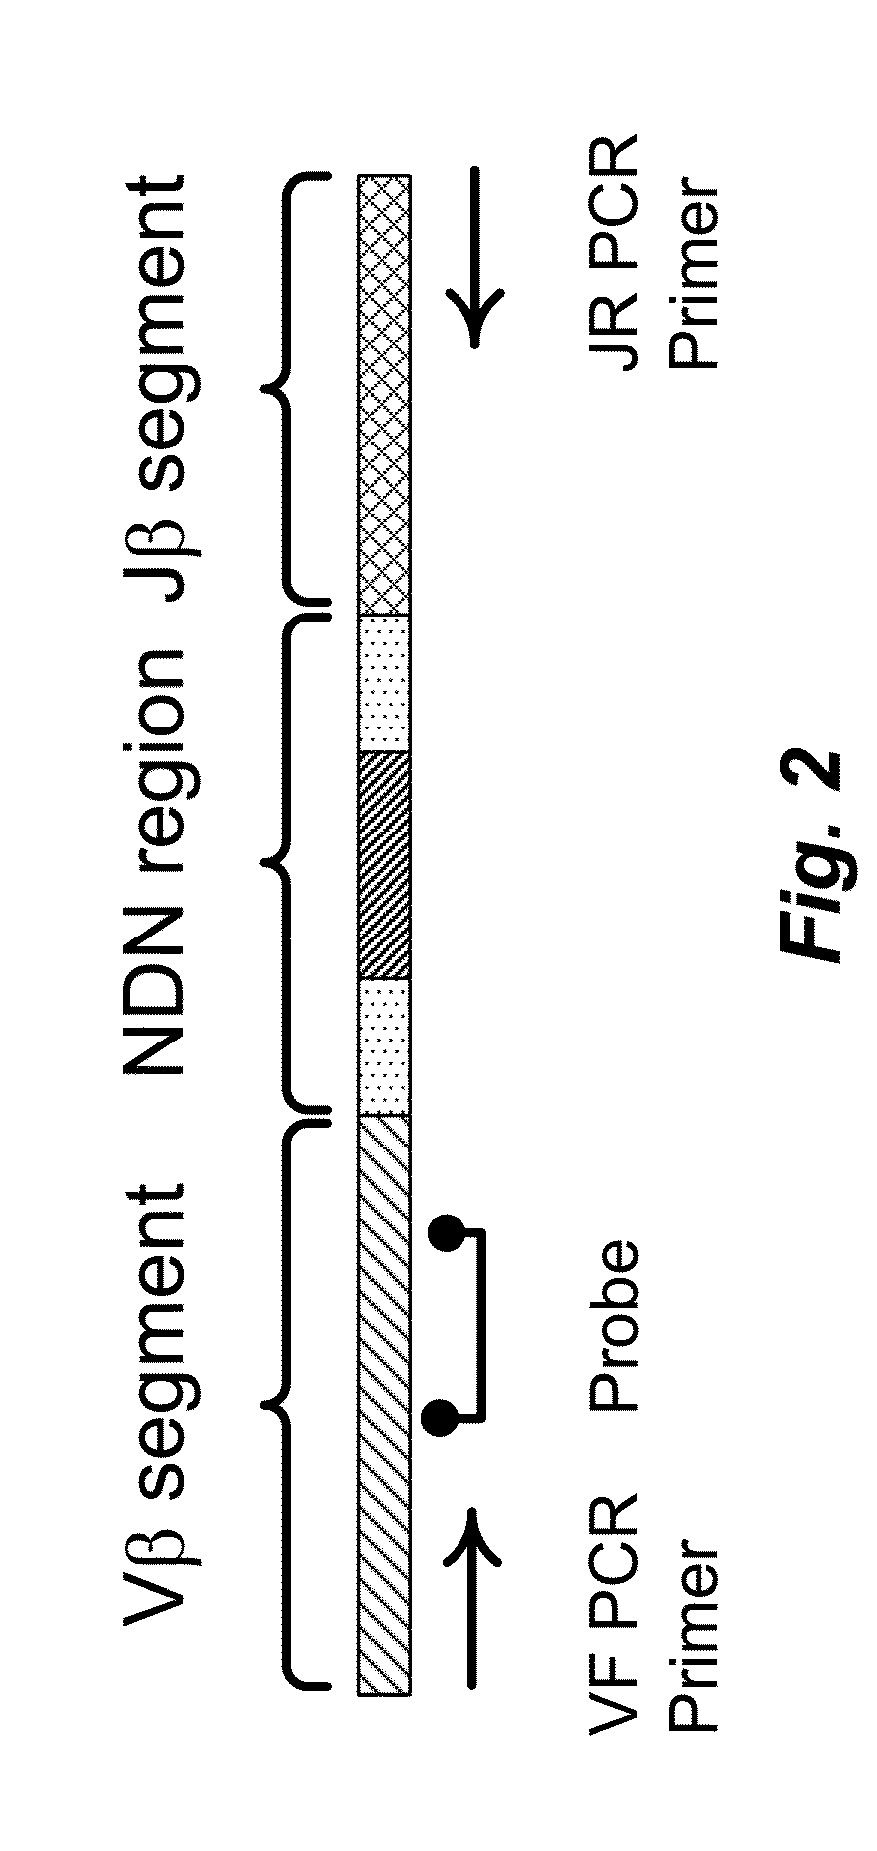
[0168]The multiplex oligonucleotide primer sets that were used had the sequences shown in Table 1. The “r” in Table 1B represents a ribonucleotide base in the oligonucleotide sequence and “ / 3SpC3 / ” represents a 3′ three carbon spacer on the hydroxyl group preventing polymerase extension and amplification. The DNA repair endonuclease cleaves the oligonucleotide at the ribonucleotide after hybridization to a complementary sequence, creating an unblocked hydroxyl group that can be extended by a polymerase.

[0169]Assay Reagents:

[0170]20 μl PCR reactions were set up having final concentrations of 1× Taq polymerase buffer, 10 ng / ul analyte DNA, 1 micromolar TCRBV_RN2 oligonucleotide primer mix (Table 1), 1 micromolar TCRBJ_RN2 oligonucleoti...

example 3

Quantification of Tumor—Infiltrating T Lymphocytes in a Tumor Sample Using a V7-Specific qPCR Probe

[0180]TCRB V7+ tumor-infiltrating T lymphocytes are quantified using a multiplex real-time PCR assay as follows.

[0181]Multiplex Primer Sequences:

[0182]The multiplex primer sequences are provided in Table 1. The “r” represents a ribonucleotide base in the oligonucleotide sequence and “ / 3SpC3 / ” represents a 3′ three carbon spacer on the hydroxyl group preventing polymerase extension and amplification. The DNA repair endonuclease cleaves the oligonucleotide at the ribonucleotide after hybridization to a complementary sequence, creating an unblocked hydroxyl group that can be extended by a polymerase.

[0183]Assay Reagents (Volumes and Concentrations):

[0184]The assay consists of a 20 μl PCR reaction at final concentrations of 1× Taq polymerase buffer, 10 ng / ul analyte DNA, 1 micromolar TCRBV_RN2 oligonucleotide primer mix, 1 micromolar TCRBJ_RN2 oligonucleotide primer mix) 100 nanomolar TaqM...


PUM

PropertyMeasurementUnit
massaaaaaaaaaa
pHaaaaaaaaaa
temperatureaaaaaaaaaa

Abstract

Compositions and methods are described for highly sensitive quantification of the relative representation of DNA from adaptive immune cells (e.g., T and/or B lymphocytes) in DNA extracted from complex mixtures of cells that include cells which are not adaptive immune cells. Included are methods for determining the relative presence in a tumor of tumor infiltrating lymphocytes (TIL), the relative presence of lymphocytes infiltrating a somatic tissue that is the target of an autoimmune disease, and the relative presence of lymphocytes infiltrating a transplanted organ.

Description

SEQUENCE LISTING[0001]The Sequence Listing associated with this application is provided in text format in lieu of a paper copy, and is hereby incorporated by reference into the specification. The name of the text file containing the Sequence Listing is 100168.404_SEQUENCE_LISTING.txt. This text file was created on Oct. 19, 2012, is about 315 KB, and is being submitted electronically via EFS-Web.BACKGROUND[0002]1. Technical Field[0003]The present disclosure relates generally to the highly sensitive quantification of the relative representation of adaptive immune cells in complex mixtures of cells using multiplex digital polymerase chain reaction (dPCR) or multiplex quantitative polymerase chain reaction (qPCR). In particular, the present disclosure relates to methods for quantitative determination of lymphocyte presence in complex tissues including solid tissues, such as quantification of tumor-infiltrating lymphocyte (TIL) genomes as a relative proportion of all cellular genomes tha...

Claims


Application Information

Patent Timeline
Patent Type & Authority Applications(United States)
IPC IPC(8): C12Q1/68
CPCC12Q1/6888C12Q1/686C12Q2600/16C12Q2600/158C12Q1/6881
Inventor ROBINS, HARLAN S.LIVINGSTON, ROBERT J.BIELAS, JASON H.
Owner ADAPTIVE BIOTECH
Why Eureka
Try Eureka