Combining parallel coordinates and histograms
a parallel coordinate and histogram technology, applied in the field of data visualization, can solve problems such as fast overwhelming with a large number of data
- Summary
- Abstract
- Description
- Claims
- Application Information
AI Technical Summary
Benefits of technology
Problems solved by technology
Method used
Image
Examples
Embodiment Construction
[0016]The present technology may provide data visualization with the capability of combining parallel coordinates and histograms. Parallel coordinates typically display lines between two or more vertical lines representing a coordinate element. Rather than displaying lines between coordinate element lines, histograms are provided at each element line to indicate the instances of data associated with line values. To create parallel coordinates with histograms, bin values may be determined for the parallel coordinates. Data is then accessed, and a particular bin value is incremented for each data point that falls within the bin. The parallel coordinates are then displayed with the histograms indicating a quantity of data associated with each coordinate value.
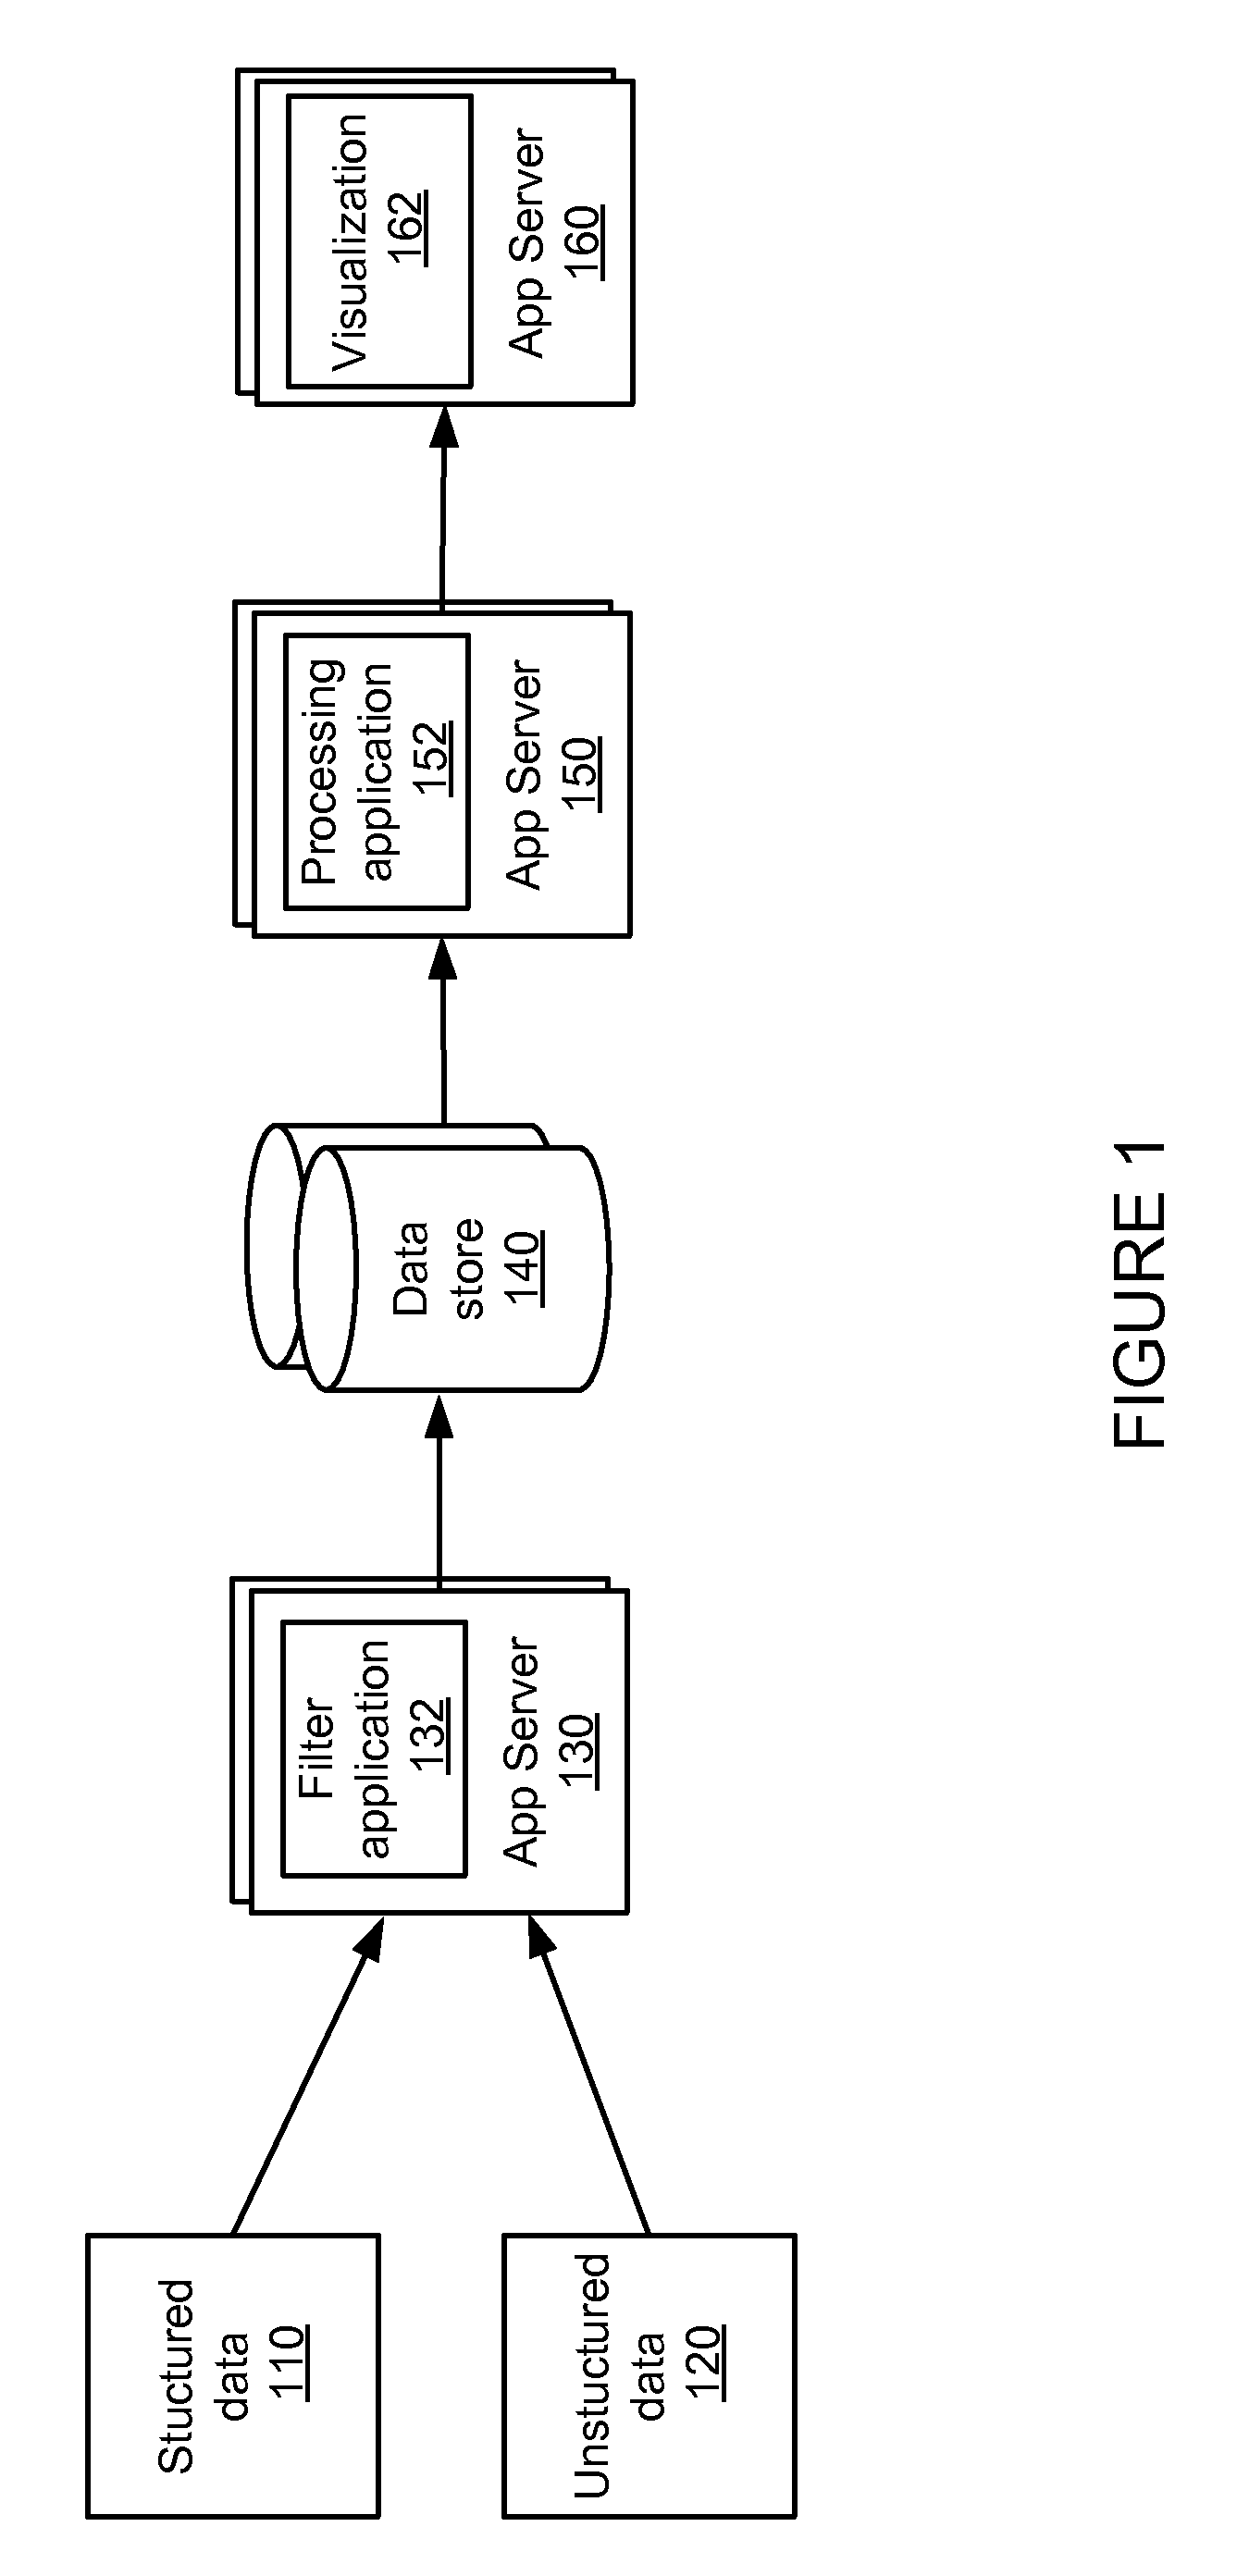
[0017]FIG. 1 is a system for processing and visualizing data. The system of FIG. 1 includes structured data 110, unstructured data 120, application servers 130, 150 and 160, and data store 140. Structured data 110 (RDMS data) may ...
PUM
 Abstract
Description
Claims
Application Information
 - R&D
- Intellectual Property
- Life Sciences
- Materials
- Tech Scout
- Unparalleled Data Quality
- Higher Quality Content
- 60% Fewer Hallucinations
Browse by: Latest US Patents, China's latest patents, Technical Efficacy Thesaurus, Application Domain, Technology Topic, Popular Technical Reports.
© 2025 PatSnap. All rights reserved.Legal|Privacy policy|Modern Slavery Act Transparency Statement|Sitemap|About US| Contact US: help@patsnap.com


