
Analysis of Captured Random Data Signals to Measure Linear and Nonlinear Distortions

a random data signal and analysis technology, applied in the field of detection of linear and nonlinear distortions, can solve the problems of nonlinear distortion, frequent generation of linear and nonlinear distortions in equipment used in cable systems, and excessive distortions affecting images

Active Publication Date: 2015-02-12
CABLE TELEVISION LAB
View PDF5 Cites 22 Cited by
  • Summary
  • Abstract
  • Description
  • Claims
  • Application Information

AI Technical Summary

Benefits of technology

This patent text describes various methods for detecting nonlinear distortion in signals. Nonlinear distortion can be caused by various components in the signal transmission path, such as electronic components or the atmosphere. The technical effect of the patent text is to provide methods for accurately measuring nonlinear distortion in signals, which can aid in identifying the cause and source of distortion. This can help in improving the quality and stability of signals transmitted through various paths. Additionally, the patent text also describes a method for measuring linear distortion in signals.

Problems solved by technology

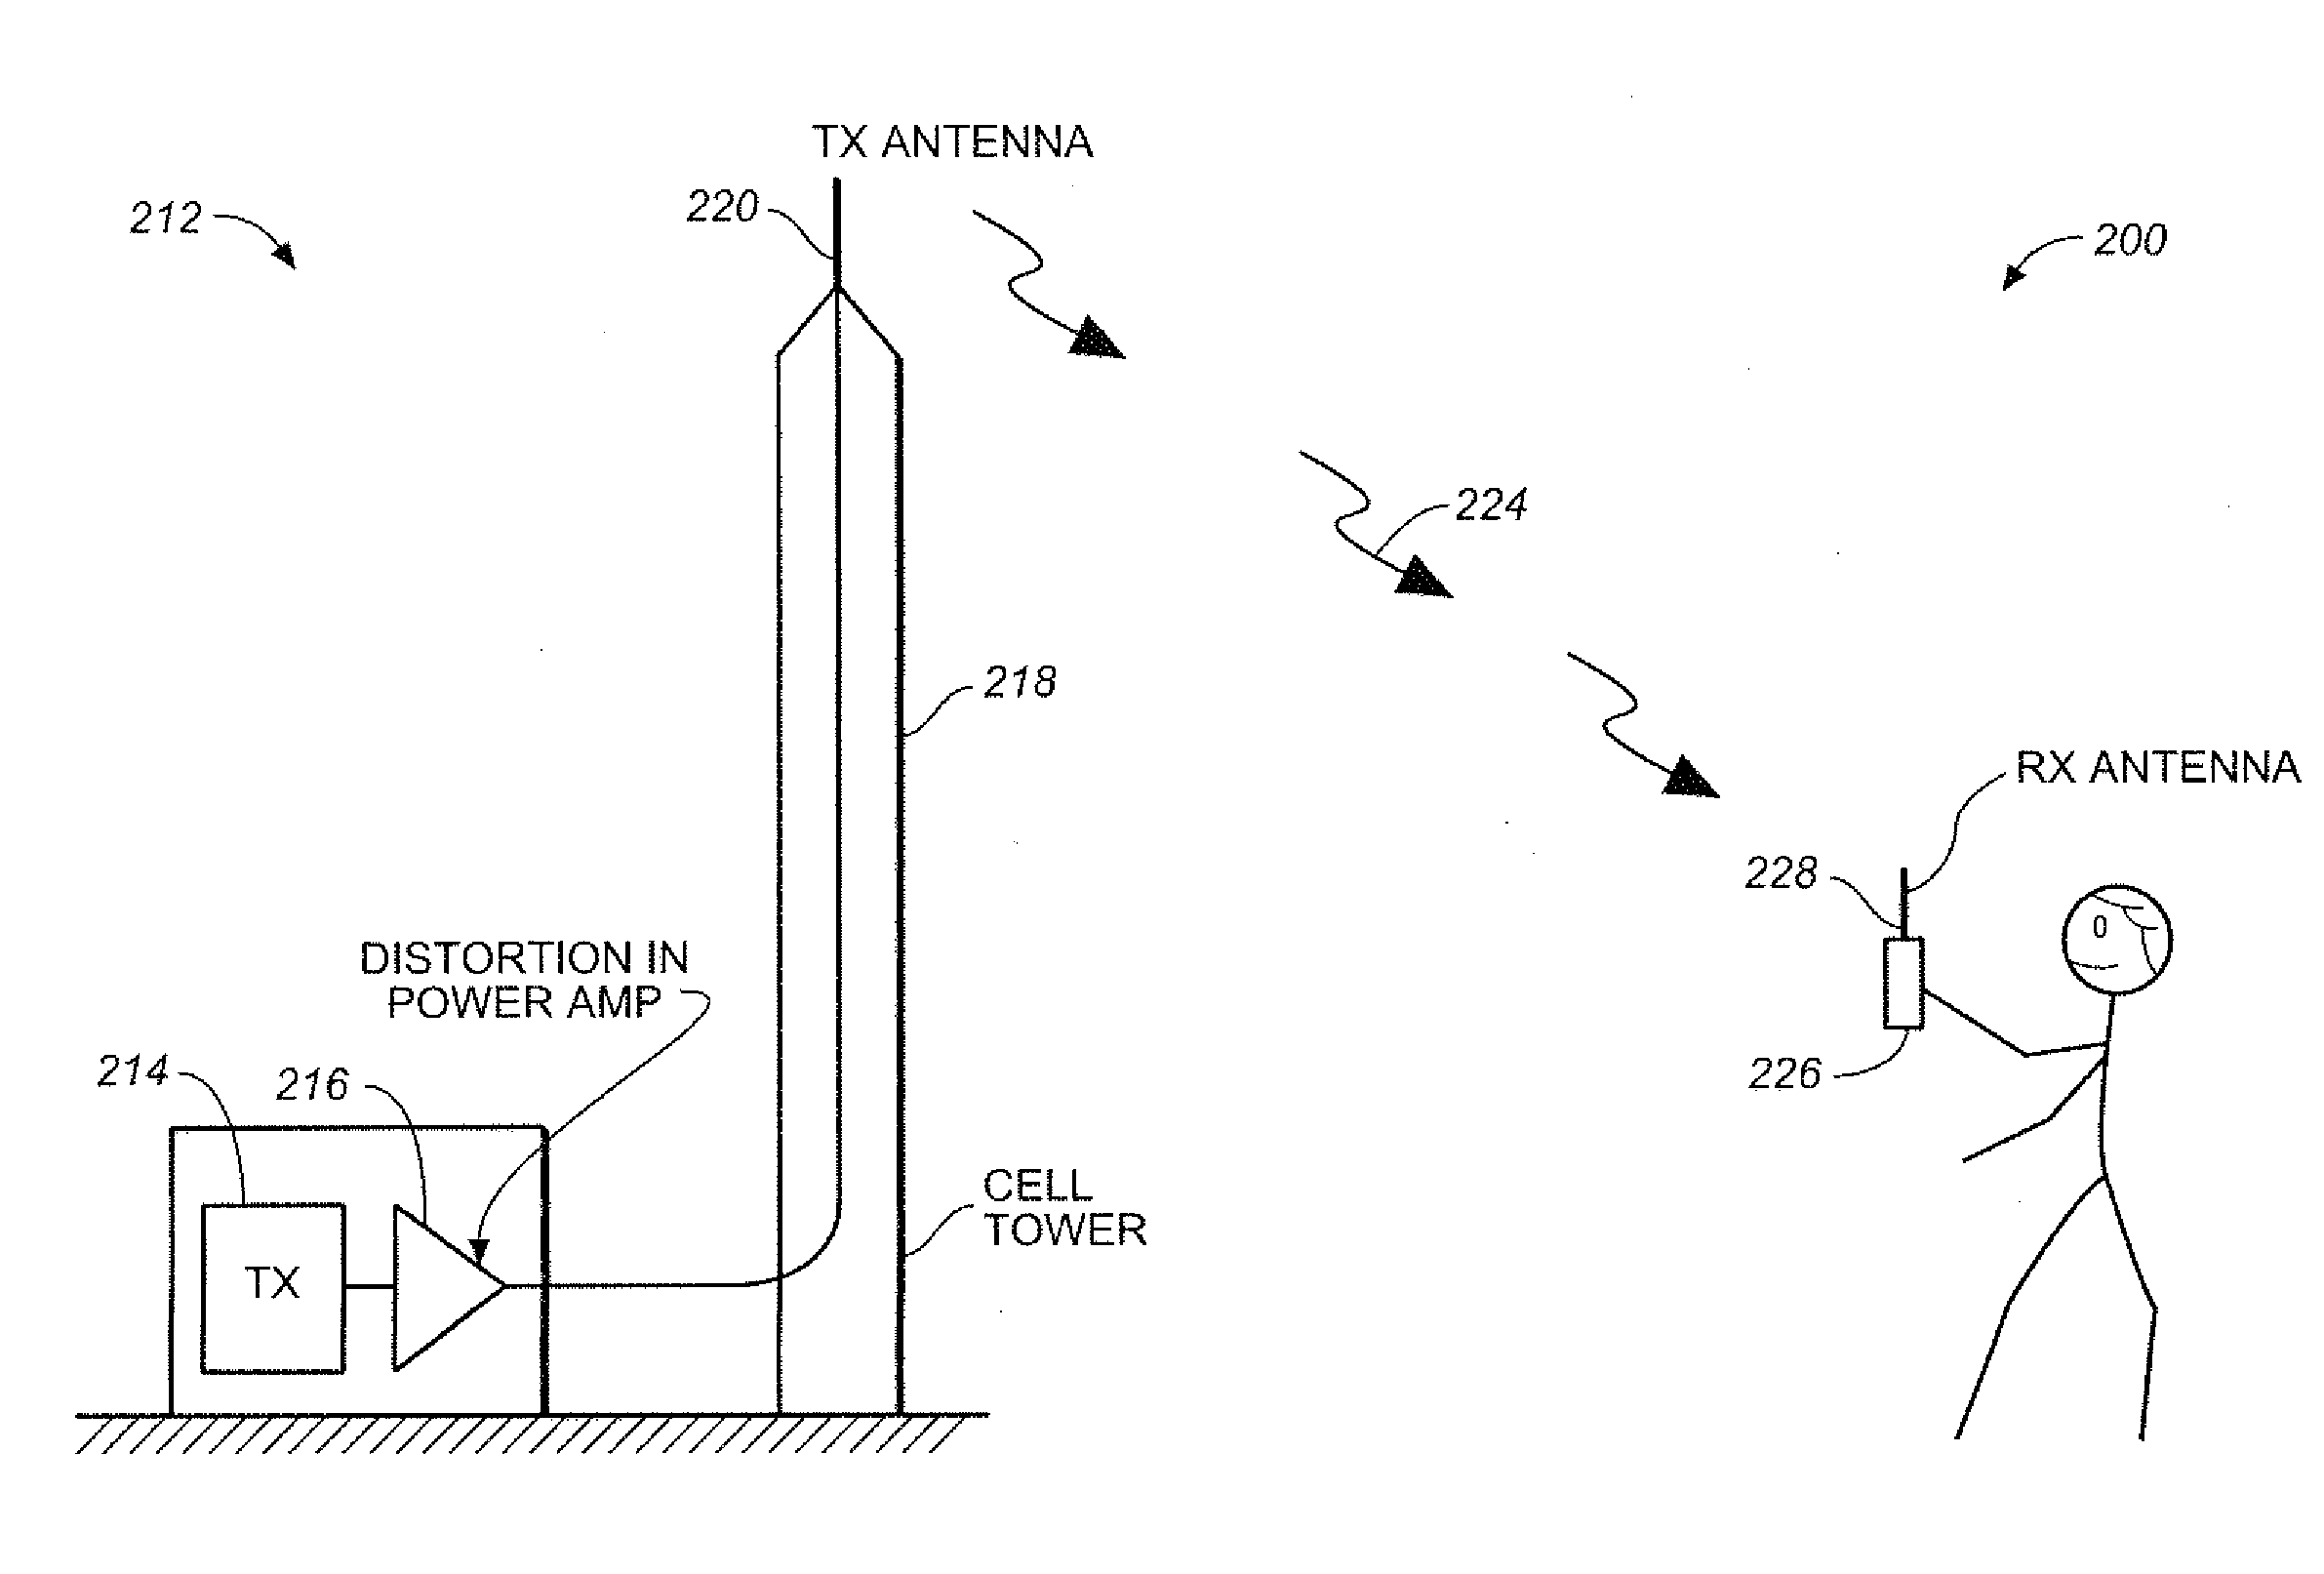
Linear and nonlinear distortions are frequently generated in equipment used in cable systems, and in wireless systems.
Thus, nonlinear distortions such as second, third or higher order distortion signals may for example be generated by (overdriven) amplifiers and linear distortions may be caused by multi-path reflections (where reflections accompany the original signal), group delay (where signals at different frequencies travel at different velocities) or amplitude tilt (where signals at different frequencies suffer different attenuations).
Excessive distortions affect the image and audio quality experienced by consumers and truck-rolls are typically required in conventional cable and wireless systems to test and identify the source of such distortions and to correct them.
Needless to say, such services are expensive.

Method used


Image

  • Analysis of Captured Random Data Signals to Measure Linear and Nonlinear Distortions
  • Analysis of Captured Random Data Signals to Measure Linear and Nonlinear Distortions
  • Analysis of Captured Random Data Signals to Measure Linear and Nonlinear Distortions

Examples


Embodiment Construction

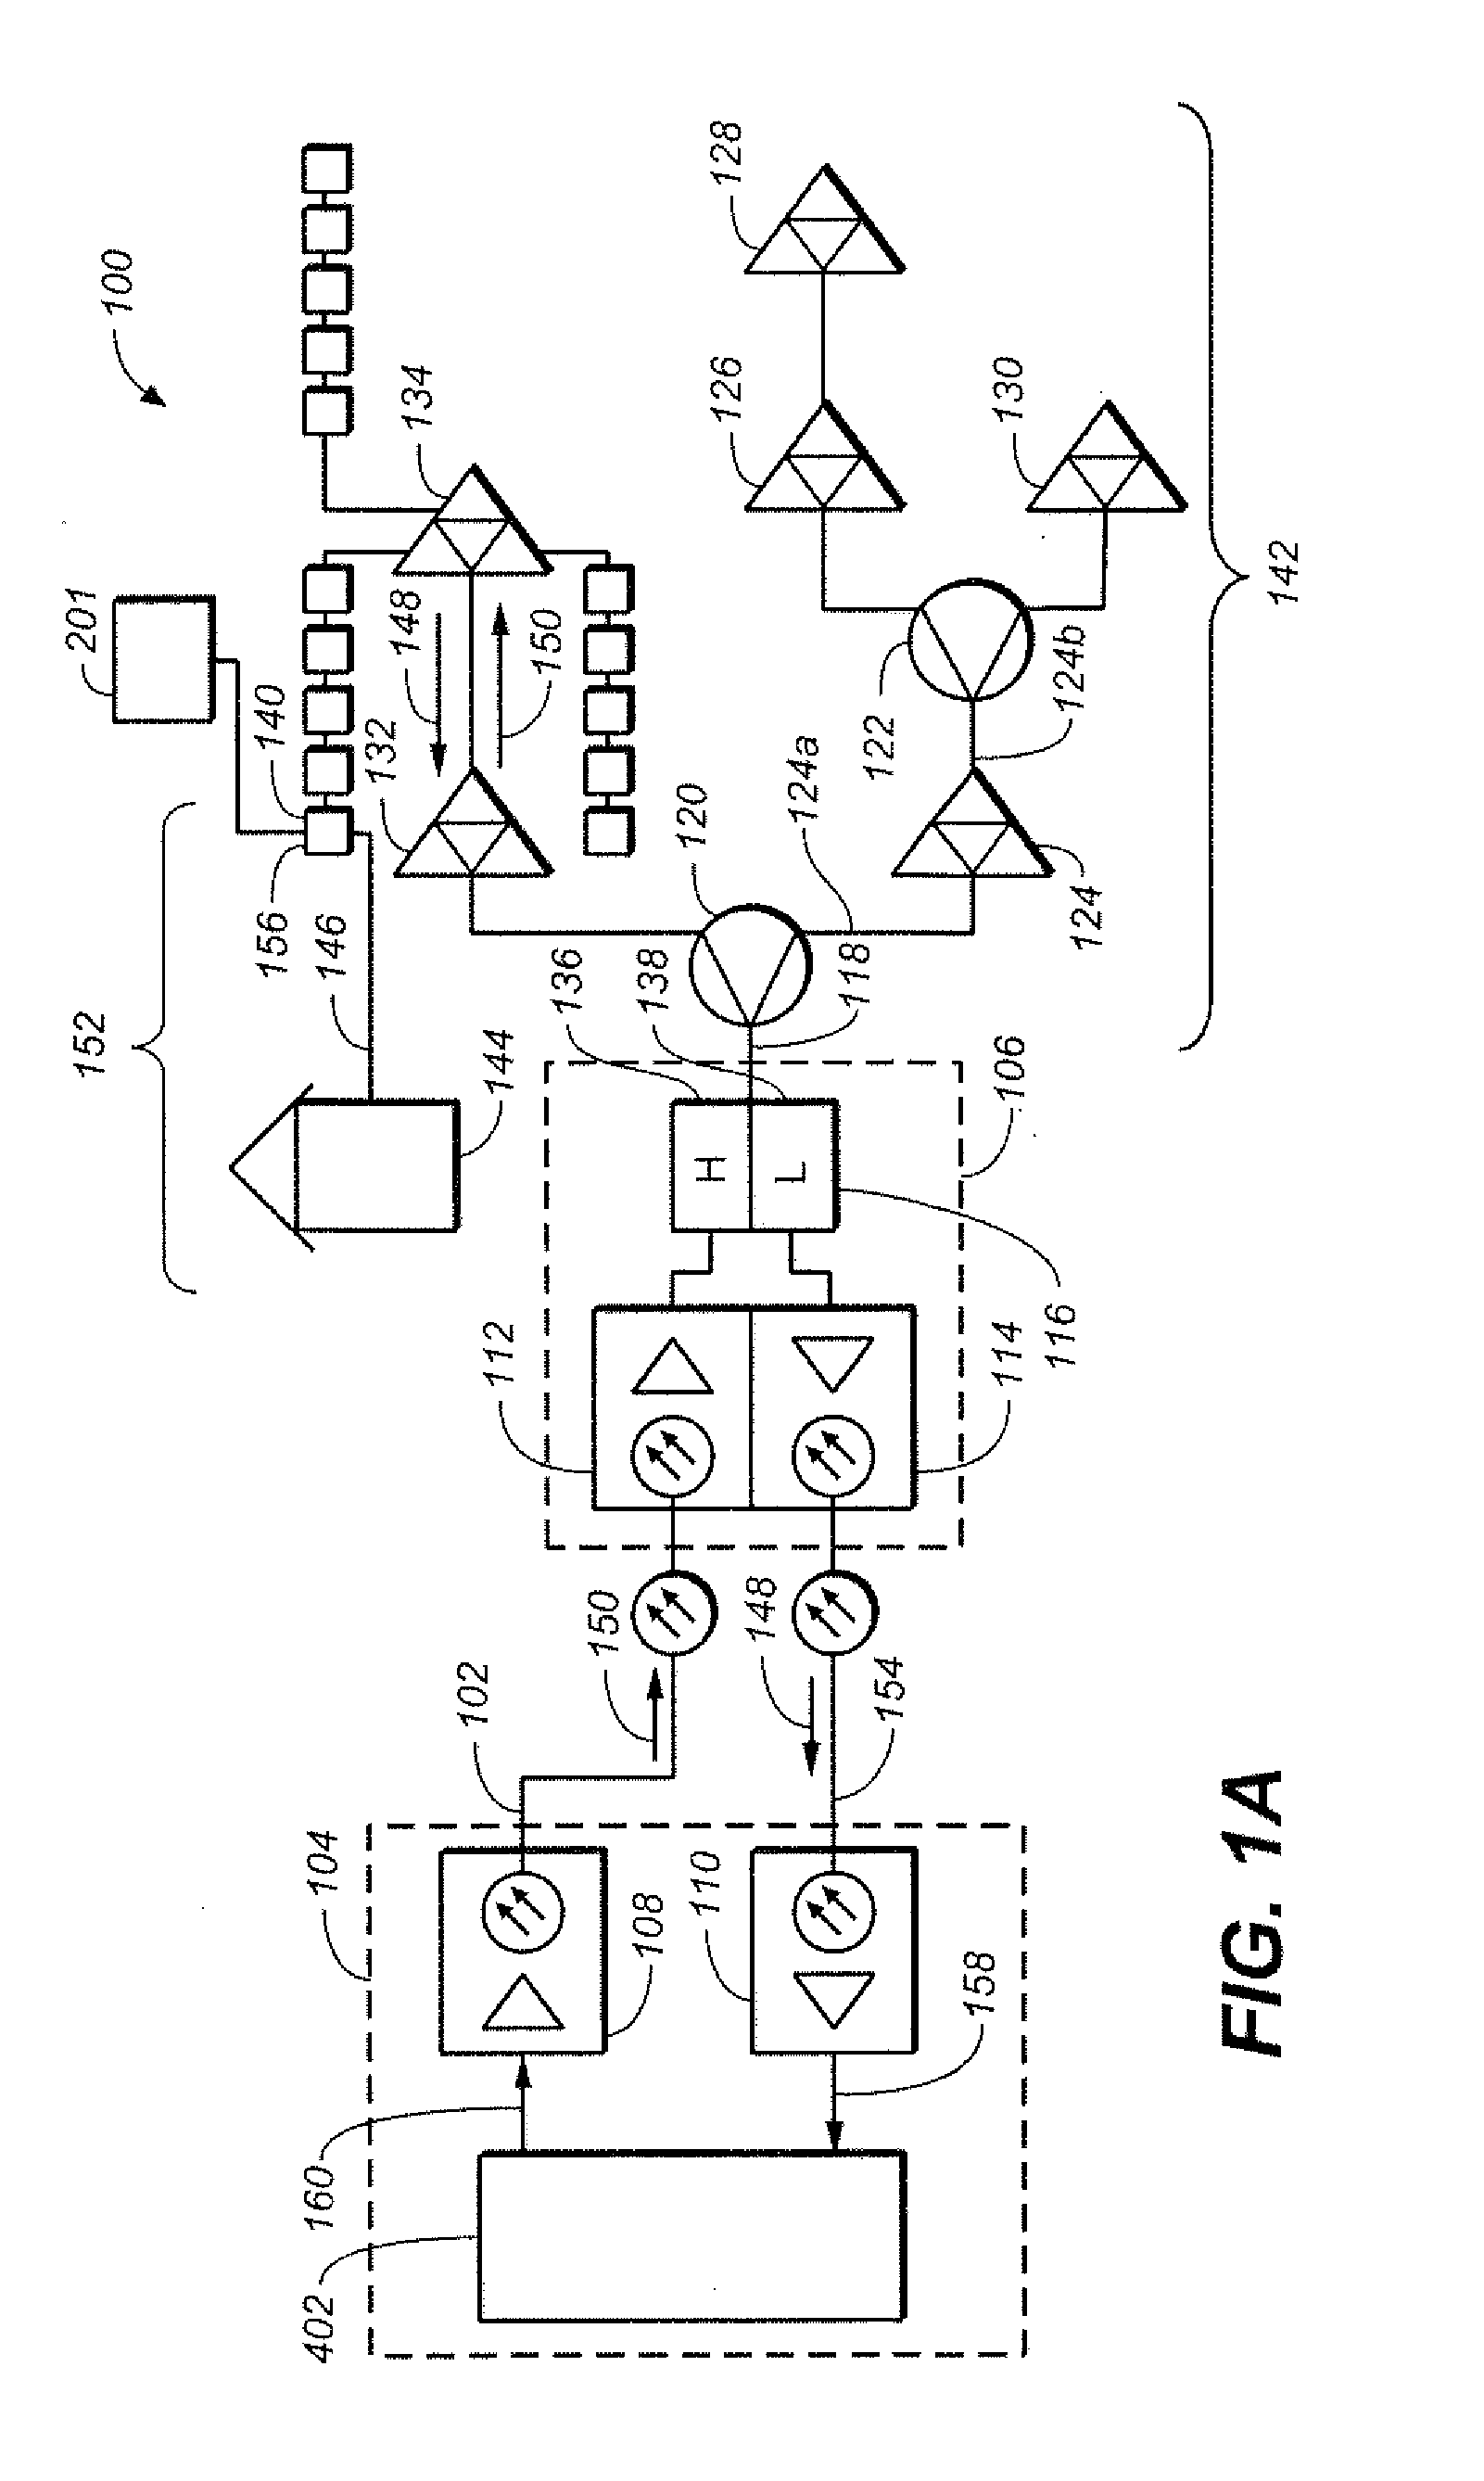
[0028]In cable systems, two-way hybrid fiber coax (HFC) cable systems typically provide two-way communications for end users (typically homes or businesses) using both coaxial cable and fiber optic cable. A headend is a collection point for downstream signals and a termination point for upstream signals. “Downstream” or “forward” means signals traveling away from the headend and “upstream” or “reverse” means signals traveling toward the headend. The coaxial portion of cable networks uses a tree-and-branch architecture to split downstream signals and combine upstream signals. On the coaxial portion of the cable plant, downstream signals are sent from a headend to an end user in a downstream frequency band, which may be 54 to 860 MHz. The composite downstream signal is typically comprised of analog television signals in the lower frequencies, such as 54 to 550 MHz, and digital television signals and cable modem traffic in the upper frequency band, such as 550 to 860 MHz. Upstream sign...


PUM


Abstract

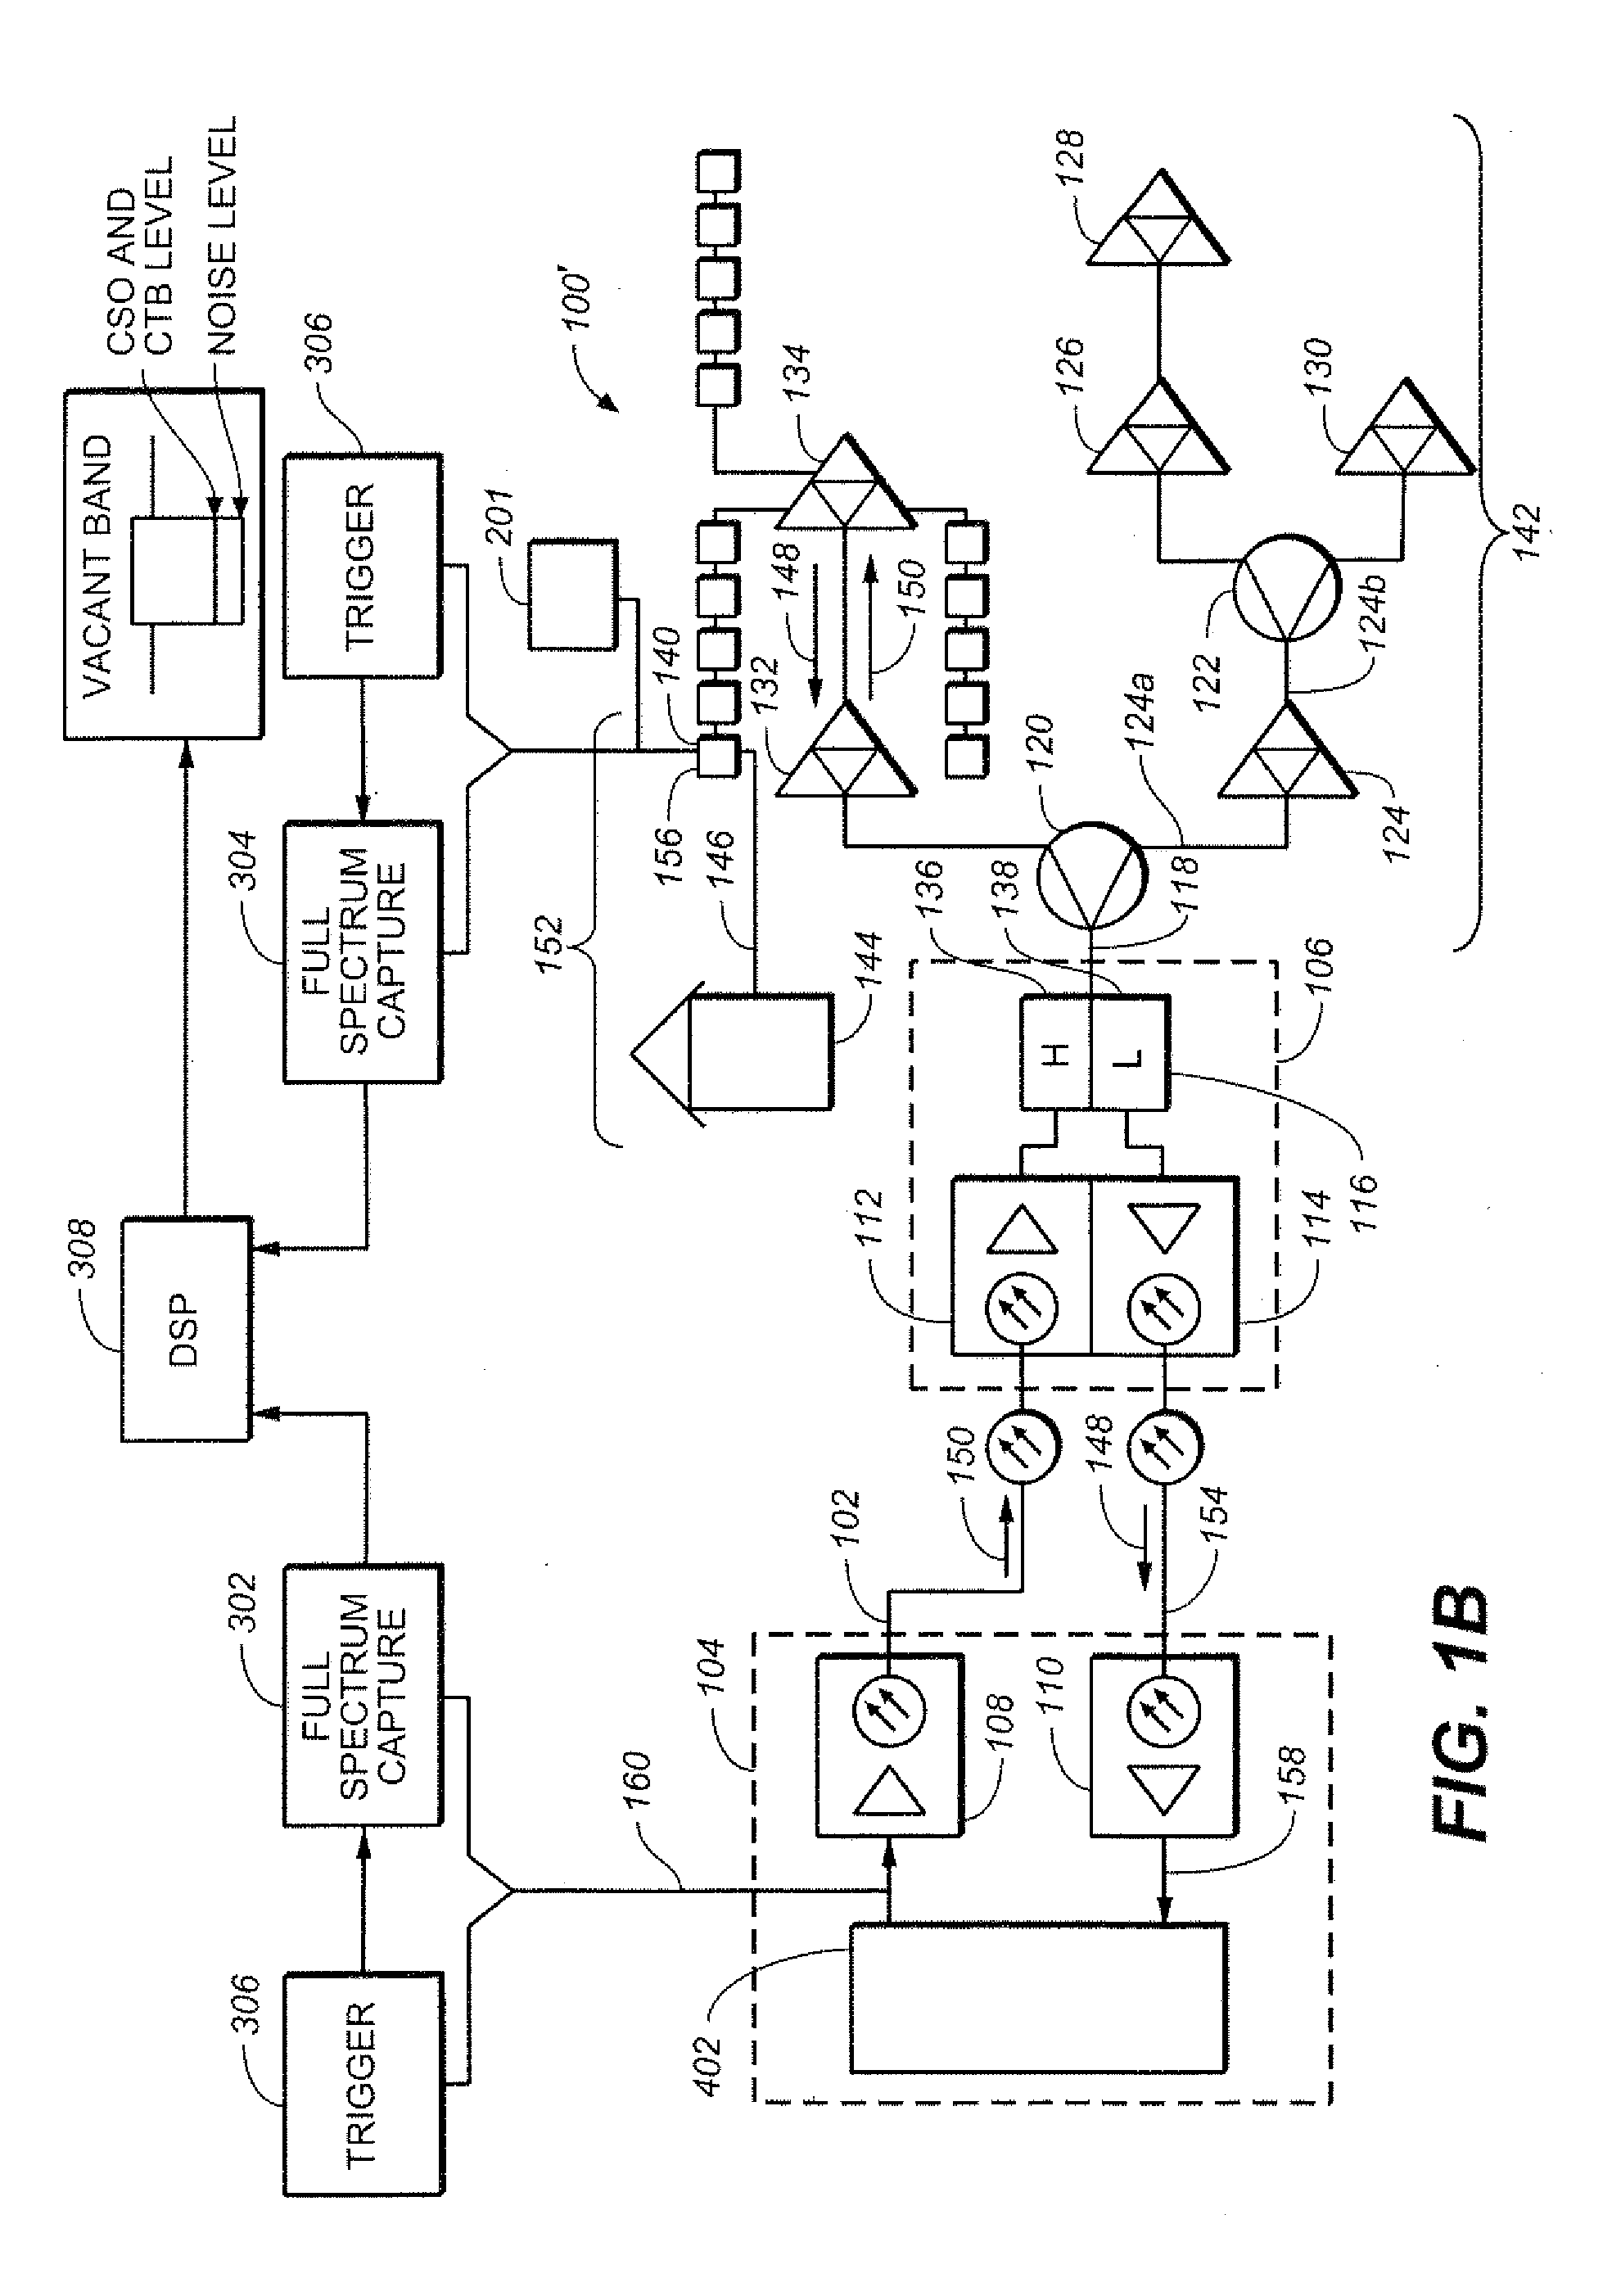
A method to capture random data signals at an end point in a broadband network and process them via digital signal processing (DSP) techniques to determine both linear distortions and nonlinear distortions. In a distribution network, such as a tree and branch cable network, the location of the impairment addition can be identified by determining location of terminals have a distortion and locations of terminals that do not have a distortion. Linear distortions may be determined by an autocorrelation of the captured signal with itself. Nonlinear distortions may be determined by processing measured energy in a vacant band with manufactured energy in the vacant band. If a vacant band is not available, one can be created by demodulating a signal occupying the band, and subtracting the demodulated signal from the measured signal plus interference in a band, leaving only the interference.

Description

BACKGROUND OF THE INVENTION[0001]This invention relates to the detection of linear and nonlinear distortions in equipment, such as those used in in cable and wireless systems, as well as in other applications.[0002]Linear and nonlinear distortions are frequently generated in equipment used in cable systems, and in wireless systems. Thus, nonlinear distortions such as second, third or higher order distortion signals may for example be generated by (overdriven) amplifiers and linear distortions may be caused by multi-path reflections (where reflections accompany the original signal), group delay (where signals at different frequencies travel at different velocities) or amplitude tilt (where signals at different frequencies suffer different attenuations). Excessive distortions affect the image and audio quality experienced by consumers and truck-rolls are typically required in conventional cable and wireless systems to test and identify the source of such distortions and to correct the...

Claims


Application Information

Patent Timeline
Patent Type & Authority Applications(United States)
IPC IPC(8): H04B3/46H04L12/26H04B10/079H04W24/08
CPCH04B3/46H04B10/07953H04L43/08H04W24/08H04B10/6163
Inventor WILLIAMS, THOMAS H.CAMPOS, LUIS ALBERTO
Owner CABLE TELEVISION LAB
Learn More