Visualization of data clusters

a visualization and data technology, applied in the field of information presentation, can solve the problems of more information than the user can process, and and achieve the effect of increasing the difficulty of using a visualization to present data in a useful way

Active Publication Date: 2016-06-23
BUSINESS OBJECTS SOFTWARE
View PDF0 Cites 27 Cited by
  • Summary
  • Abstract
  • Description
  • Claims
  • Application Information

AI Technical Summary

Benefits of technology

[0016]The subject matter described in this specification can be implemented in particular implementations so as to realize one or more of the following advantages. First, data points can be grouped or clustered into logical groups and / or a number of groups that can be easily comprehended and operated on by a user. Second, the user can set preferences as to how the information is to be presented, including a maximum number of groups, sub-groups, and / or resulting data points that are allowed to be displayed at one time.

Problems solved by technology

As the user's data set grows, however, the visualization may present more information than the user can process.
When data sets become larger and larger, and as computer technologies advance, using a visualization to present data in a useful way can become more challenging.

Method used


Image

  • Visualization of data clusters
  • Visualization of data clusters
  • Visualization of data clusters

Examples


Embodiment Construction

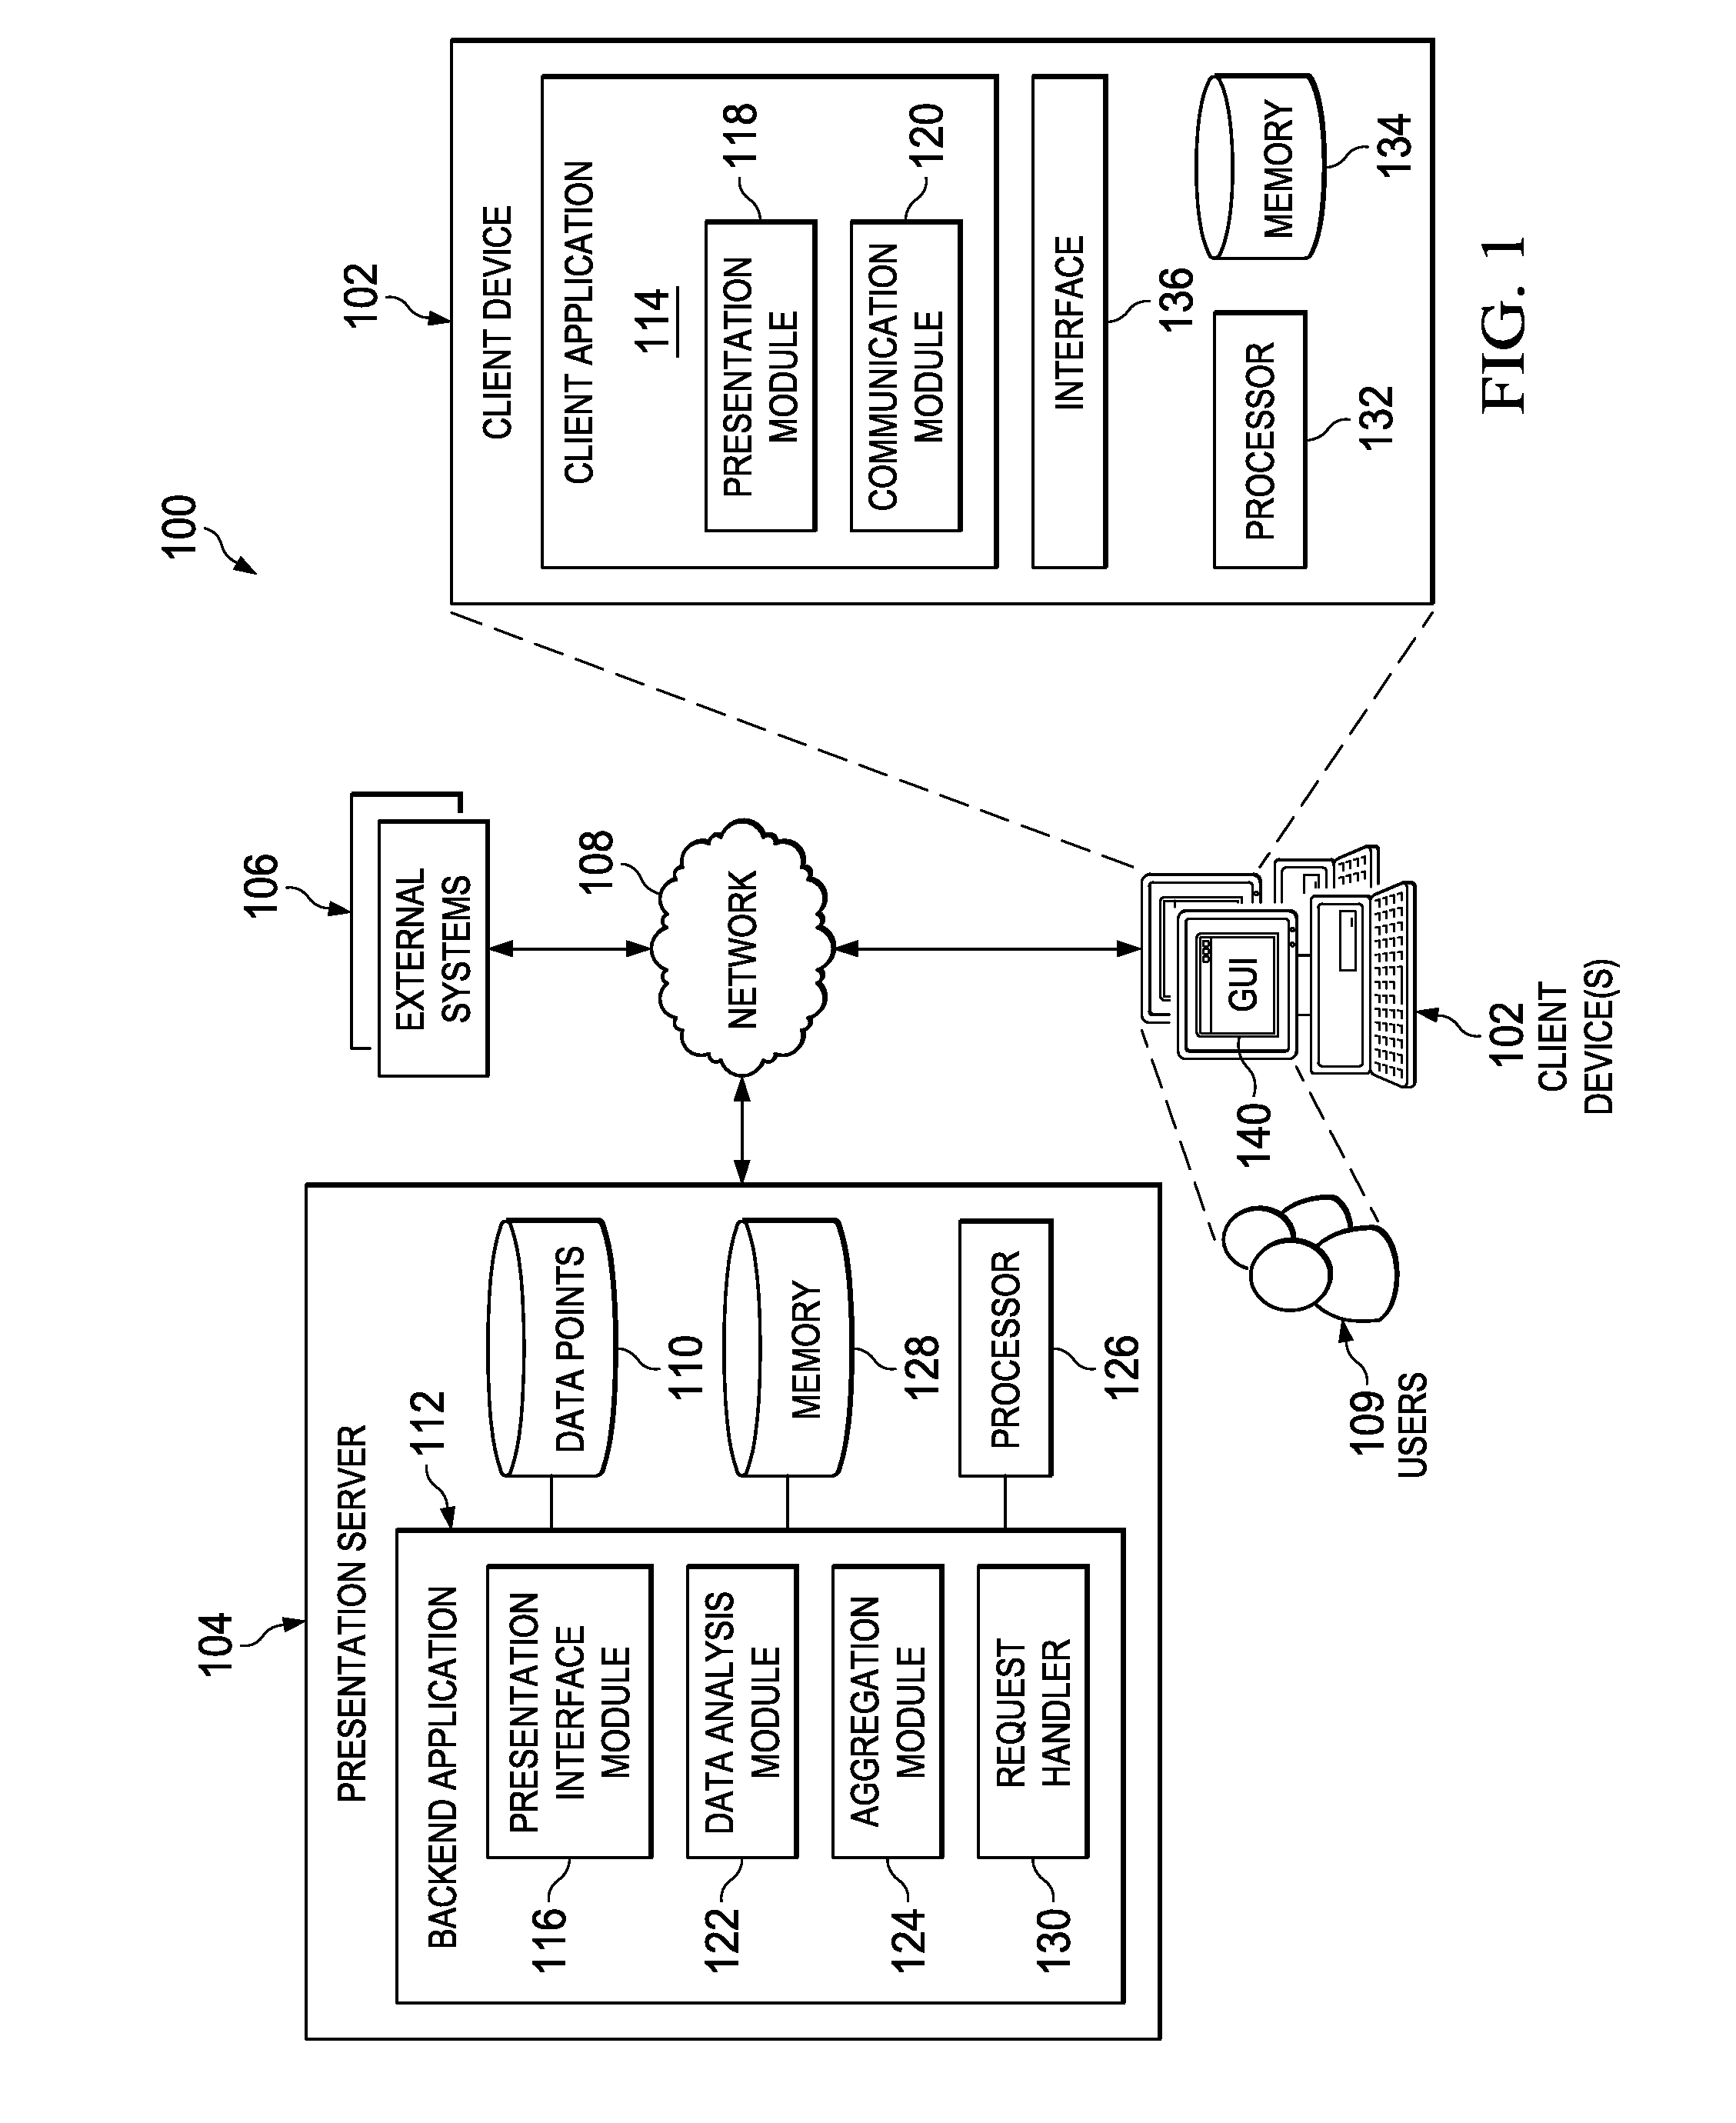
[0025]This disclosure generally describes computer-implemented methods, software, and systems for information presentation. For example, the methods, software, and systems described herein can be used in (or in association with) reporting software (e.g., including business intelligence (BI) software) that helps users mine data, discover insight, design and format information retrieved from data sources, such as one or more databases. Some reporting / BI software may include, for example, visualization and charting functions that can provide a more visually appealing presentation than textual or tabular layout of the data. As a user's data set becomes bigger and bigger, however, it can become more challenging to use visualization to present data in a meaningful and / or digestible way. For example, having significantly many data entries can be a challenge in presenting a single visualization, as displaying large numbers of data points may not provide intelligent information to the user. ...


PUM


Abstract

The disclosure generally describes computer-implemented methods, software, and systems, including a method for presenting information. A first graph is presented that represents plural groups, each representing an aggregated set of data points grouped based on a first set of common attributes. User input selecting a particular group is received. The aggregated set of data points is analyzed to determine whether the number of aggregated set of data points exceeds a threshold. In response to determining that the number exceeds the threshold, the aggregated set of data points is re-grouped. A second set of common attributes associated with the re-grouped set of data points is identified. The data points are aggregated based on the second set of common attributes. A second graph is provided for presentation, the updated graph representing plural groups, each group representing an aggregated subset of data points from the aggregated set of data points.

Description

BACKGROUND[0001]The present disclosure relates to information presentation.[0002]Some reporting applications includes graphing, charting and / or other functions and tools that can be used to present data to a user in a more visually appealing way. For example, visualizations can be used instead of, or in addition to, a presentation of the data in a textual or tabular layout. As the user's data set grows, however, the visualization may present more information than the user can process. When data sets become larger and larger, and as computer technologies advance, using a visualization to present data in a useful way can become more challenging.SUMMARY[0003]The disclosure generally describes computer-implemented methods, software, and systems for information presentation. For example, a first graph is presented for presentation. The first graph represents a plurality of groups, each group representing an aggregated set of data points grouped based on a first set of common attributes. ...

Claims


Application Information

Patent Timeline
Patent Type & Authority Applications(United States)
IPC IPC(8): G06T11/20
CPCG06T11/206G06F3/0482G06F16/26G06F16/285G06F16/9024G06T11/20G06T2200/24G06T2207/20092
Inventor DENG, CHANG
Owner BUSINESS OBJECTS SOFTWARE
Why Eureka
Try Eureka