
Informatics radiomics integration system (IRIS): a novel combined informatics and radiomics method for integration of many types of data for classification into different groups for improved visualization

a radiomics and integration system technology, applied in the field of medical imaging, can solve the problems of not having a data integration system and simplifying visualization, and the difficulty of the average observer to integrate all of the different data sources without additional assistan

Active Publication Date: 2017-04-27
THE JOHN HOPKINS UNIV SCHOOL OF MEDICINE
View PDF3 Cites 0 Cited by
  • Summary
  • Abstract
  • Description
  • Claims
  • Application Information

AI Technical Summary

Benefits of technology

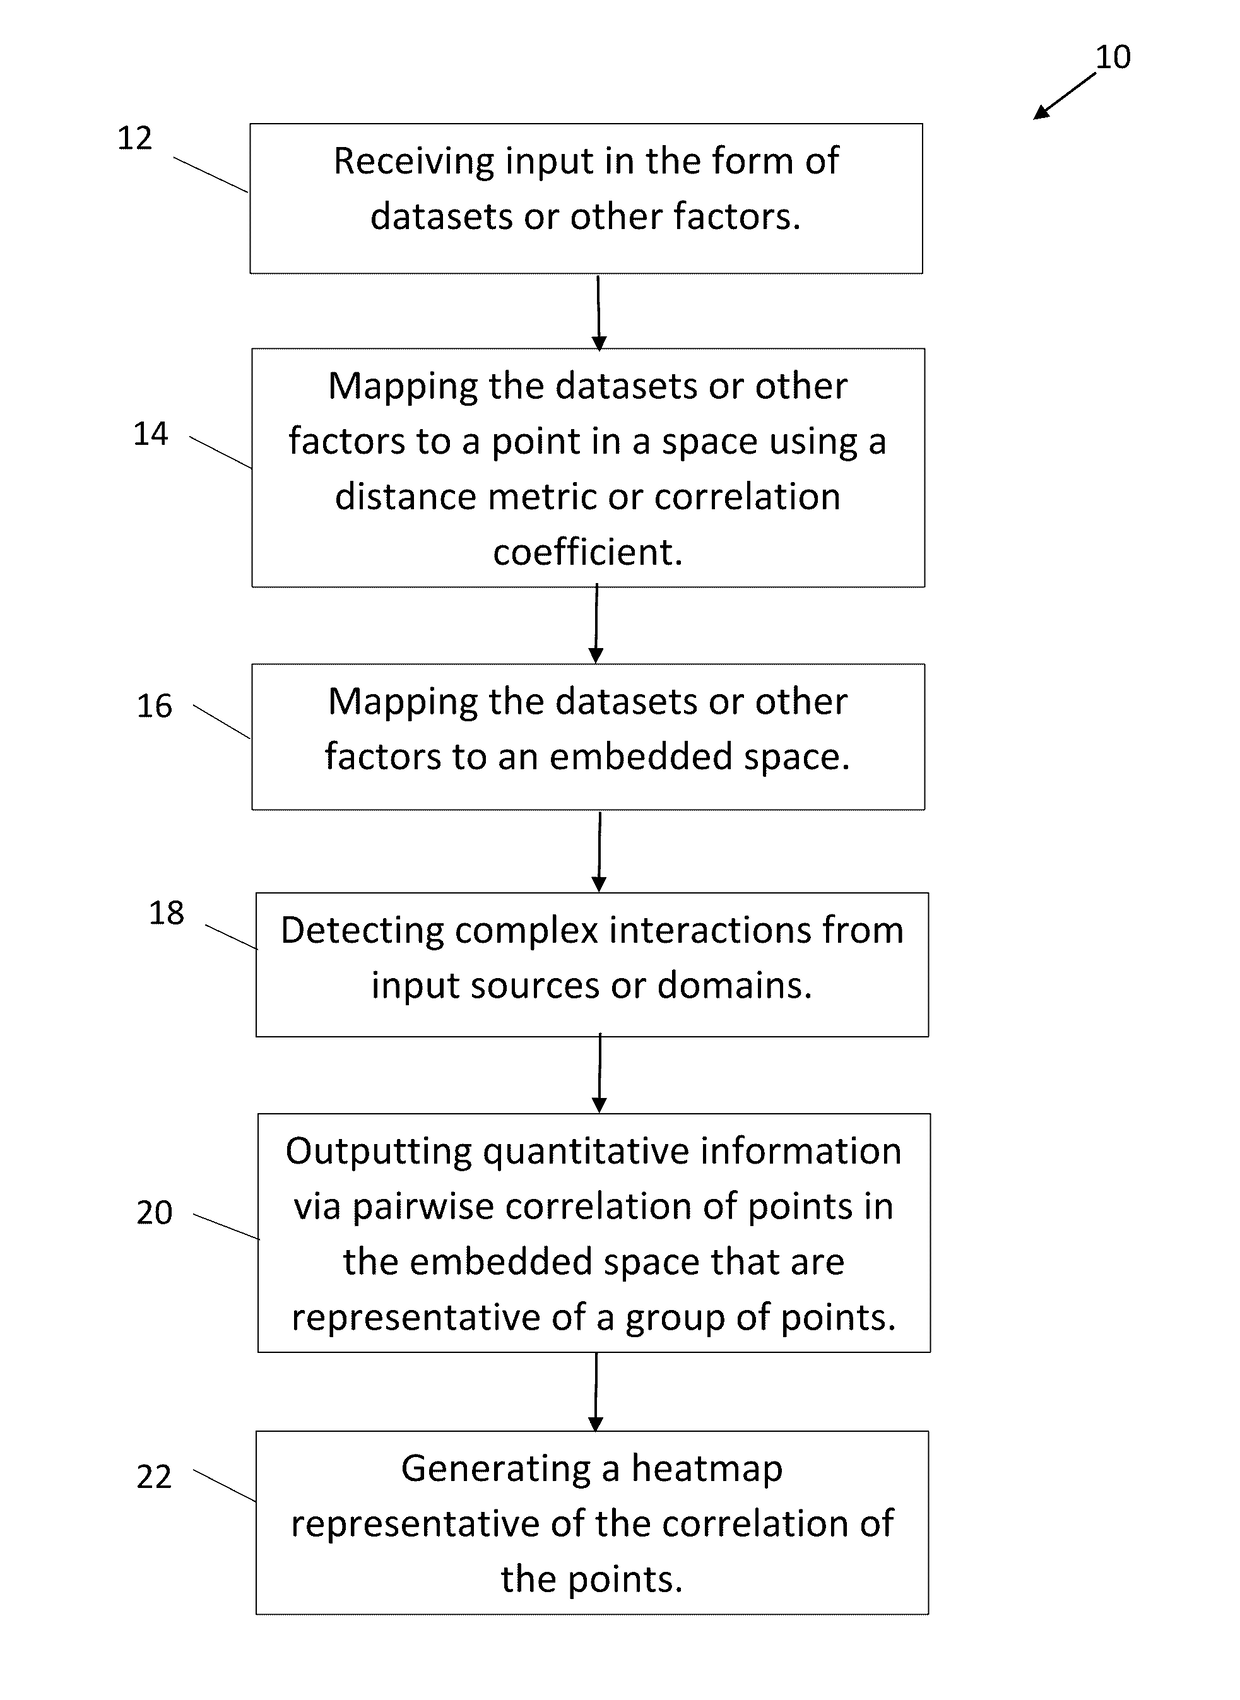
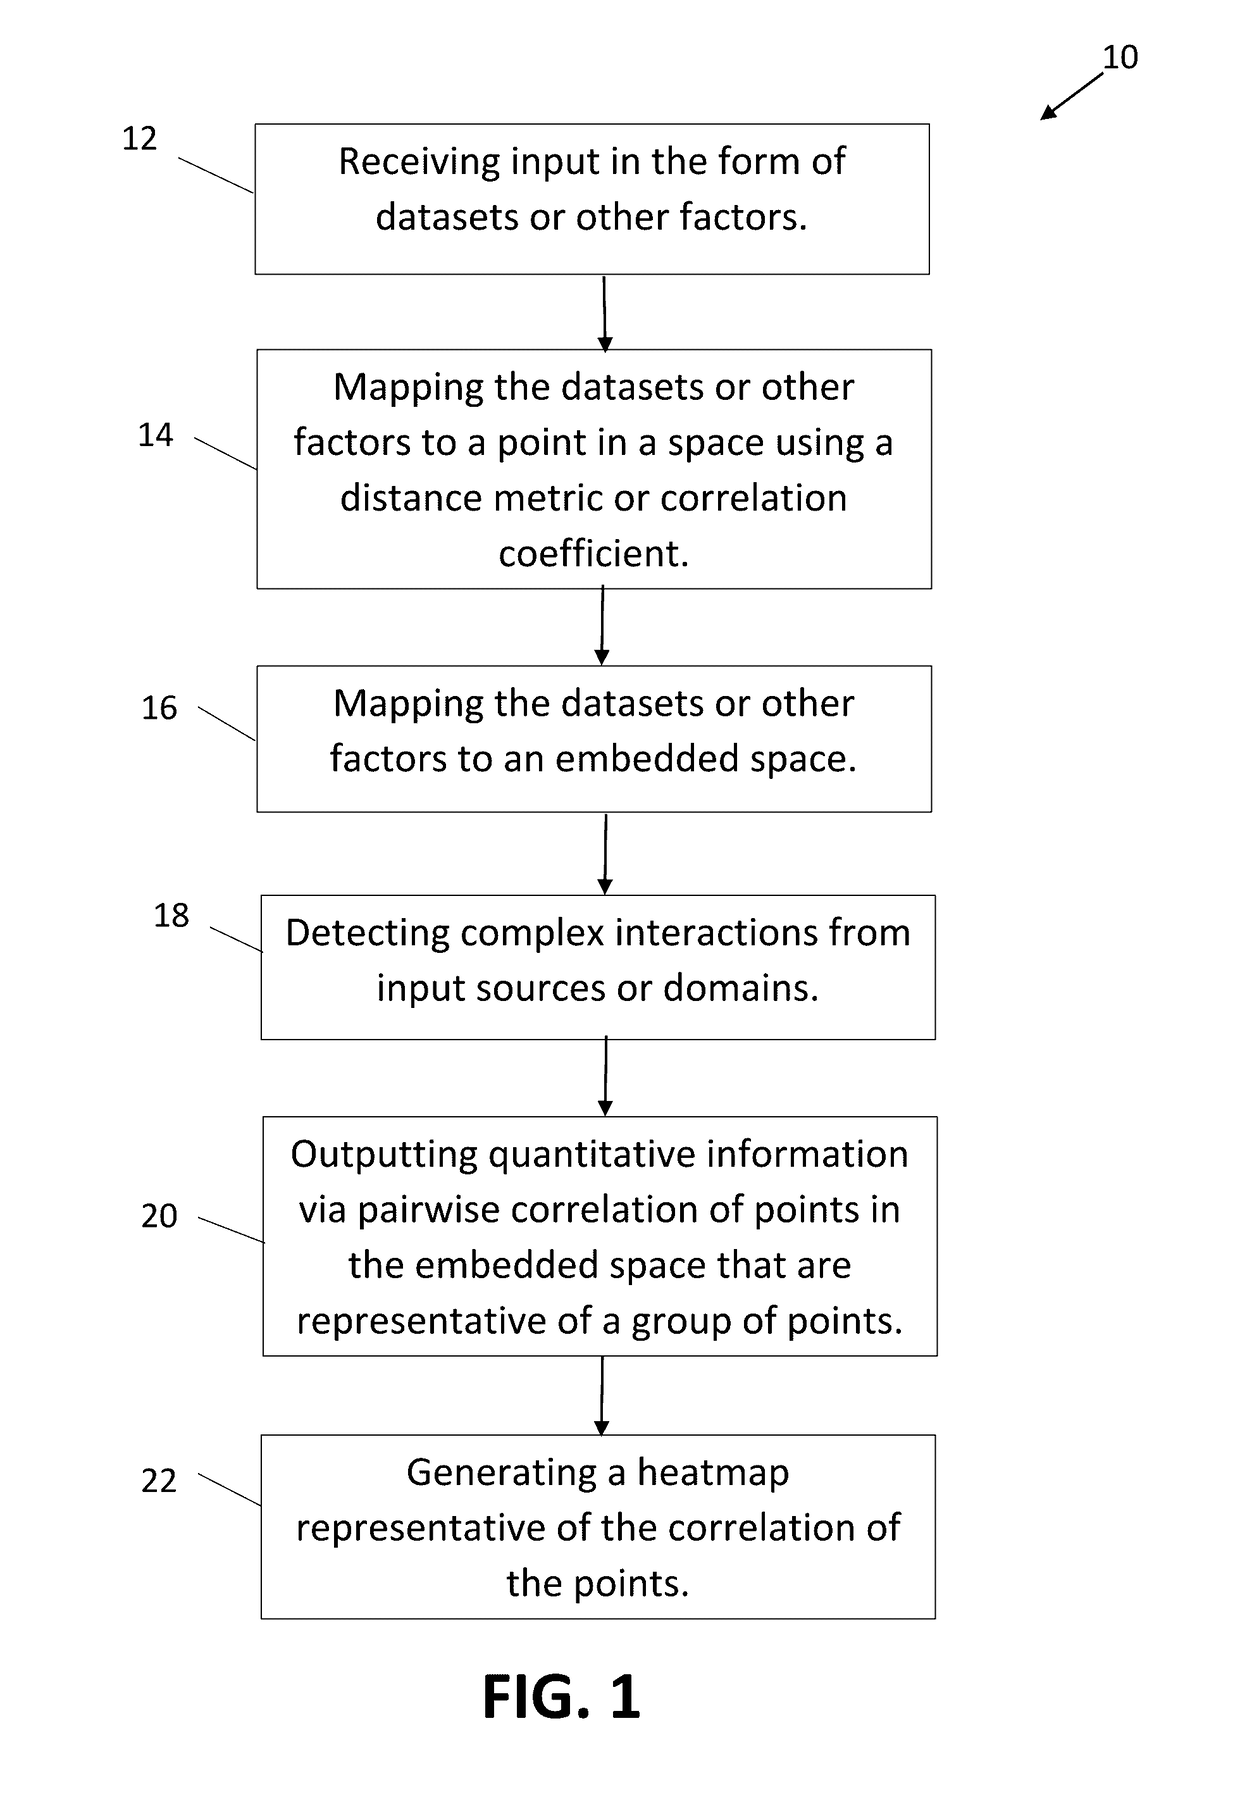
The present invention provides a method and system for integrating datasets and other factors using a distance metric or correlation coefficient to map them to a point in a space and detect complex interactions. The system can output quantitative information via pairwise correlation of points in an embedded space and generate a heatmap representative of the correlation of the points. This method and system can be used for making medical decisions and assessing cancer, among others. The space can take the form of a two-dimensional or three-dimensional space, and the system can include a computing device and a non-transitory computer readable medium. The technical effects of this invention include improved data integration and analysis for various applications.

Problems solved by technology

When viewing data from various sources, it can be difficult for the average observer to integrate all of the different data sources without additional assistance.
In addition, the data sets include information that is not readily visible to the human observer.
Currently, no such system of data integration and simplified visualization exists.

Method used


Image

  • Informatics radiomics integration system (IRIS): a novel combined informatics and radiomics method for integration of many types of data for classification into different groups for improved visualization
  • Informatics radiomics integration system (IRIS): a novel combined informatics and radiomics method for integration of many types of data for classification into different groups for improved visualization
  • Informatics radiomics integration system (IRIS): a novel combined informatics and radiomics method for integration of many types of data for classification into different groups for improved visualization

Examples


examples

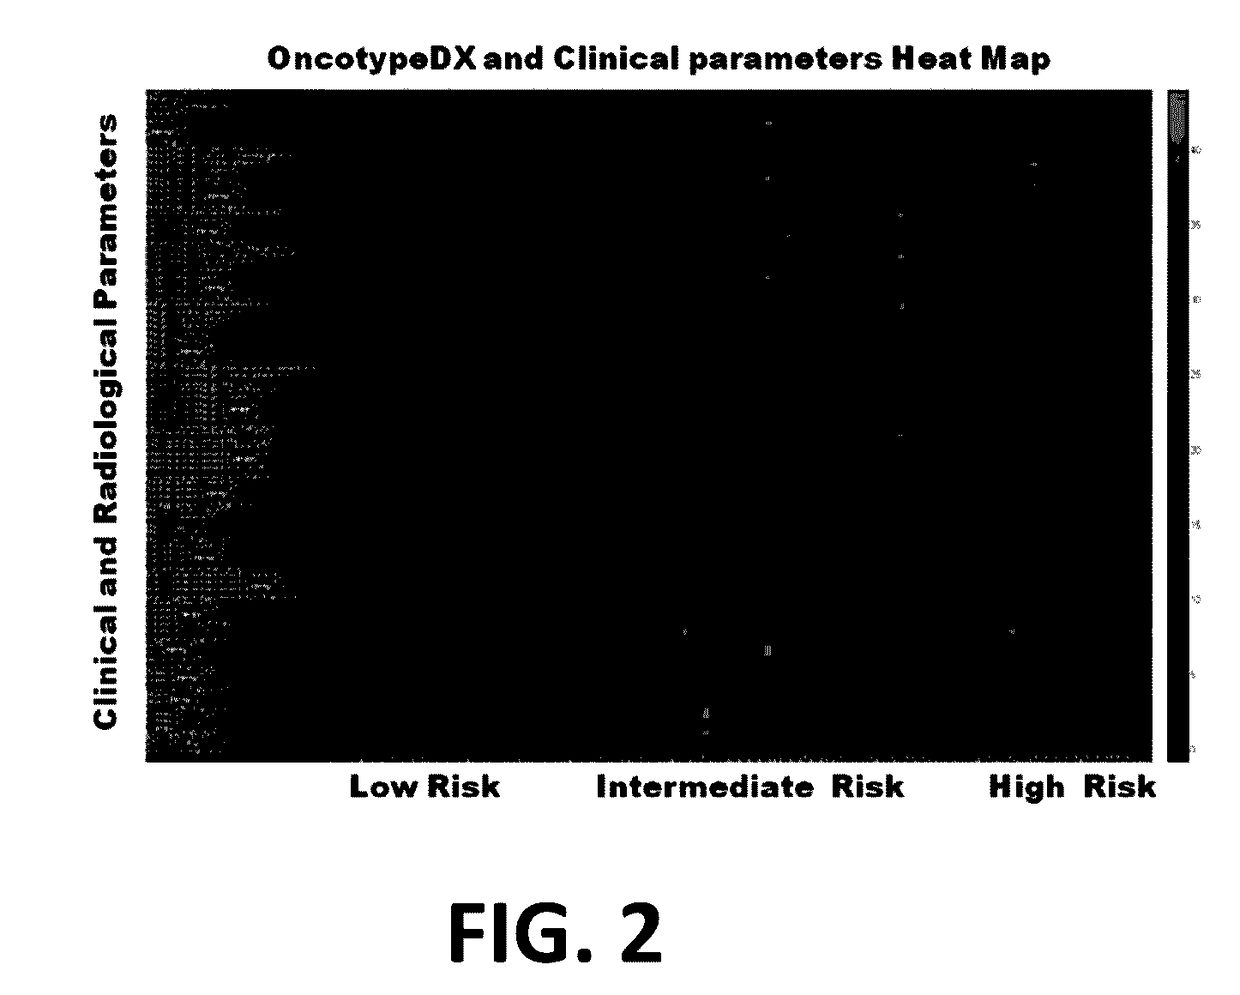
[0024]The following examples are included to further illustrate the invention. These examples are not meant to be considered limiting. In one exemplary radiographic application, emerging data on breast cancer suggest that different breast cancer subtypes (phenotypes) may respond differently to available adjuvant therapies. FIG. 2 illustrates a graphical view of a heat map showing correlation between clinical and radiological parameters and risk. The informatics heat map demonstrates the stratification of the radiological parameters correlated with the OncotypeDX score. There is a growing understanding that not all patients benefit equally from systemic therapies, and therapeutic approaches are being increasingly personalized based on predictive biomarkers of clinical benefit. Optimal use of established and novel imaging methods, such as magnetic resonance imaging (MRI) and positron emission tomography (PET), can simultaneously identify key functional parameters and provide unique mu...


PUM


Abstract

An embodiment in accordance with the present invention includes a novel informatics method for the integration of different variables or ontologies using an advanced unsupervised machine learning method which will be used to visualize factors not visible to the human observer. These factors can be unknown characteristics between imaging datasets and other factors which will provide insights into the structure of the data. This invention is called the Informatics Radiomics Integration System (IRIS), For example, using clinical data and radiological images, the present invention can determine the relationship between, the structure, clinical variables, histological variables and “distance or relationship” between each input parameter. This integration of information can be used to determine the association between the variables and the relationship to each other for improved diagnosis or for treatment response.

Description

CROSS REFERENCE TO RELATED APPLICATION[0001]This application claims the benefit of U.S. Provisional Patent Application No. 62 / 246,230 filed on Oct. 26, 2015, which is incorporated by reference, herein, in its entirety.FIELD OF THE INVENTION[0002]The present invention relates generally to medical imaging. More particularly, the present invention relates to a method for integration of many types of data for classification into different groups for improved visualization.BACKGROUND OF THE INVENTION[0003]When viewing data from various sources, it can be difficult for the average observer to integrate all of the different data sources without additional assistance. In addition, the data sets include information that is not readily visible to the human observer. Visualization of the integrated data must also be provided in a way that is easily understood by the observer. In this way the integrated data can be conveyed to the observer in a limited number of visualizations. Currently, no su...

Claims


Application Information

Patent Timeline
Patent Type & Authority Applications(United States)
IPC IPC(8): A61B6/00G06F19/00G06F17/30A61B5/055A61B6/03
CPCA61B6/5217A61B5/055G06F3/0481G06F17/3028G06F19/321A61B6/037G06T7/0012G06T2207/10088G06T2207/10104G06T2207/30068G06T2207/30096G16H30/20G06V10/7625G06V10/7715G06V10/945G06F18/231G06F18/40G06F18/2137
Inventor JACOBS, MICHAEL A.PAREKH, VISHWA S.
Owner THE JOHN HOPKINS UNIV SCHOOL OF MEDICINE
Learn More