N-tiered eurt breakdown graph for problem domain isolation

a problem domain and breakdown graph technology, applied in the field of data visualization of network monitoring data, can solve problems such as application performance problems

Active Publication Date: 2017-08-31
NETSCOUT SYSTEMS
View PDF1 Cites 88 Cited by
  • Summary
  • Abstract
  • Description
  • Claims
  • Application Information

AI Technical Summary

Benefits of technology

[0009]To achieve these and other advantages and in accordance with the purpose of the illustrated embodiments, in one aspect, a method for visual representation of end user response time in a multi-tiered network application is described in which an illustrated embodiment includes receiving, search criteria for searching a repository of client statistics records. The search criteria specifies identification information pertaining to a user of a multi-tiered network application experiencing one or more performance problems and a time period associated with the one or more performance problems. The identification information identifies an IP address of user's computing device. A plurality of client statistics records matching the search criteria is retrieved from the repository. The retrieved plurality of client statistics records is sorted based on measurements of performance parameters. A graph representing relevant topology hierarchy of the multi-tiered network application, with respect to the performance problems, is presented to a user based on the sorted client statistics records. The graph visually identifies one or more connections between nodes of the multi-tiered application. The identified connections include potential root-causes of the specified application performance problems.
[0010]In another aspect, a computer program product for visual representation of end user response time in a multi-tiered network application is provided. The computer

Problems solved by technology

The identified connections include potential root-causes of the specified application performance prob

Method used


Image

  • N-tiered eurt breakdown graph for problem domain isolation
  • N-tiered eurt breakdown graph for problem domain isolation
  • N-tiered eurt breakdown graph for problem domain isolation

Examples


Embodiment Construction

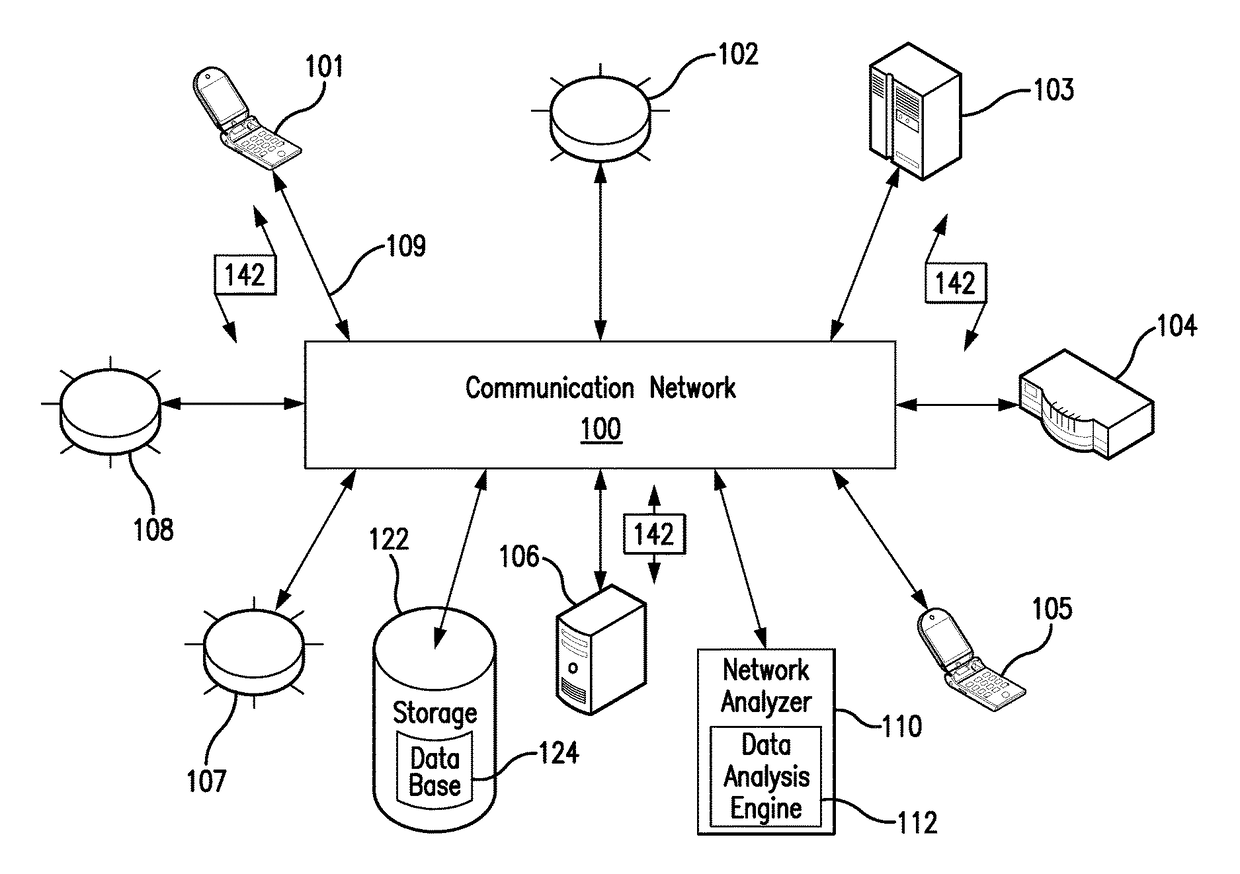
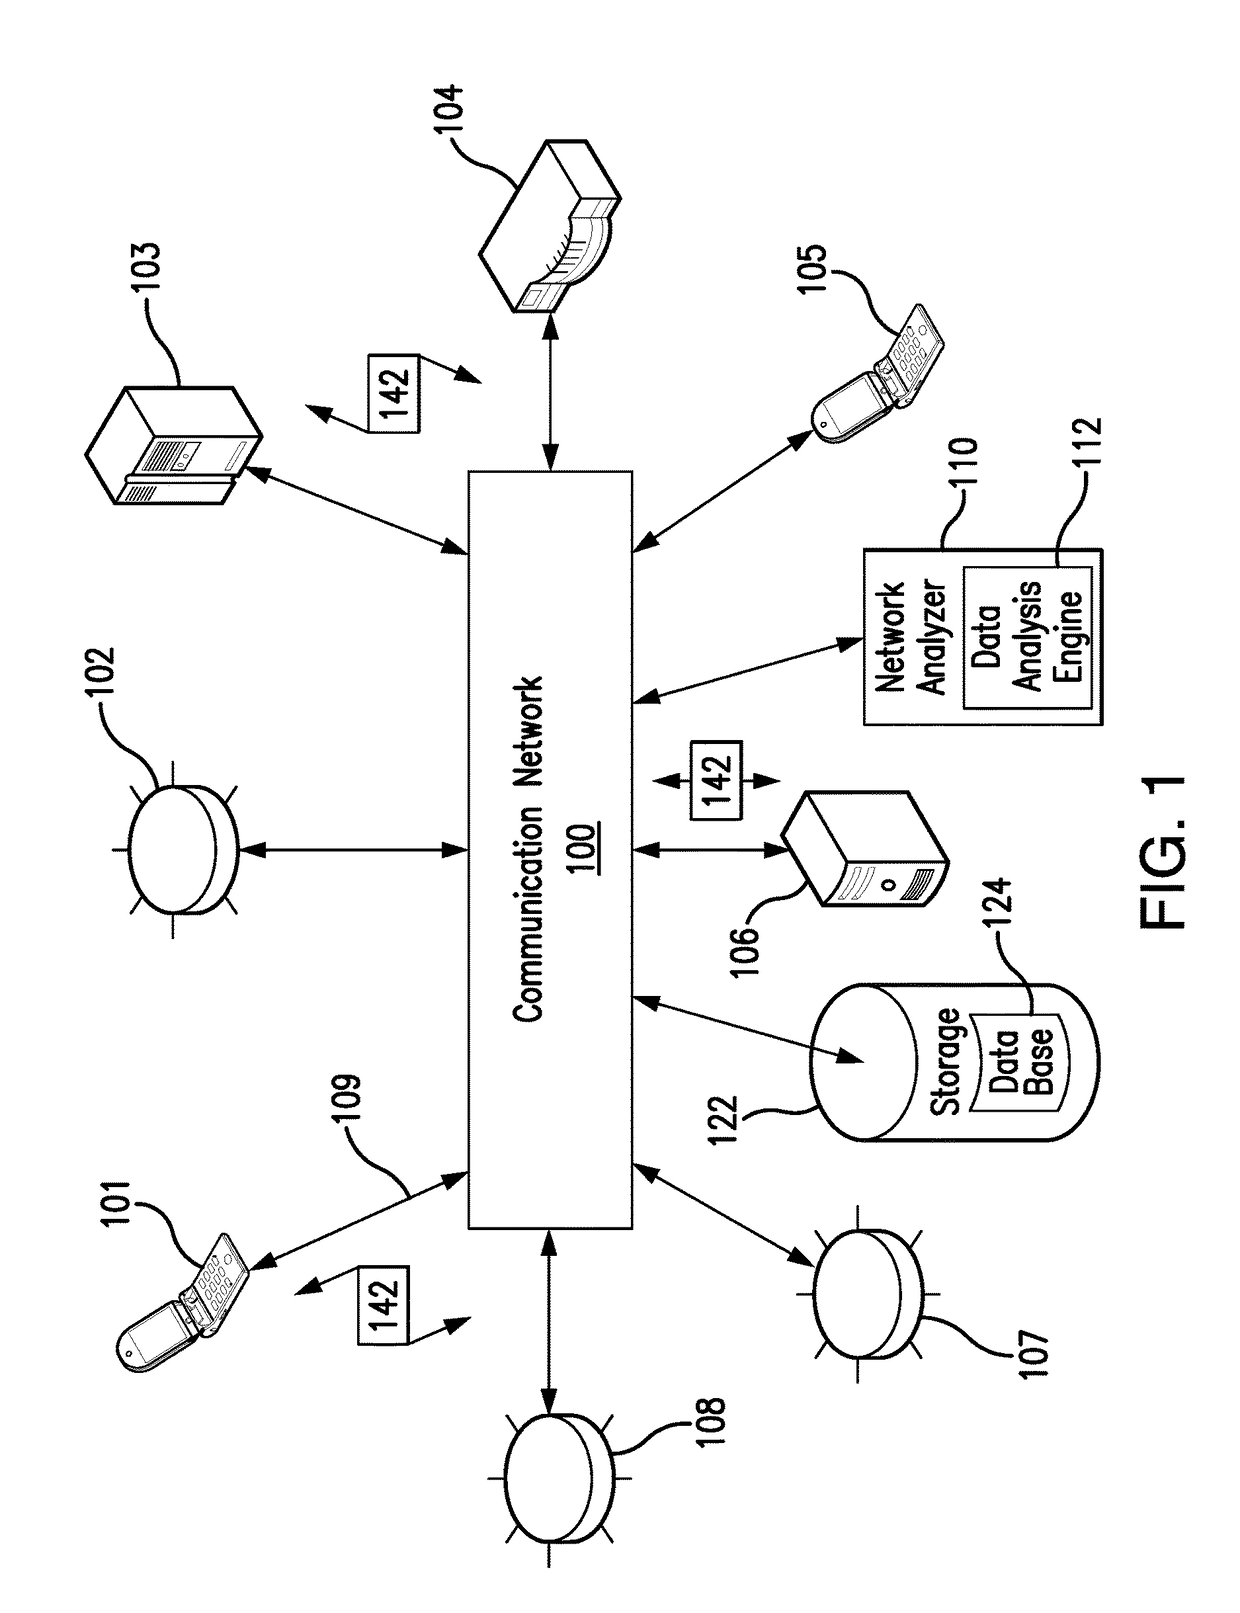
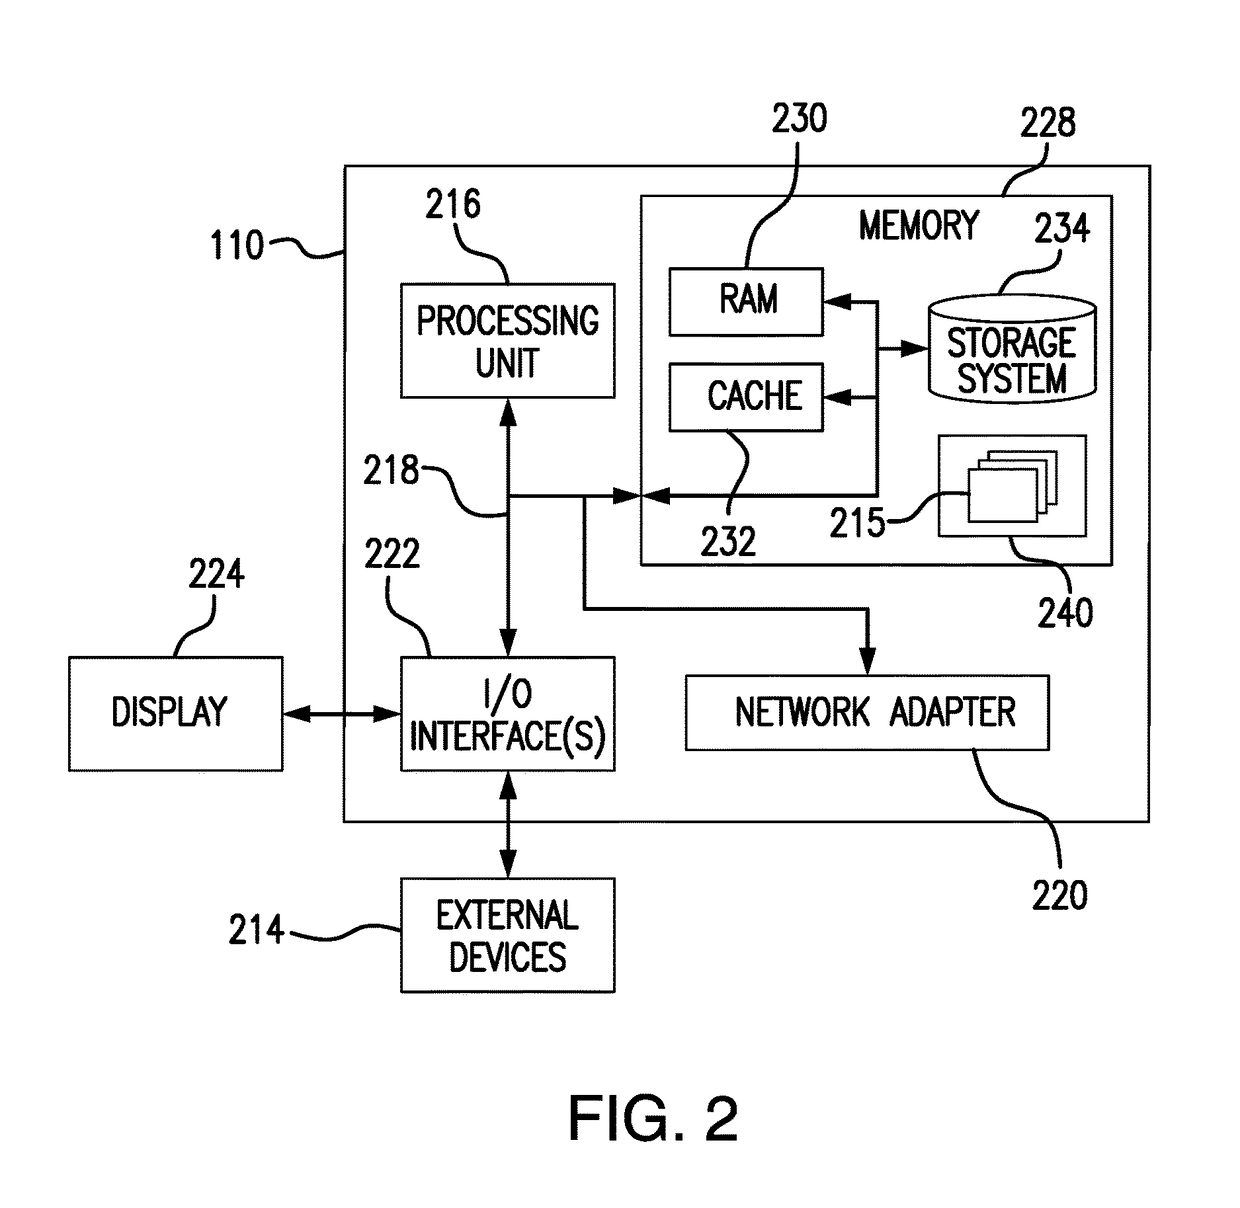
[0016]The present invention is now described more fully with reference to the accompanying drawings, in which illustrated embodiments of the present invention is shown wherein like reference numerals identify like elements. The present invention is not limited in any way to the illustrated embodiments as the illustrated embodiments described below are merely exemplary of the invention, which can be embodied in various forms, as appreciated by one skilled in the art. Therefore, it is to be understood that any structural and functional details disclosed herein are not to be interpreted as limiting, but merely as a basis for the claims and as a representative for teaching one skilled in the art to variously employ the present invention. Furthermore, the terms and phrases used herein are not intended to be limiting but rather to provide an understandable description of the invention.

[0017]Unless defined otherwise, all technical and scientific terms used herein have the same meaning as c...


PUM


Abstract

A method for visual representation of end user response time (EURT) in a multi-tiered network application is provided. Search criteria for searching a repository of client statistics records is received. The search criteria specifies identification information pertaining to a user of a multi-tiered network application experiencing application performance problems and a time period associated with the application performance problems. The identification information identifies an IP address of user's computing device. A plurality of client statistics records matching the search criteria is retrieved from the repository. The retrieved plurality of client statistics records is sorted based on measurements of performance parameters. A graph representing relevant topology hierarchy of the multi-tiered network application is presented to a user based on the sorted client statistics records. The graph visually identifies connections between nodes of the multi-tiered application. The identified connections include potential root-causes of the specified application performance problems.

Description

FIELD OF THE INVENTION[0001]This specification is in general, to data visualization of network monitoring data, and, more particularly, to a method for rendering a N-Tiered EURT (End User Response Time) breakdown graph for problem domain isolation.BACKGROUND OF THE INVENTION[0002]Modern applications are characterized by multiple components deployed across multiple network tiers accessed by users across a network. Examples of applications include enterprise applications, such as Enterprise Resource Planning (ERP), Customer Relationship Management (CRM), Supply Chain Management (SCM), and Online Banking, Brokerage, Insurance and Retailing applications. An application typically provides a variety of business functions that users may execute. For example, an online stock trading application may provide some of the following business functions: log in, display account status, retrieve stock prospectus, sell stock, buy stock and log out.[0003]When a user executes such a business function,...

Claims


Application Information

Patent Timeline
IPC IPC(8): H04L12/26H04L12/24
CPCH04L43/045H04L41/0631H04L41/142H04L41/5067H04L43/0852H04L41/22
Inventor AKENS, GEOFFLAVER, BRYAN K.VOGT, ROBERT
Owner NETSCOUT SYSTEMS
Why Eureka
Try Eureka