
Building management system that determines building utilization

a building management system and building technology, applied in relational databases, instruments, database models, etc., can solve problems such as no good ways, continuous challenges, and significant reductions in room utilization

Active Publication Date: 2018-04-26
CRESTRON ELECTRONICS
View PDF0 Cites 34 Cited by
  • Summary
  • Abstract
  • Description
  • Claims
  • Application Information

AI Technical Summary

Benefits of technology

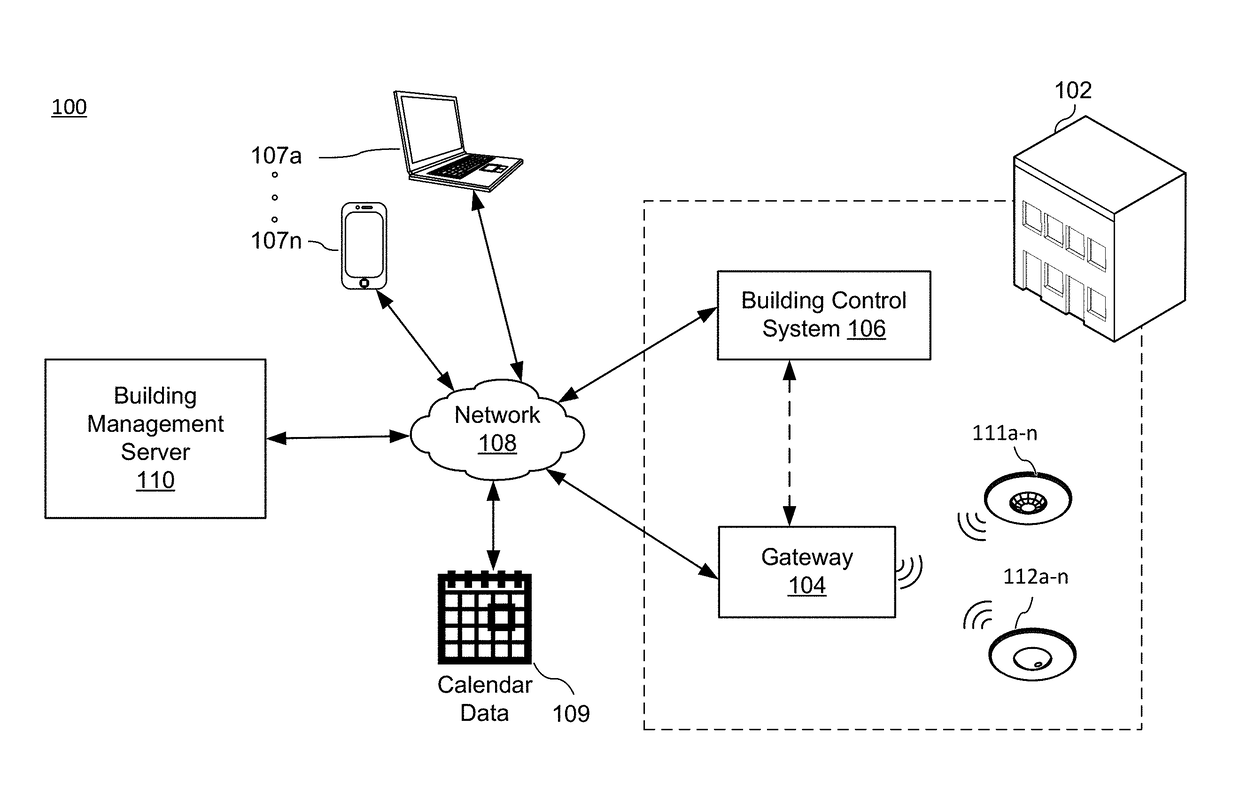
The patent describes a building management system that uses sensors to determine space utilization in a building. The system collects data on occupancy and stores it in a database. The data is then analyzed and displayed in a visualization system, which allows users to see how much space is being used in each room. The system can also identify specific tags for different types of meetings and track changes in occupancy over time. The system can also issue alerts when occupancy rates exceed certain thresholds. Overall, the system provides a better understanding of space utilization in a building and helps optimize space utilization.

Problems solved by technology

Yet, it is a continuous challenge as there are currently no good ways to identify if a workspace, such as a meeting space, is being used effectively.
But these indications may be misleading as, for example, rooms may be overbooked while actual room utilization may be significantly lower.
This method requires multiple people to dedicate multiple days to surveying rooms and can still be wildly inaccurate.
However, these services are only temporary studies that do not provide a holistic view and do not take into account equipment usage.
They also only provide their results in a report at the end of the study and do not provide live monitoring.

Method used


Image

  • Building management system that determines building utilization
  • Building management system that determines building utilization
  • Building management system that determines building utilization

Examples


case 1

[0275] Employee Complaints:

[0276]Tim is a facilities manager for a single building at a mid-sized corporation with multiple locations. He has received numerous complaints that there are no rooms available for meetings in building 102. He opens up the frontend page 1400, selects “Building 102” under the “Overview” drop down menu 1421, and observes that total utilization in building 102 is less than 50% and falls right within his target guidelines—but that there is a very wide spread between his most occupied and least occupied rooms (i.e., as indicated by side arrows 1414 and 1415). He clicks on the “Building” tag 1206 in the break down bar 1424 and selects the line graph 1432 to view the utilization of building 102 over time and sees that total utilization peaks at 10:30 AM and 3:00 PM at approximately 80%, a rate high enough that people are certainly being blocked on some days. He then selects the “Access” tag 1206g in the break down bar 1424 to view the difference in utilization o...

case 2

[0277] Planning a New Office:

[0278]Margaret is a new hire real estate manager for a mid-sized corporation with multiple locations. The company is growing, the lease is up on the current New Jersey office (e.g., building 102), and her first assignment is to plan the new office. The company has standardized on four conference room styles—small presentation, large presentation, small VTC, and large VTC. The old office had these four configurations in equal proportion but Margaret wants to know if that is the best use of resources. She opens the frontend page 1400, selects “Building 102”, and selects the bar graph 1434 under the “Capacity” tag 1206f to view occupancy rate by size. In response, the bar graph 1434 may display three bars indicating the average occupancy rate of small-sized conference rooms, mid-sized conference rooms, and large-sized conference rooms. She observes that small conference rooms have an occupancy rate and are in use 70% of the work day, whereas large conferenc...

case 3

[0279] Long-Term Efficiency Tracking

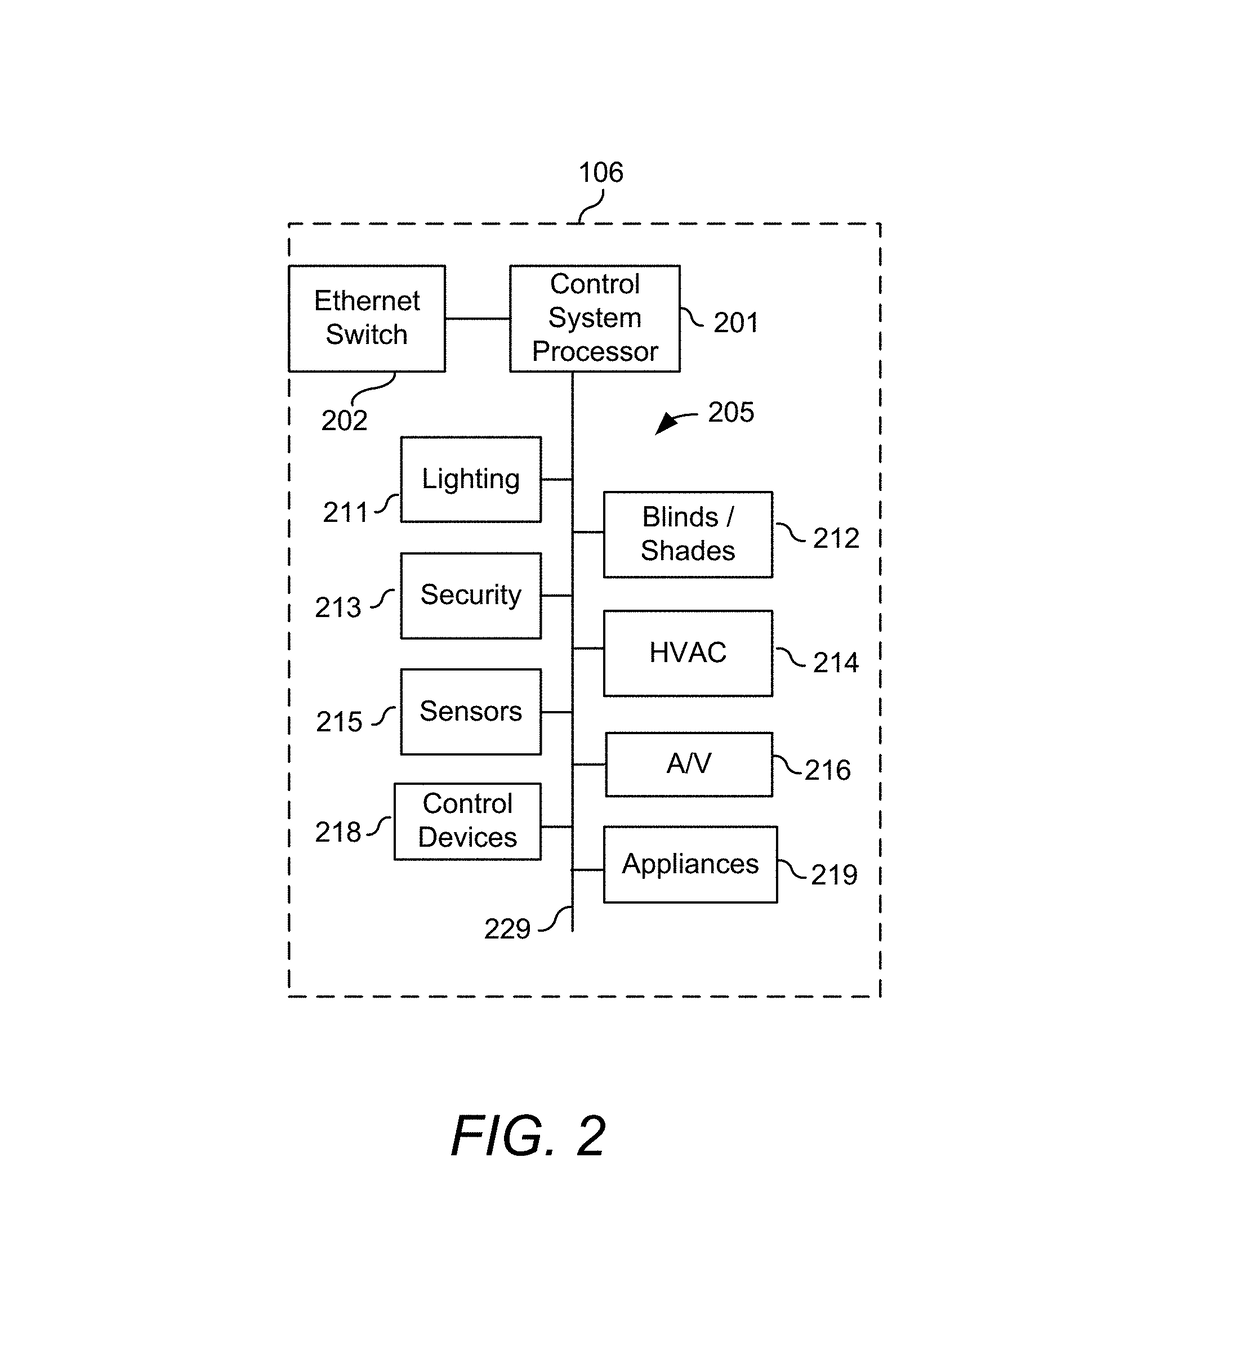
[0280]John is the facility manager for a pharmaceutical company's headquarter (e.g., Building 102). The building has many conference rooms in many configurations—some are VTC, some support audio conferences (“ATC”), some just have screens for presentations. They are also in a variety of capacities. Different teams—marketing, sales, R&D, etc.—are in different sections of the building and have access to different conference rooms, just based on what is nearby. All of the building's rooms are controlled by a building control system 106. John wants to know if the conference rooms are distributed correctly for how each team uses them. John opens the frontend page 1400, selects “Building 102”, and selects “Device Usage” measurement from “Explore” drop down menu 1422 to see how well each room's usage matches its equipment. He then selects the bar graph 1434 under the “Purpose” tag 1206h in the break down bar 1424. He observes that VTC equipment is only u...


PUM


Abstract

A building management system that determines space utilization in a building. The building management system comprises room utilization sensors, such as occupancy sensors, a gateway that gathers raw occupancy data records from the occupancy sensors, and at least one processor. Each raw occupancy data record comprises an occupancy state associated with a timestamp. The processor is configured for normalizing the raw occupancy data records into normalized occupancy data records each comprising a time segment and an occupancy state indicating whether for a given time segment a room is occupied. The processor is further configured for structuring the normalized occupancy data records by associating each normalized occupancy data record with a space node corresponding to a room in the building from where the raw occupancy data record was collected and associating each space node with a set of tags, each tag defining a single state from a plurality of states. The processor may further receive a selection of a tag from a user interface, split the normalized occupancy data records along the selected tag's states into sets of normalized occupancy data records, for each split set of occupancy data records, calculate at least one occupancy rate, and display a visualization of space utilization of the building comprising a comparison of the occupancy rates of the selected tag's states.

Description

BACKGROUND OF THE INVENTIONTechnical Field[0001]Aspects of the embodiments relate to a building management system, more specifically to systems, methods, and modes for determining building utilization for building control and management.Background Art[0002]Understanding building utilization is extremely valuable in enterprise management. It allows for efficient space and resource allocation without unnecessary expenditure on excess workspace, energy, operation, and maintenance. Yet, it is a continuous challenge as there are currently no good ways to identify if a workspace, such as a meeting space, is being used effectively. Facility and real estate managers design rooms and choose room capacity and equipment based on little more than a guess of what is needed. User complains is typically the only indication that there are not enough rooms (or rooms of a certain type). But these indications may be misleading as, for example, rooms may be overbooked while actual room utilization may ...

Claims


Application Information

Patent Timeline
IPC IPC(8): G06F17/30
CPCG06F17/30368G06F17/30371G06F17/30551G06F17/30327G06F17/30554G06F17/30525H04L12/2803G06F16/2228G06F16/24575G06F16/248G06F16/285G06F16/9535
Inventor DONLAN, BRIANJACKSON, DANIEL
Owner CRESTRON ELECTRONICS
Learn More