Apparatus and method for absolute quantification of biomarkers for solid tumor diagnosis

a biomarker and absolute quantification technology, applied in the field of absolute quantification of biomarkers for solid tumor diagnosis, can solve the problems of semi-quantitative nature, significant increase in diagnosis errors, and difficult to adapt this technique into a high throughput forma

Active Publication Date: 2019-01-03
QUANTICISION DIAGNOSTICS INC
View PDF0 Cites 4 Cited by
  • Summary
  • Abstract
  • Description
  • Claims
  • Application Information

AI Technical Summary

Benefits of technology

[0021]Consequently, the present invention provides a continuous result to replace the current prevailing discrete result. Thus, the present invention opens more opportunities than the current prevailing method of IHC and FISH.
[0042]These and other embodiments of the present invention rely at least in part upon the finding that the absolute nature of the QDB analysis allows for combining results from more than one source for analysis. The continued addition of new information from QDB analysis allows growing of a QDB database. Information obtained through analysis of a QDB database provides diagnosis or prognosis for a patient.

Problems solved by technology

However, all these results are semi-quantitative in nature.
Although IHC provides valuable morphological information, and numerous efforts have been invested to standardize the analytical procedure, its result is still qualitative, affected by various factors including the process of treatment, the field of view and inter-observer variability.
It is also rather challenging to adapt this technique into a high throughput format.
The uncertainty associated with IHC analysis consequently leads to significantly increased error in diagnosis.
The categorized results of IHC analysis also makes it difficult for further data analysis.
Thus, results from IHC analysis are unable to be used for extensive data analysis to provide more accurate, more predictive diagnosis or prognosis as we expected.
Nonetheless, these methods are complicated and labor intensive, not suitable for high throughput analysis of a large number of samples.
The complex process also leads to significantly increased operating cost and efforts.

Method used


Image

  • Apparatus and method for absolute quantification of biomarkers for solid tumor diagnosis
  • Apparatus and method for absolute quantification of biomarkers for solid tumor diagnosis
  • Apparatus and method for absolute quantification of biomarkers for solid tumor diagnosis

Examples


example 1

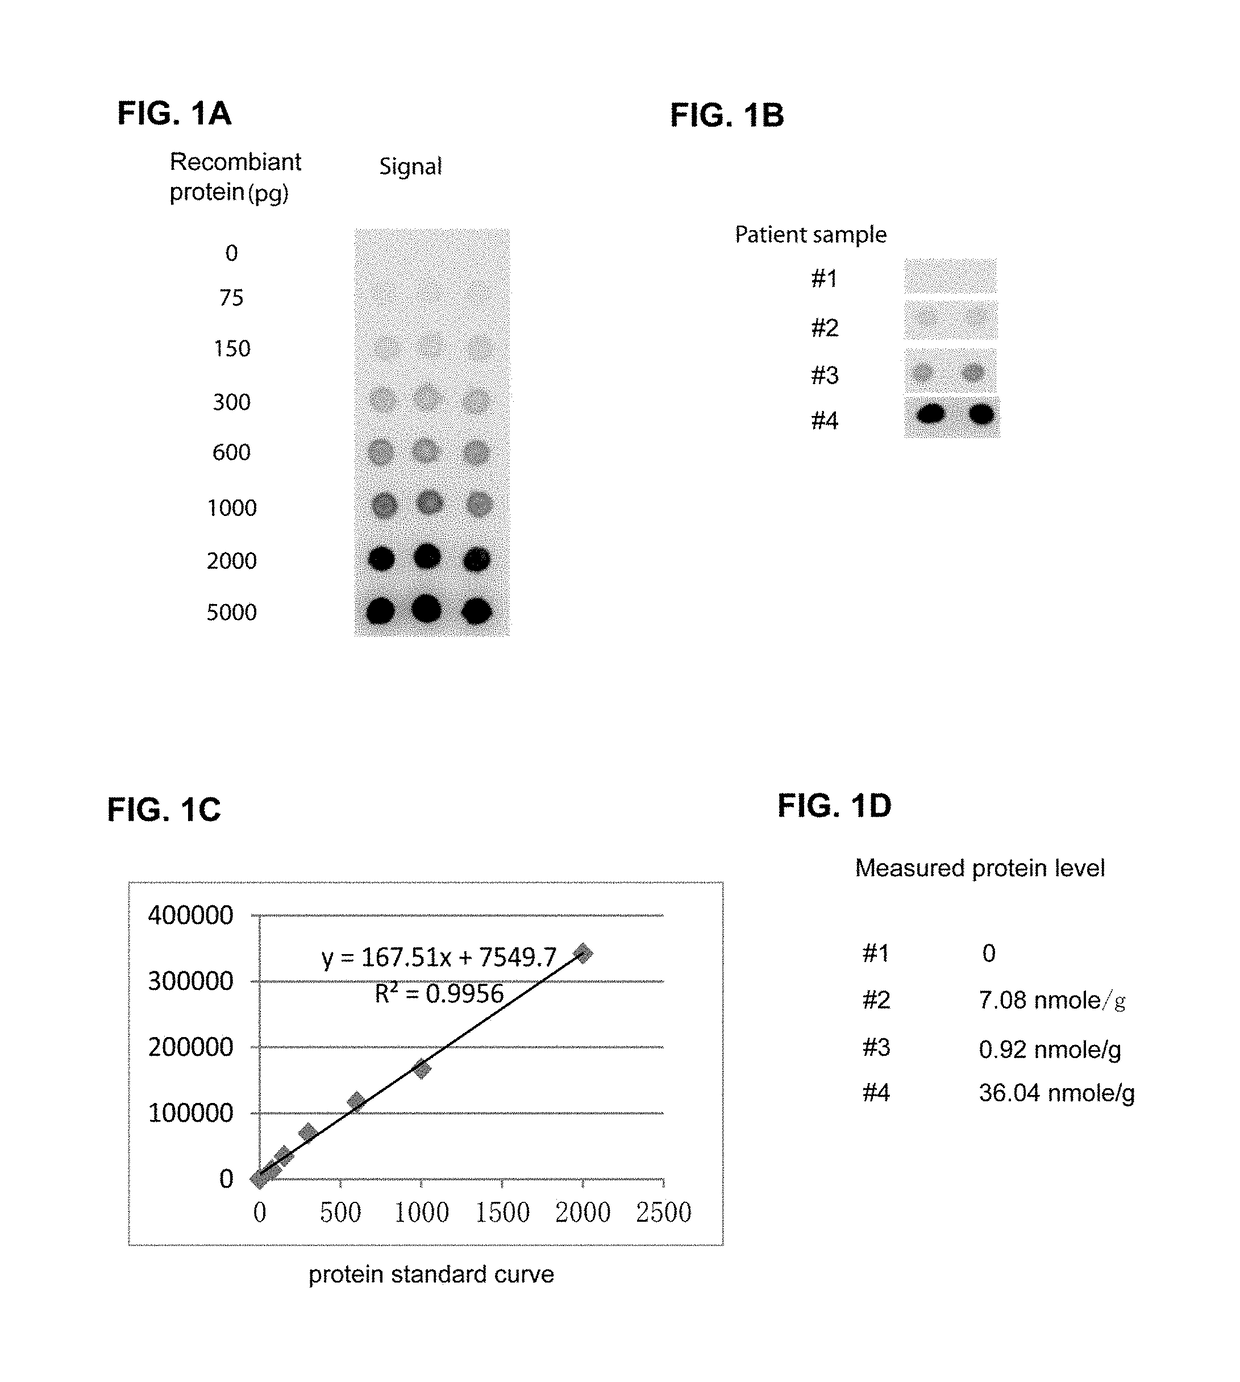
Teaches how to Measure Absolute Her2 Level in FFPE Specimen Using Dot Blot Analysis

[0133]In 1A, recombinant Her2 protein was serially diluted and spotted onto a membrane together with four patient samples extracted from FFPE blocks.

[0134]The spotted protein standards and patient samples on the membrane was processed in dot blot analysis using EP3 clone for Her2 protein, and the image was captured using C-Digit Western blot scanner from Li-Cor, as shown in FIGS. 1A and 1B.

[0135]The image in FIG. 1A was converted into numbers using ImageQuant software from Li-Cor, and these numbers were used to establish a protein standard curve, as shown in FIG. 1C.

[0136]The images from 4 patient samples were also converted into number using the same computer software, and the numbers were converted into absolute Her2 level based on the protein standard curve established in section [0098].

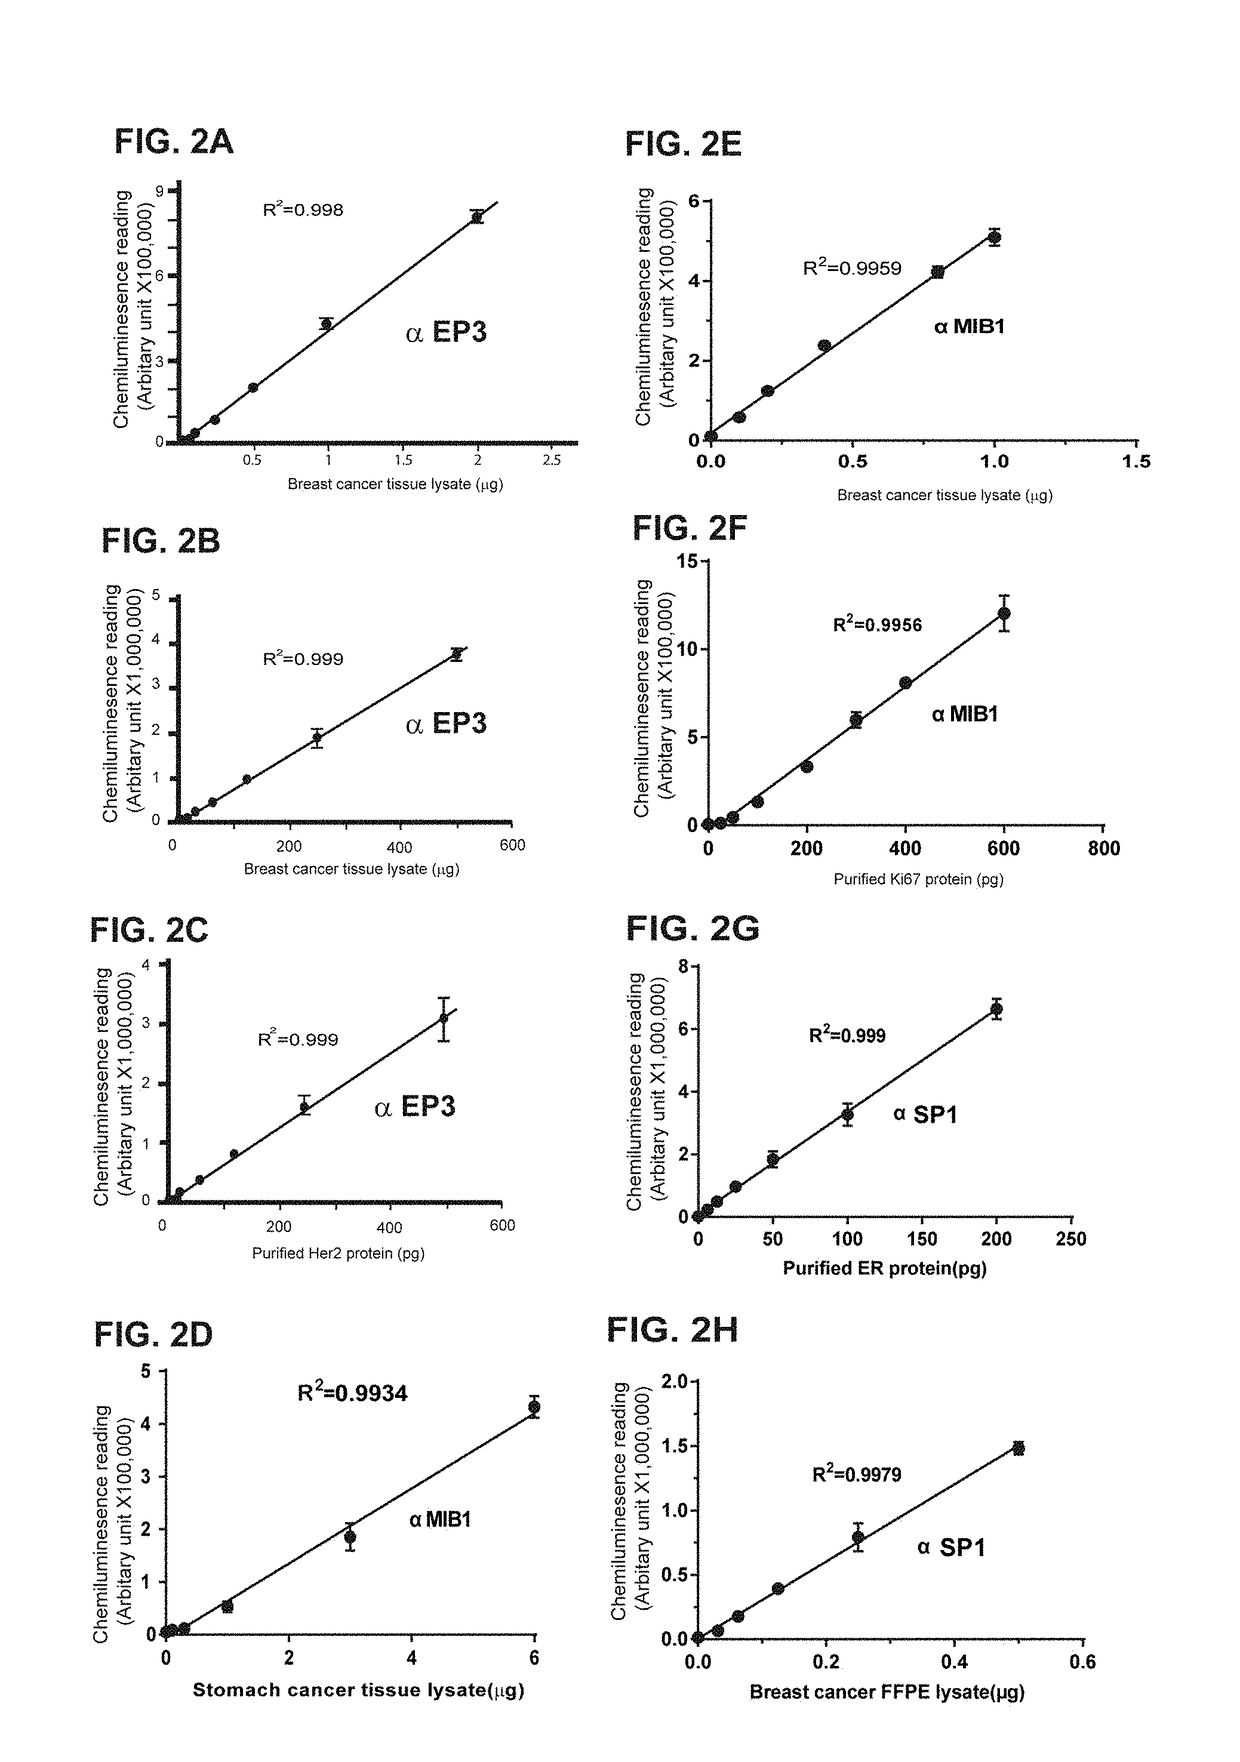
[0137]FIGS. 2A-2H teach how to define the linear range of the QDB analysis using a specific antibody. FIG. 2A sho...


PUM

PropertyMeasurementUnit
temperatureaaaaaaaaaa
volumeaaaaaaaaaa
weightaaaaaaaaaa

Abstract

Provided is a method for quantitative analysis of a sample. The method includes steps of (a) providing a singular marker representative of one or more features of the sample, the sample comprising a population of individual units of the marker; (b) measuring the marker with dot blot analysis, wherein the quantitation result is an absolute amount of the marker's population of individual units in the sample, normalized by the sample volume or by the sample weight; and (c) obtaining an objective determination of the one or more features of the sample based on the quantitation result of the marker. Also disclosed is a reference database and a method to use the reference database for diagnosing cancer in a patient.

Description

CROSS-REFERENCE TO RELATED APPLICATIONS[0001]This application is a U.S. nonprovisional patent application which claims the benefit of provisional application No. 62 / 526,425, filed on Jun. 29, 2017, the disclosure of which is hereby incorporated by reference. Further, U.S. application Ser. No. 14 / 721,205, filed on May 26, 2015, and U.S. application Ser. No. 15 / 433,586, filed on Feb. 15, 2017, are also hereby incorporated by reference in their entireties for all purposes.FIELD OF THE INVENTION[0002]The present disclosure relates to methods and apparatus for quantification of biomarker at tissue level for diagnostics purpose using immunoblot method. Specifically, this disclosure provides methods and apparatus to measure the expression level of a biomarker using quantitative dot blot analysis (QDB), and when combined with a reference database, to provide diagnosis and prognosis for solid tumors.BACKGROUND[0003]Protein analysis is the basis of modern biological research. It centers on an...

Claims


Application Information

Patent Timeline
Patent Type & Authority Applications(United States)
IPC IPC(8): G01N33/543G01N33/68G01N33/574G16H50/20
CPCG01N33/54306G01N33/6893G01N33/57484G16H50/20G01N2800/52G01N33/574
Inventor ZHANG, JIANDI
Owner QUANTICISION DIAGNOSTICS INC
Why Eureka
Try Eureka