Method for selecting odor control substance

Pending Publication Date: 2019-12-05
KAO CORP
2 Cites 1 Cited by

AI-Extracted Technical Summary

Problems solved by technology

At the same time, unpleasant smells are also important.
However, cur...

Benefits of technology

[0028]selecting a test substance which enhances or decreases the response of the olfactory...

Abstract

Provided is a method for searching a substance which enhances an odor. The method is a method for selecting a substance which causes enhancement or suppression of an odor and includes measuring a response of a broadly tuned olfactory receptor in the presence of a test substance and selecting a test substance which enhances or decreases the response of the olfactory receptor as a substance which causes enhancement or suppression of an odor.

Application Domain

Compound screeningApoptosis detection +3

Technology Topic

Selection methodOdor control +2

Image

  • Method for selecting odor control substance
  • Method for selecting odor control substance
  • Method for selecting odor control substance

Examples

  • Experimental program(5)

Example

Example 1 Evaluation of Ligand Selectivity of Human Olfactory Receptor
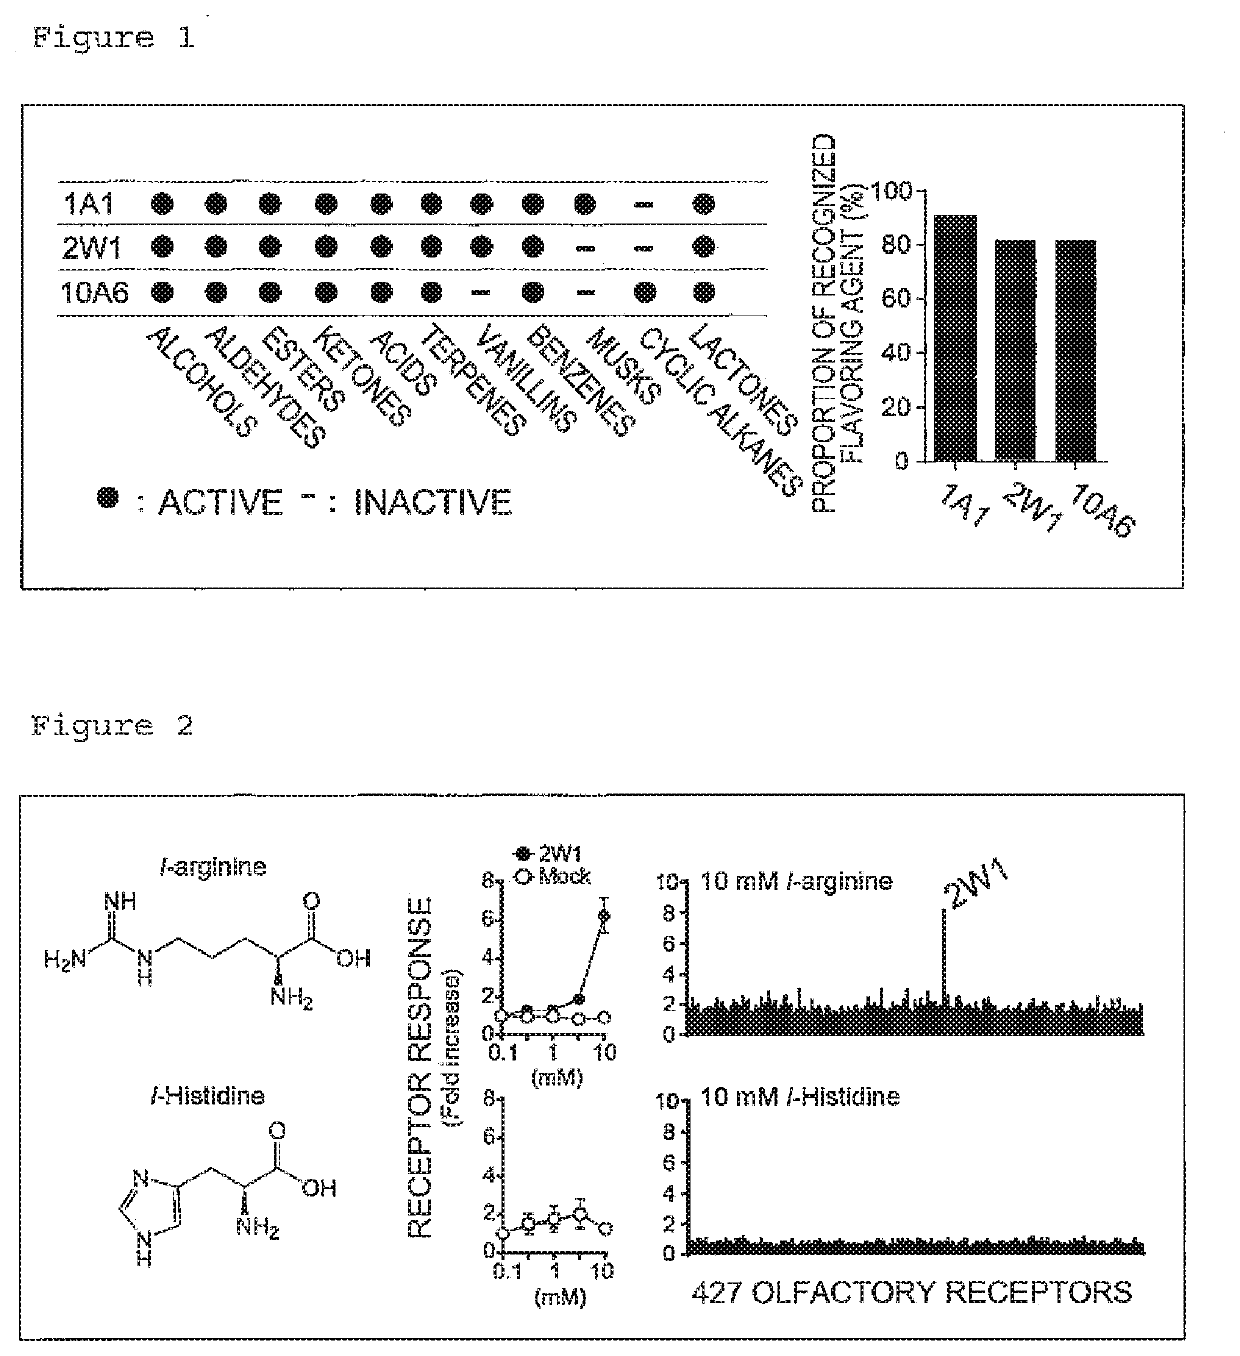
[0144]Response selectivity of olfactory receptors to various odorants with different structural classes was investigated. In this Example, 33 compounds selected from 11 groups (alcohols, aldehydes, esters, ketones, acids, terpenes, vanillins, benzenes, musks, cyclic alkanes, and lactones, each group including three or more odorants) based on similarity in the chemical structures were used as odorants.
[0145]DMEM solutions (Nacalai tesque, INC.) of each odorant were prepared at concentration (30 to 3000 μM) as high as possible taking the solubility and cytotoxicity of the odorant into accounts. The medium was removed from the culture of cells expressing an olfactory receptor prepared according to Reference Example 2) to 4), 30 μL of the odorant solution was added to each well, and luciferase assay was performed by the same procedure as in Reference Example 5). The cells were cultured for from 2.5 to 4 hours in a CO2 incubator to obtain sufficient expression of the luciferase gene in the cells, and the expression level was measured using the light emission quantity as an indicator.
[0146]The results are shown in FIG. 1. FIG. 1 shows odorant groups to which the cells expressing human olfactory receptor OR1A1, OR2W1, or OR1OA6 responded. The group in which an olfactory receptor responded to all three substances is designated as “ACTIVE” (filled circle). The group in which an olfactory receptor did not respond to one or more substances is designated as “INACTIVE” (−). As shown in FIG. 1, OR1A1 responded to about 90% (10 groups of 11 odorant groups), and OR2W1 and OR10A6 responded to about 80% (9 groups of 11 odorant groups) of the investigated odorant groups. This result demonstrated that these olfactory receptors are broadly tuned olfactory receptors which can recognize various groups of odorants,

Example

Example 2 Broadly Tuned Olfactory Receptor Selective Ligand
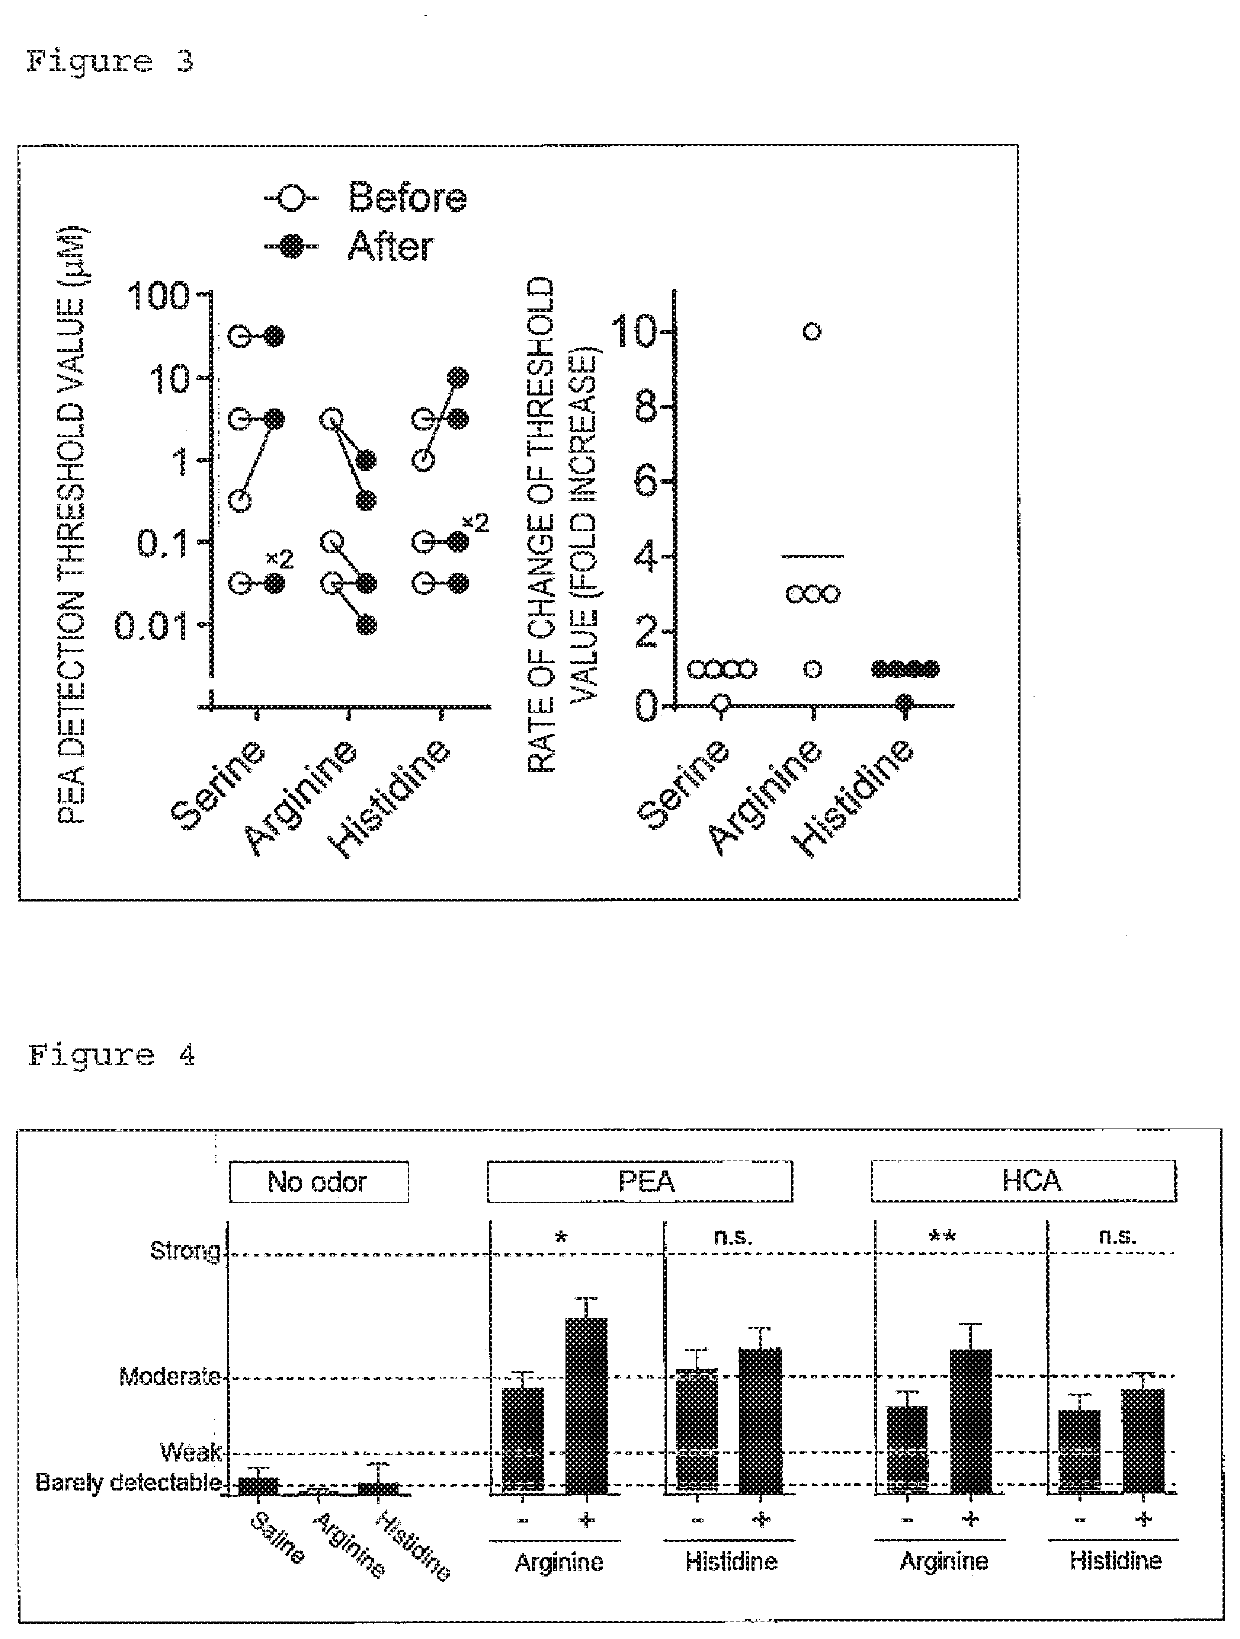
[0147]L-Arginine and 1-histidine were used as test substances. These test substances were each dissolved in Ringer's solution (140 mM NaCl, 5 mM KCl, 1 mM MgCl2, 2 mM CaCl2, 10 mM HEPES, 5 mM glucose, pH 7,4 (NaOH)) to prepare test substance solutions OR2W1 expressing cells were subjected to luciferase assay using the test substance solutions according to the procedure in Reference Example 2) to 5). The results are shown in FIG. 2. OR2W1 responded to 1-arginine concentration dependently (FIG. 2, upper middle). In contrast, OR2W1 expressing cells did not respond to 1-histidine (FIG. 2, bottom middle).
[0148]Furthermore, the responses of 427 olfactory receptors to 1-arginine and 1-histidine (10 mM) were investigated according to Reference Example 2) to 5). The results demonstrated that no olfactory receptors other than OR2W1 responded to 1-arginine (FIG. 2, upper right). All the investigated olfactory receptors did not respond to 1-histidine (FIG. 2, bottom right). It was accordingly demonstrated that 1-arginine is a substance selectively activating OR2W1.

Example

Example 3 Influence on Olfaction by Nasal Administration of 1-arginine
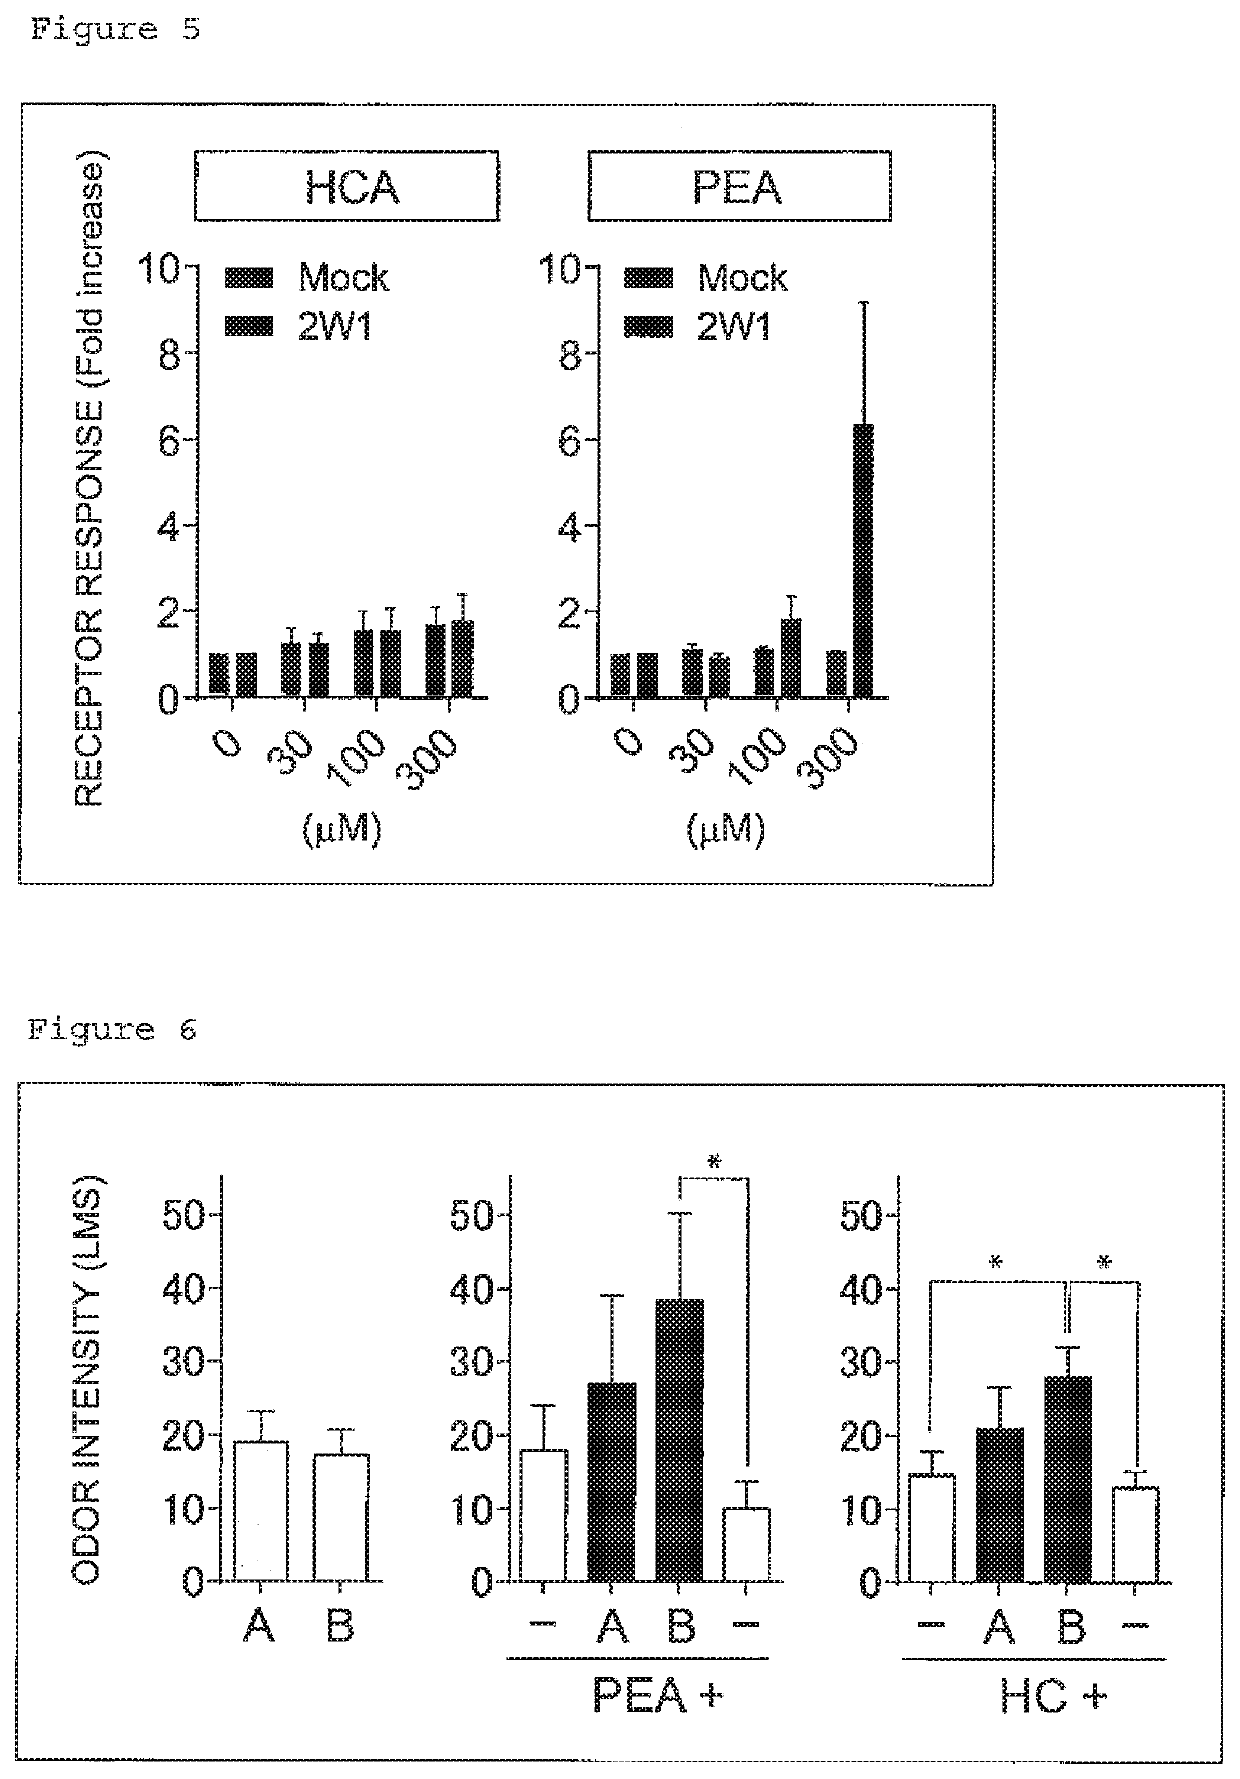
1) Effect of Odor on Detection Threshold Value (Detection Sensitivity)
[0149]The action of 1-arginine, which is an OR2W1 selective ligand, on olfaction was evaluated by sensory examination. Three samples, saline (Otsuka Pharmaceutical Co., Ltd.), saline aqueous solution containing 10 mM 1-arginine, and saline aqueous solution containing 10 mM 1-histidine, were prepared and filled into nasal sprays (KT110-102, AS ONE Corporation). As an odorant, phenylethyl alcohol (PEA), which is widely used in sensory examination as a substance and does not activate the trigeminal nerve system and gives a rose odor, was selected. PEA aqueous solutions with 11 different concentrations from 0.001 to 100 WA were prepared as test solutions, and 3 mL of each of the solutions was respectively added to 20-mL glass vials (Maruemu Corporation).
[0150]The experiment was blinded to both an examiner and an examinee. The examiner set the spray spout in the nasal cavity of the examinee as deep as possible and sprayed once. The amount of liquid ejected thereby was about 100 to 200 μL. Before the spraying and one minute after the spraying, two vials each containing an aqueous solution only and one vial containing a test solution, three vials in total, were presented to the examinee, and the examinee was questioned about which vial contained the odor. When the vial of the test solution was correctly indicated, a retest was performed using a test solution with one step lower concentration. When the answer was incorrect, a retest was performed using a test solution with one step higher concentration. The concentration that gave a correct answer three consecutive times after answering an incorrect answer was determined as the detection threshold value. The threshold test performed again after the spraying was started from a concentration ten times the threshold value concentration before the spraying. The threshold test was performed by nasal administration of any of saline, arginine, and histidine. After an interval of 2.5 hours or more, a threshold test was performed by nasal administration of another sample. Before and after the nasal administration of a sample, detection threshold values of an examinee to PEA were measured. The rate of change in the threshold value was determined by calculating (threshold value concentration before sample nasal administration)/(threshold value concentration after sample nasal administration).
[0151]As a result, in an examinee after nasal administration of 1-arginine, the PEA detection threshold value was decreased in statistically significant manner (FIG. 3). Such an effect was not observed in nasal administration of saline and 1-histidine which do not activate OR2W1 These results revealed that 1-arginine raises the human detection threshold value (detection sensitivity) of a PEA odor and suggested that OR2W1, which is only one activated by 1-arginine, brings the effect.
2) Effect of Odor on Detection Strength
[0152]Whether the odor of an odorant was enhanced or not by simultaneous exposure to the odorant and 1-arginine was investigated by comparing with exposure to the odorant alone. PEA or hexyl cinnamic aldehyde (HCA) was used as the odorant. The odorant was added at a final concentration of 0.1 mM to a saline aqueous solution with 1-arginine (10 mM) and a saline aqueous solution with 1-histidine (10 mM) as a control. The resulting solutions were sprayed to an examinee for inhaling using an ultrasonic nebulizer (NE-U07: OMRON Corporation, atomization particle diameter: 1 to 8 μm (80% of total volume particle diameter distribution)) with a spray amount of about 170 μL (for about 20 seconds) at most, and odor intensity was evaluated.
[0153]The odor intensity was evaluated according to the method of Green, et al, (Chemical senses, 1996, 21: 323-34) with the labeled magnitude scale (LMS) shown below. That is, assuming the full scale length was 100%, labels were set to the following positions: Barely detectable: 1.4%, Weak: 6.1%, Moderate: 17.2%, Strong: 35.4%, Very strong: 53.3%, Strongest imaginable: 100%.
[0154]As a result, the odor intensities of both odorants, PEA and HCA, were enhanced in statistically siggificant manner by using together with 1-arginine (FIG. 4). In contrast, in the use together with 1-histidine, the effect of enhancing the odor intensity was not observed in both odorants. These results revealed that 1-arginine raises the detection strength of human for an odor and suggested that OR2W1, which is only one activated by 1-arginine, brings the effect.
3) Effect of Odor on Quality
[0155]If a broadly tuned olfactory receptor controls only the strength of an odor, not the quality, activation with OR2W1 alone is expected not to turn the odor quality (specific odor). Accordingly, whether or not human odor sensation occurs was investigated by activating, among about 400 olfactory receptors, only of OR2W1 by 1-arginine. Since 1-arginine is not volatile, 1-arginine dissolved in saline was administered in the nasal cavity of five examinees by nasal spray. As a result, nasal administration of 1-arginine did not cause odor sensation. In nasal administration of another substance by the same procedure, odor sensation occurred in three of five examinees, which demonstrated that the substance nasally administered by this method reached the olfactory epithelium. These results suggest that the activation of OR2W1 is not involved in occurrence of odor quality (specific odor). The experimental results further support the hypothesis that broadly tuned olfactory receptors do not generate the odor quality (specific odor) (see Non-Patent Literature 2).

PUM

PropertyMeasurementUnit
Fraction0.8fraction
Fraction0.9fraction
Fraction1.2fraction

Description & Claims & Application Information

We can also present the details of the Description, Claims and Application information to help users get a comprehensive understanding of the technical details of the patent, such as background art, summary of invention, brief description of drawings, description of embodiments, and other original content. On the other hand, users can also determine the specific scope of protection of the technology through the list of claims; as well as understand the changes in the life cycle of the technology with the presentation of the patent timeline. Login to view more.
Why Eureka
Try Eureka