Real-Time Measurement And System Monitoring Based On Generated Dependency Graph Models Of System Components

a dependency graph and real-time measurement technology, applied in the field of real-time measurement and system monitoring based on generated dependency graph models of system components, can solve the problems of large amount and diversity of data systems containing large amounts of structured, semi-structured, unstructured data relevant, and query can be massiv

Active Publication Date: 2020-04-02
SPLUNK INC
View PDF0 Cites 52 Cited by
  • Summary
  • Abstract
  • Description
  • Claims
  • Application Information

AI Technical Summary

Problems solved by technology

The large amount and diversity of data systems containing large amounts of structured, semi-structured, and unstructured data relevant to any search query can be massive,

Method used


Image

  • Real-Time Measurement And System Monitoring Based On Generated Dependency Graph Models Of System Components
  • Real-Time Measurement And System Monitoring Based On Generated Dependency Graph Models Of System Components
  • Real-Time Measurement And System Monitoring Based On Generated Dependency Graph Models Of System Components

Examples


Embodiment Construction

[0049]Embodiments are described herein according to the following outline:

[0050]1.0. General Overview

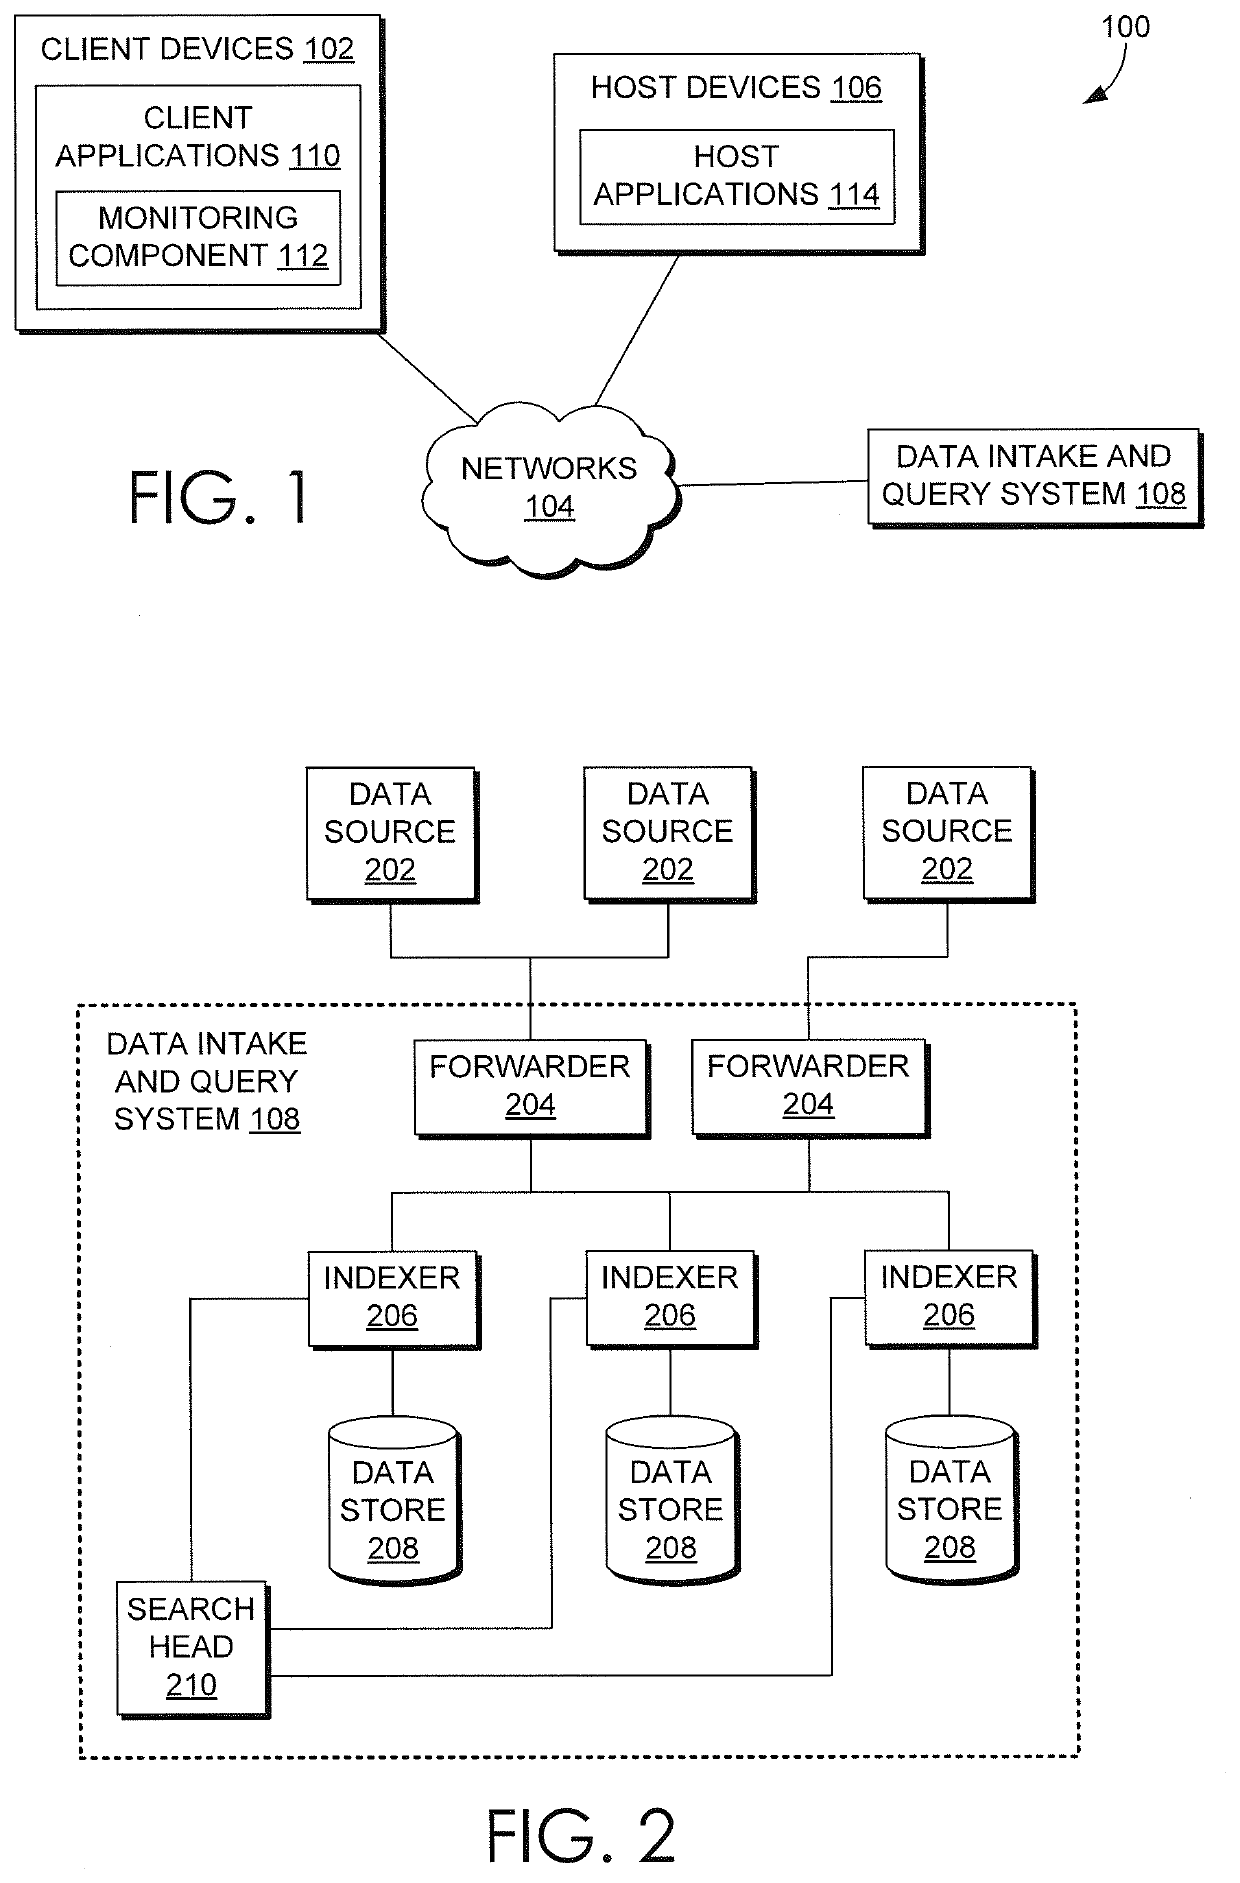
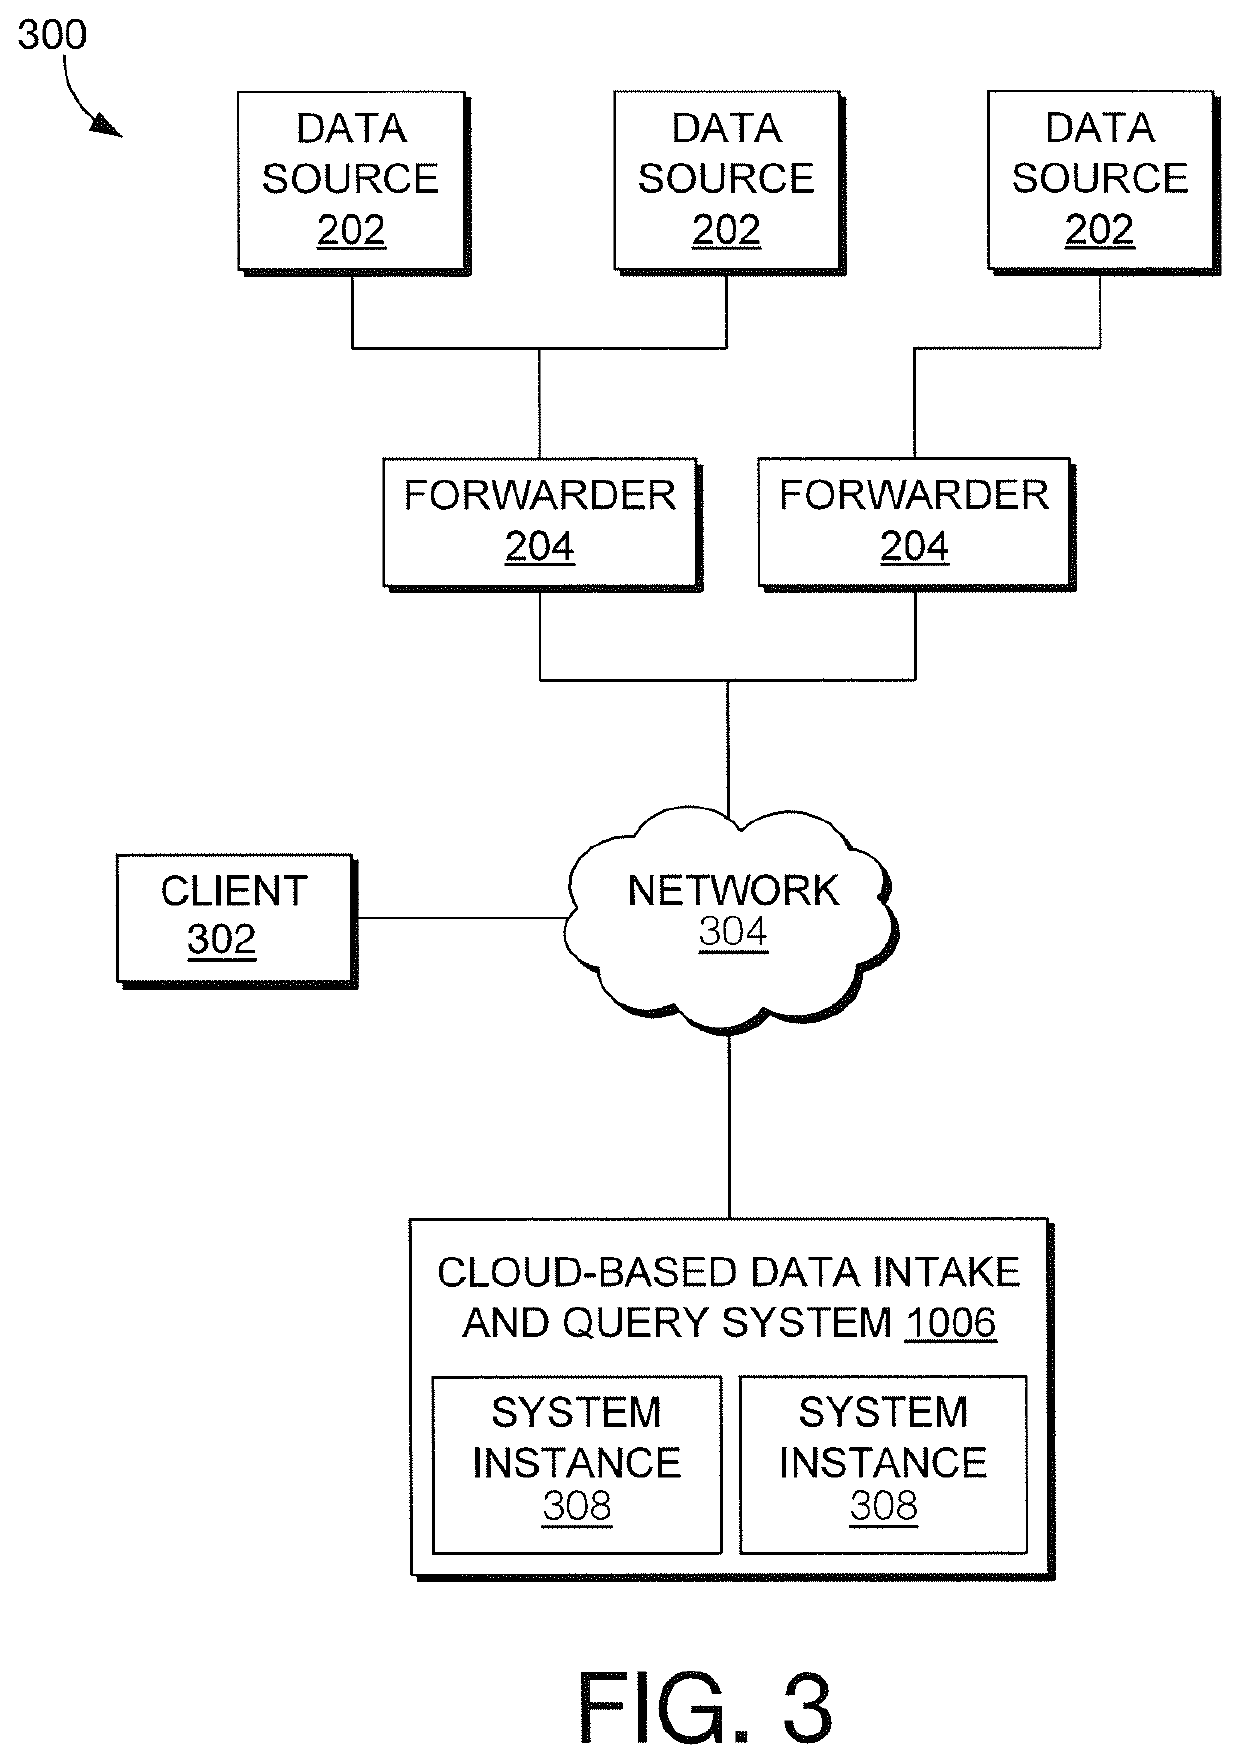
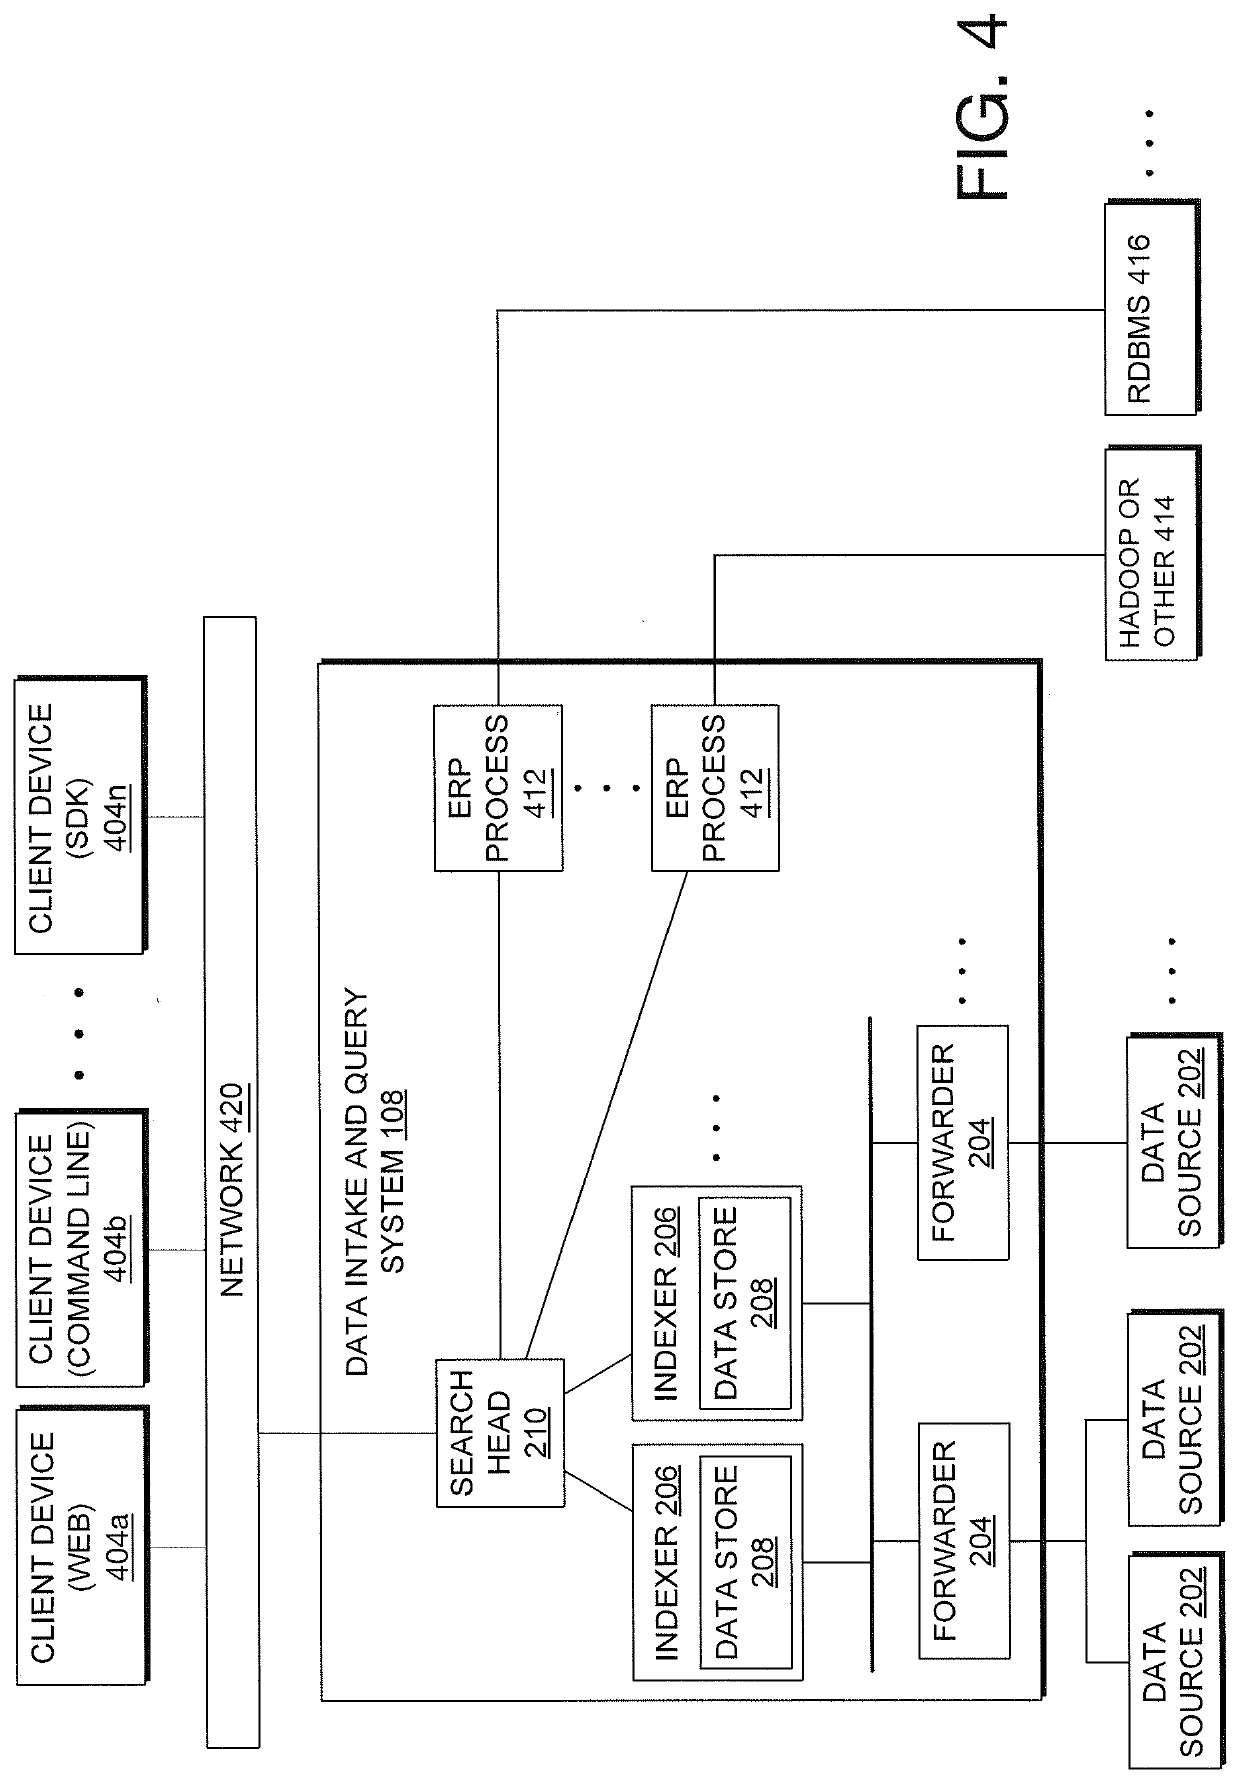
[0051]2.0. Operating Environment[0052]2.1. Host Devices[0053]2.2. Client Devices[0054]2.3. Client Device Applications[0055]2.4. Data Server System[0056]2.5 Cloud-Based System Overview[0057]2.6 Searching Externally-Archived Data[0058]2.6.1. ERP Process Features[0059]2.7. Data Ingestion[0060]2.7.1. Input[0061]2.7.2. Parsing[0062]2.7.3. Indexing[0063]2.8. Query Processing[0064]2.9. Pipelined Search Language[0065]2.10. Field Extraction[0066]2.11. Example Search Screen[0067]2.12. Data Modeling[0068]2.13. Acceleration Techniques[0069]2.13.1. Aggregation Technique[0070]2.13.2. Keyword Index[0071]2.13.3. High Performance Analytics Store[0072]2.13.3.1 Extracting Event Data Using Posting Values[0073]2.13.4. Accelerating Report Generation[0074]2.14. Security Features[0075]2.15. Data Center Monitoring[0076]2.16. IT Service Monitoring[0077]2.17 Cloud-Based Architecture[0078]2.18 Dependency Graph ...


PUM


Abstract

Machine data is collected from multiple sources of an operating environment such as an information technology system, factory floor, or the like, into a data intake and query system, in one embodiment. Metrics representative of the environment are included in or derived from the data. Users may interact with an interface to depict a representation of various metrics and interdependencies and that depiction is reflected in a computer storage model. Changes to the computer storage model based on the user interaction may also result in training of a machine learning model according to the user interaction, the machine learning model configured to determine a prediction, classification or clustering of a result of a first search query by utilizing a result of at least a second search query as input to the machine learning model.

Description

FIELD[0001]Embodiments of the disclosure relate to generating a dependency graph based on a plurality of monitored assets. More specifically, one embodiment of the disclosure relates to a computerized method for analyzing ingested data to generate a dependency graph based on the ingested data, establishing relationships between nodes of the dependency graph and utilizing machine learning techniques to predict future metrics for a measurement underlying one or more of the nodes.GENERAL BACKGROUND[0002]Information technology (IT) environments can include diverse types of data systems that store large amounts of diverse data types generated by numerous devices. For example, a big data ecosystem may include databases such as MySQL and Oracle databases, cloud computing services such as Amazon web services (AWS), and other data systems that store passively or actively generated data, including machine-generated data (“machine data”). The machine data can include performance data, diagnost...

Claims


Application Information

Patent Timeline
IPC IPC(8): G06F17/30G06F15/18
CPCG06F16/248G06F16/2477G06F16/287G06N20/00G06F16/9532G06N5/047
Inventor BURNETT, RICKY GENEDAS, DIPOCKMCINTYRE, STEVEN SHAUNSANO, DARRELL
Owner SPLUNK INC
Why Eureka
Try Eureka