Interpolation between relational tables for purposes of animating a data visualization

a relational table and data visualization technology, applied in the field of visualizing scattered data points, can solve the problems of wasting a lot of time for a graphics processor to draw millions of glyphs covering all these data points

Inactive Publication Date: 2000-03-07
MORGAN STANLEY +1
View PDF16 Cites 139 Cited by
  • Summary
  • Abstract
  • Description
  • Claims
  • Application Information

AI Technical Summary

Problems solved by technology

Problems are encountered in visualizing scattered data when the number of data points is large.
The time it takes to build and display a scatter plot can become too long, thereby, precluding interactive, on-the-fly rendering of scattered data.
A serious problem occurs when many data points occupy the same location.
It takes a very long time for a graphics processor to draw millions of glyphs covering all these data points.
The same problems occur in three-dimensional scatter plots where three-dimensional (3-D) glyphs (e.g., cubes, spheres, etc.) are used to represent data points.
Rendering such a 3-D scatter plot for large numbers of data points can take a long time, as many glyphs must be processed.
There is no easy way to examine data inside a cluster.

Method used


Image

  • Interpolation between relational tables for purposes of animating a data visualization
  • Interpolation between relational tables for purposes of animating a data visualization
  • Interpolation between relational tables for purposes of animating a data visualization

Examples


Embodiment Construction

1. Overview and Terminology

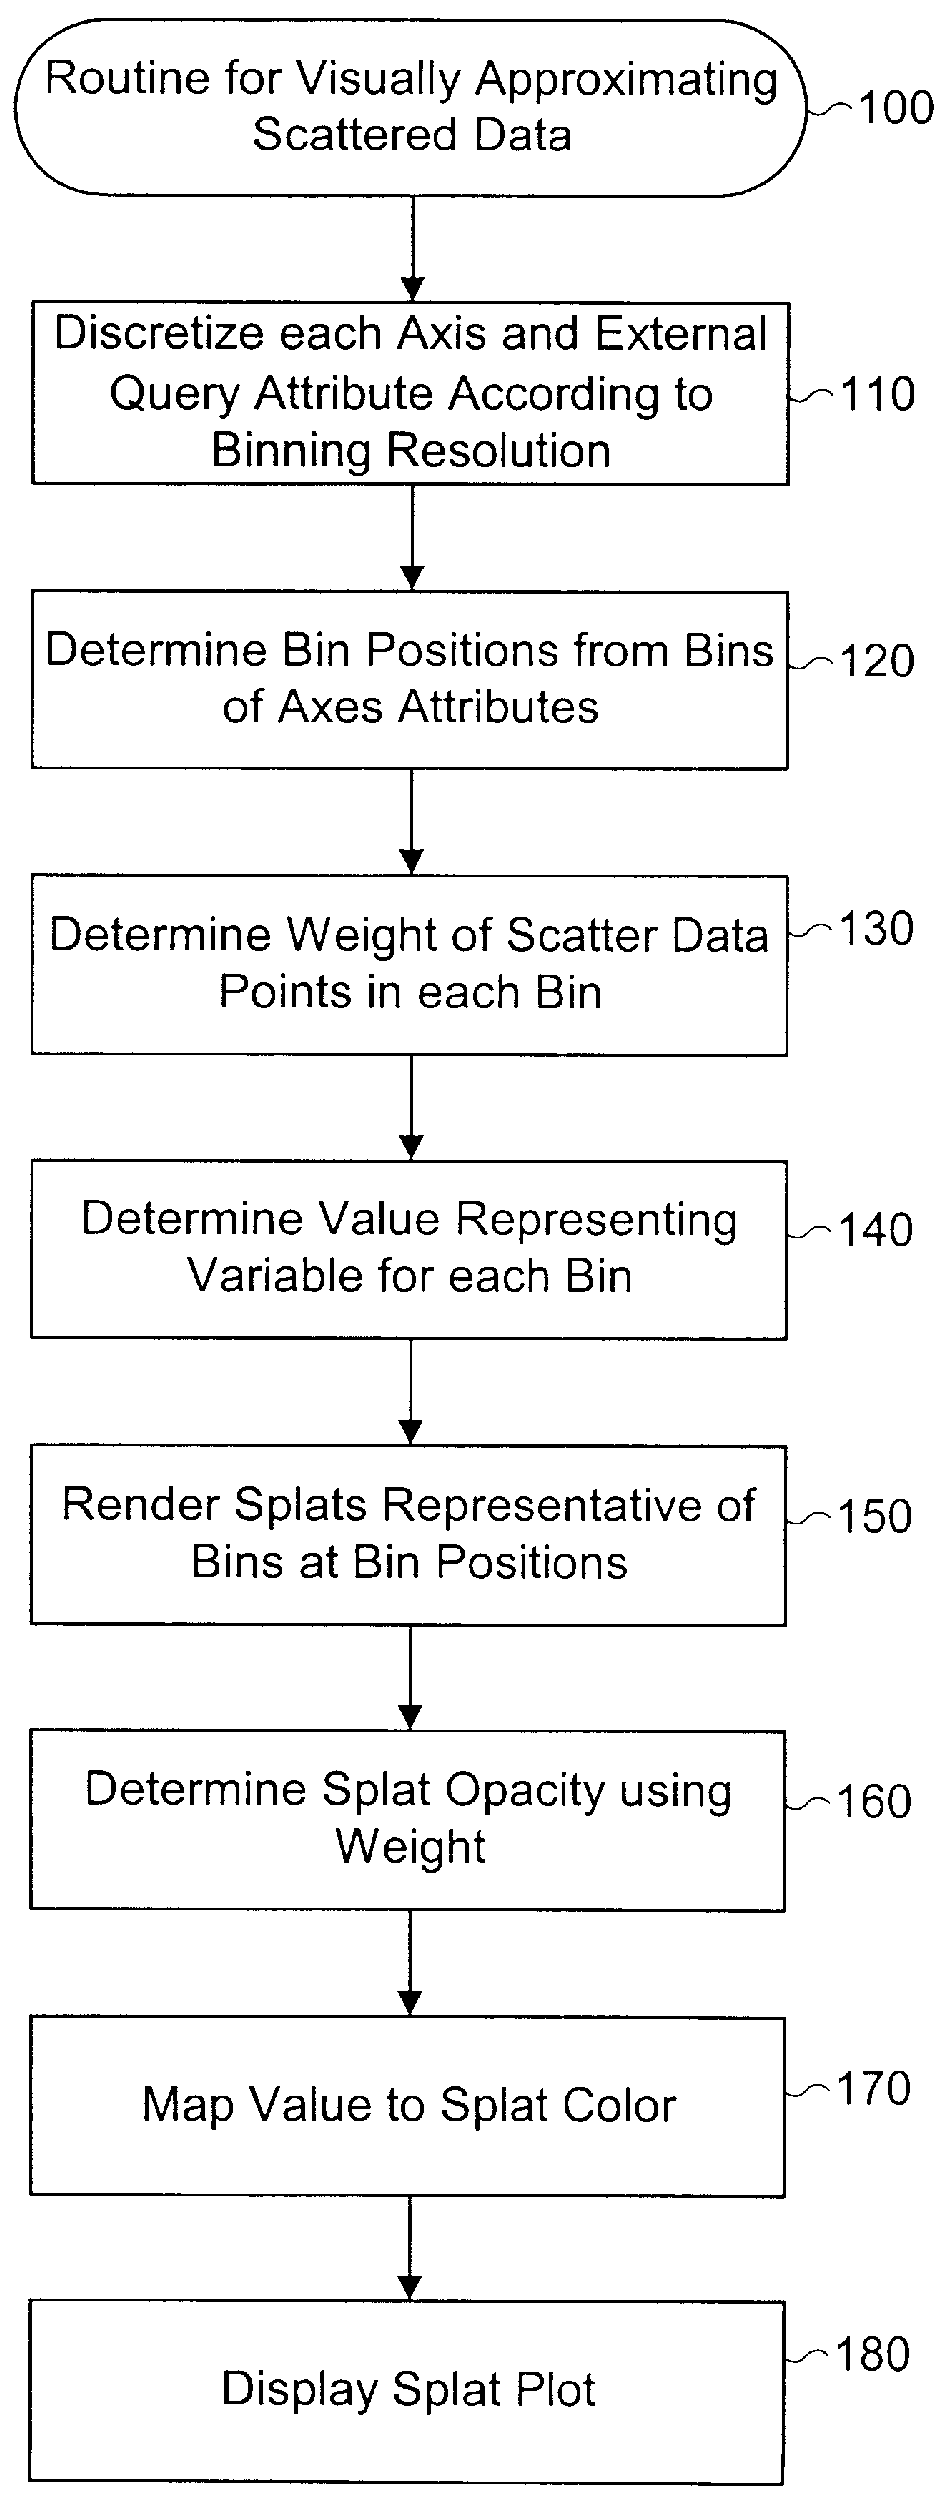
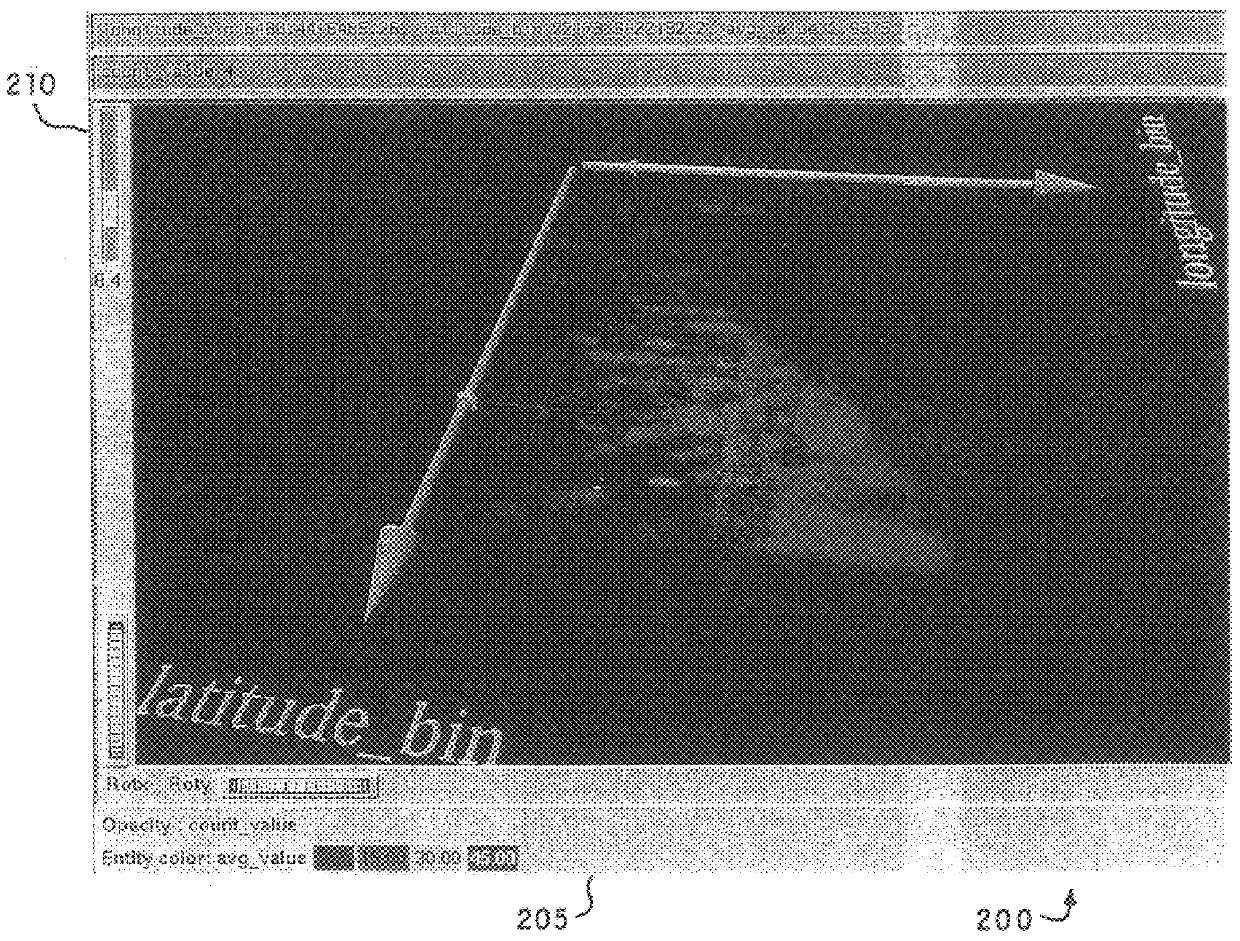
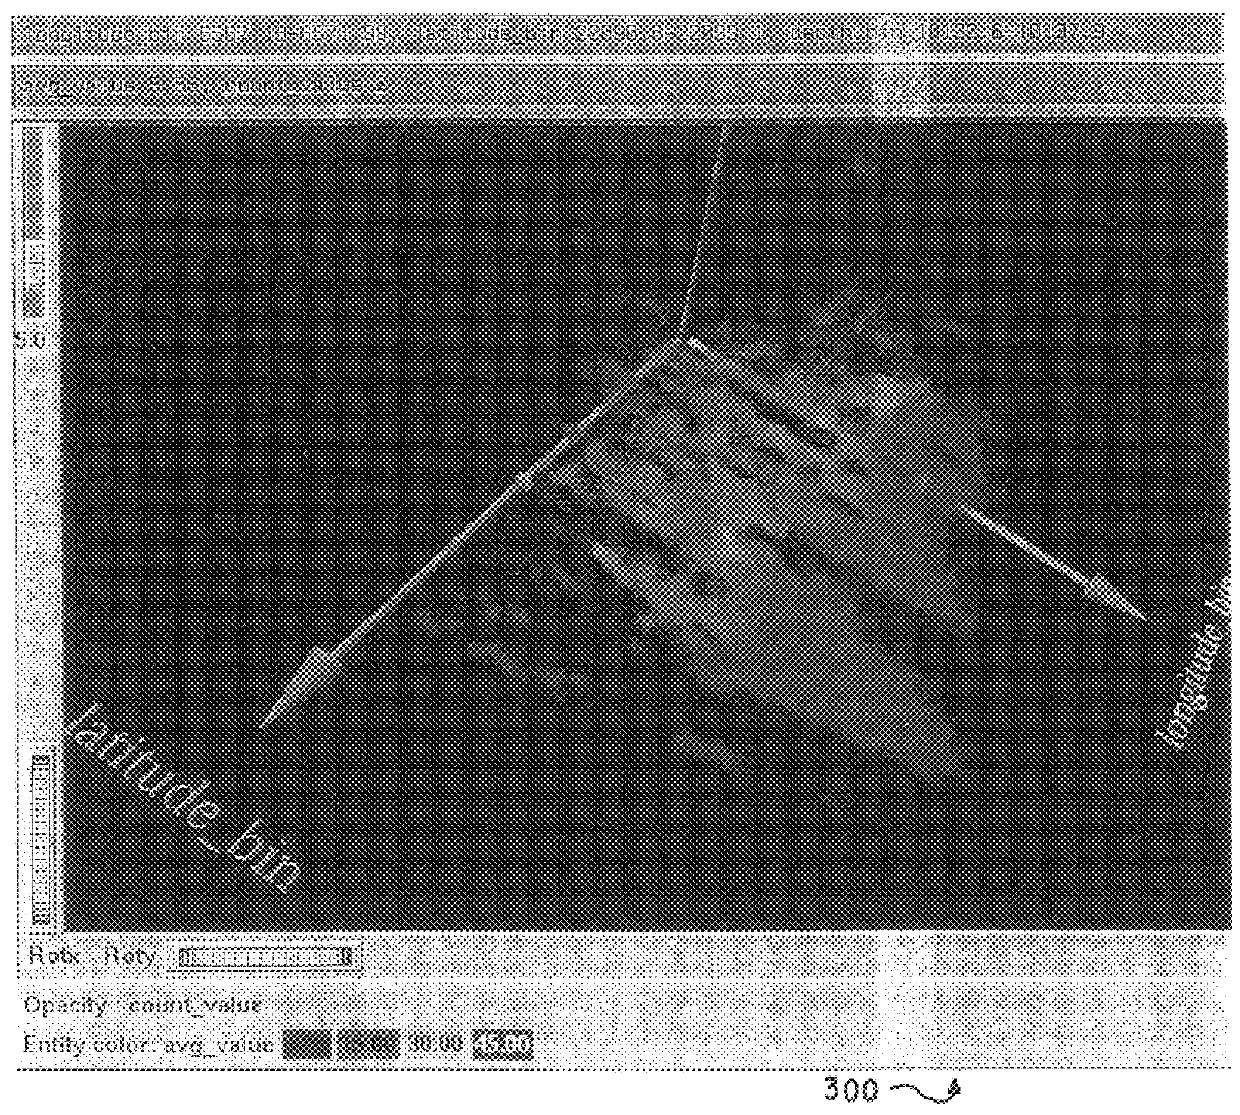
The present invention provides a new data visualization tool that visually approximates a scatter plot and provides smooth animation of graphics by using interpolated data. Bins, representing clouds of scattered data points, are volume rendered as splats. The opacity of each splat is a function of the density of data points (e.g. the count or number of data points) in a corresponding bin. The color of the splat represents a data attribute associated with the data points in a corresponding bin.

The following terms are used to describe the present invention:

"Data," "data points," "scattered data," "multivariate data," and equivalents thereof, are used interchangeably to refer to a data set having corresponding data attributes that are suitable for a multivariate data visualization, such as, a scatter plot. One data point can contain multiple data attributes. Data attributes are represented as numerical or categorical attributes in each axis of a scatter plot....


PUM


Abstract

A method, system, and computer program product are provided for a new data visualization tool that visually approximates a scatter plot and provides smooth animation of graphics by using interpolated data. An interpolation process is performed over pre-processed bins of scattered data points. A user can smoothly animate a plot along several dimensions by using an external query device to vary a selected data attribute. If the external query device (or slider) control is positioned in between discrete positions of the slider, the displayed plot corresponds to interpolated data. Adjacent data structures are determined corresponding to the position of the external query device. The adjacent data structures are merged together, then aggregated the using the spatial columns of the data structure as a unique key. An interpolated bin is generated, where the weight of the bin is interpolated and the dependent attribute is also interpolated and weighted. The interpolated dependent attribute is mapped to color in the visualized scatter plot. The plot appears as rendered splats corresponding to bin positions of the interpolated bins, where each splat has an opacity that is a function of the interpolated weight of data points in the corresponding bin.

Description

1. Field of the InventionThe present invention relates to visualizing scattered data points using a computer display.2. Related ArtComputer visualization tools are called upon to handle ever increasing amounts of data. Conventional scatter plots visually represent multivariate data points as graphical glyphs plotted along one, two, or three axes. Each data point has one or more data attributes, also called variables. These data attributes can be numerical or categorical. Each axis can represent a different data attribute. Additional data attributes can be represented by varying the color or size of the glyphs.Problems are encountered in visualizing scattered data when the number of data points is large. In general, each data point in a conventional scatter plot is represented by a corresponding glyph. As the number of scattered data points increases, more glyphs crowd a scatter plot display. The time it takes to render each glyph increases. The time it takes to build and display a s...

Claims


Application Information

Patent Timeline
Patent Type & Authority Patents(United States)
IPC IPC(8): G06T15/70G06T11/20G06T13/20
CPCG06T11/206G06T13/20
Inventor BECKER, BARRY GLENN
Owner MORGAN STANLEY
Why Eureka
Try Eureka