Method and system for dynamically representing cluster analysis results

a cluster analysis and dynamic representation technology, applied in the field of methods and systems for dynamically representing cluster analysis results, can solve problems such as limiting the effectiveness of cluster analysis

Inactive Publication Date: 2002-04-30
IBM CORP
View PDF6 Cites 46 Cited by
  • Summary
  • Abstract
  • Description
  • Claims
  • Application Information

AI Technical Summary

Problems solved by technology

In particular, current computer automated methods of plotting a static hierarchical tree limit the effectiveness of interpreting cluster analysis.

Method used


Image

  • Method and system for dynamically representing cluster analysis results
  • Method and system for dynamically representing cluster analysis results
  • Method and system for dynamically representing cluster analysis results

Examples


Embodiment Construction

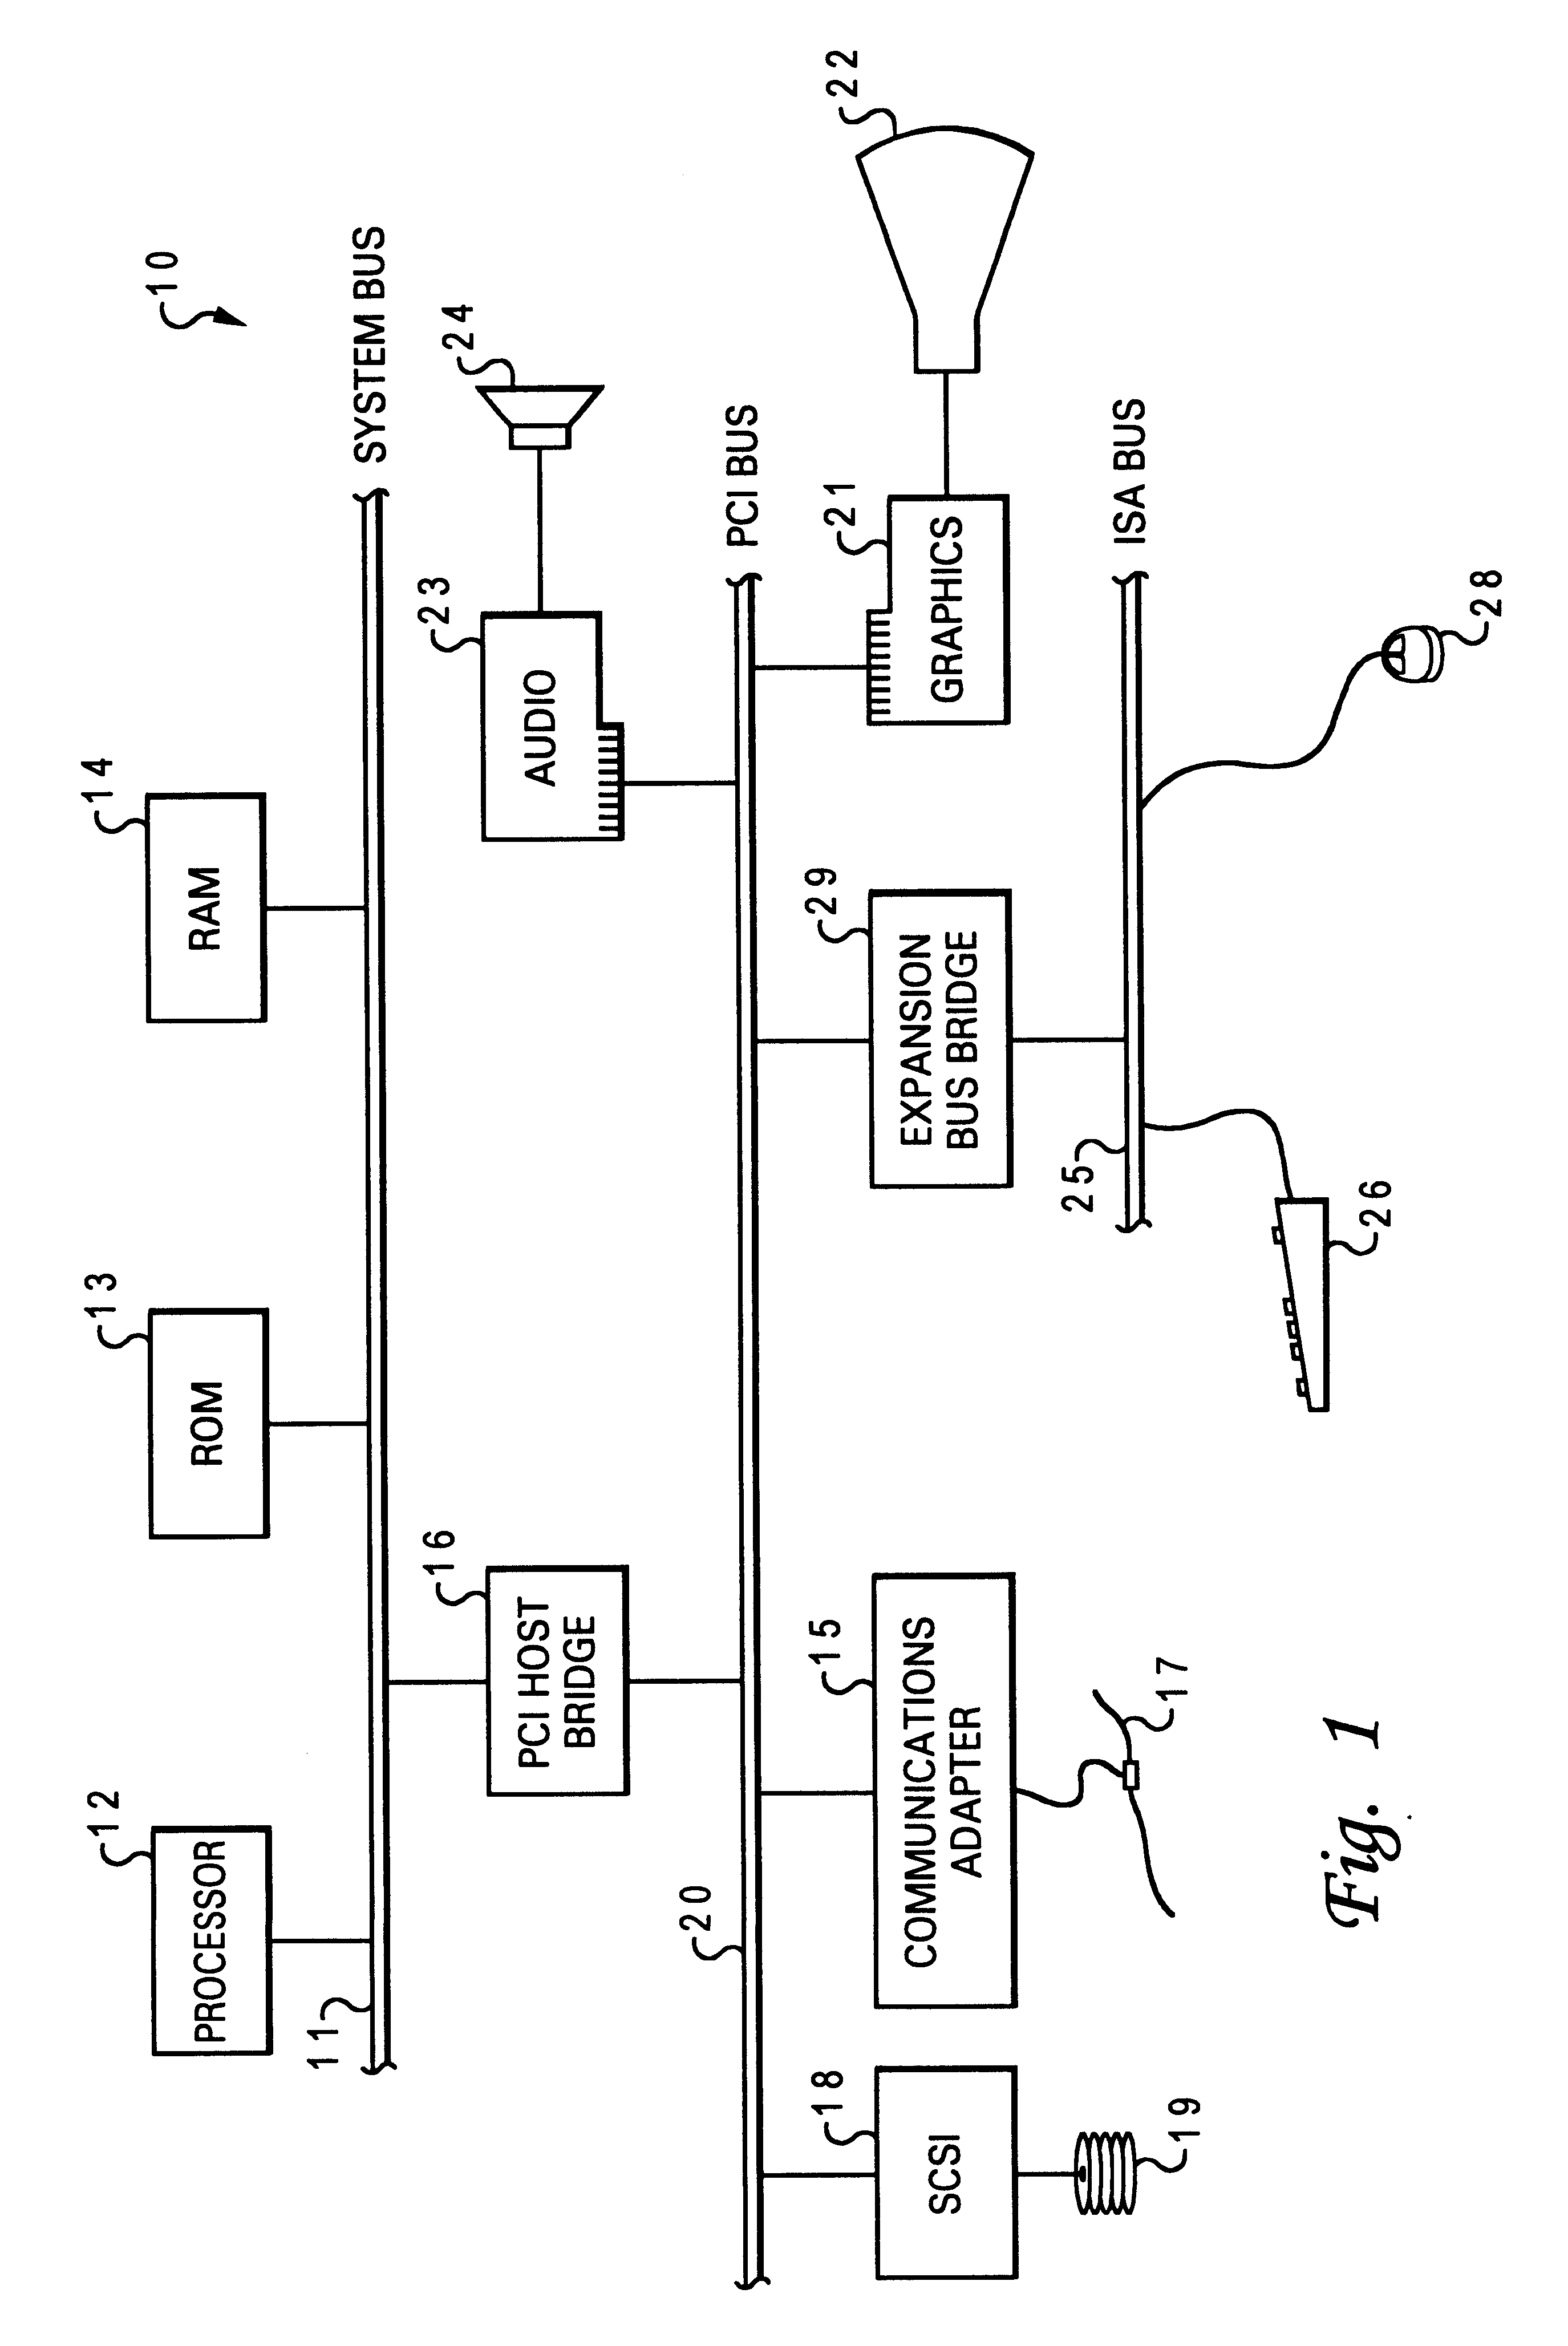
The present invention may be executed in a variety of computers under a number of different operating systems. The computer may be, for example, a personal computer, a midrange computer or a mainframe computer. In addition, the computer may be a stand-alone system or part of a network such as a local-area network (LAN) or a wide-area network (WAN). For the purposes of illustration, a preferred embodiment of the present invention, as described below, is implemented on a personal computer, such as the Aptiva series manufactured by International Business Machines Corporation.

Referring now to the drawings and in particular to FIG. 1, there is depicted a block diagram of a typical computer system that may utilize a preferred embodiment of the present invention. As shown, a processor (CPU) 12, a read-only memory (ROM) 13, and a Random-Access Memory (RAM) 14 are connected to a system bus 11 of a computer system 10. CPU 12, ROM 13, and RAM 14 are also coupled to a PCI local bus 20 of comput...


PUM


Abstract

A method and system for dynamically representing cluster analysis results. In accordance with the method and system of the present invention, a hierarchical tree is graphically displayed. The hierarchical tree represents cluster analysis of relationships between multiple items utilizing an initial distance constraint value, wherein the graphical display includes a graphically alterable threshold indicator positioned within the hierarchical tree that graphically marks the distance constraint value. The presentation of the graphical display of the hierarchical tree is dynamically altered to reflect a user-determined distance constraint value, in response to user-controlled alteration of the graphical position of the threshold indicator, such that upon changing a distance constraint for a cluster analysis, the hierarchical tree which graphically represents the cluster analysis is dynamically altered.

Description

1. Technical FieldThe present invention relates in general to a method and system for graphically displaying data and, in particular, to a method and system for dynamically representing cluster analysis results. Still more particularly, the present invention relates to a method and system for dynamically altering a hierarchical tree which represents the cluster analysis results, in response to a graphical selection of a distance constraint value.2. Description of the Prior ArtA general question facing researchers in many area of inquiry is how to organize observed data into meaningful structures, that is, to develop taxonomies. For example, web page designers typically determine a hierarchy of site pages where a primary page or "home page" has multiple topics from which the user may select. To increase usability of the site, the designer preferably attempts to organize the pages in a manner which is intuitive to people who will utilize the web site.One method of determining how user...

Claims


Application Information

Patent Timeline
Patent Type & Authority Patents(United States)
IPC IPC(8): G06T11/20
CPCG06T11/206Y10S707/99936G06F18/231G06F18/40
Inventor DONG, JIANMINGMARTIN, SHIRLEY LYNNWALDO, PAUL DAVID
Owner IBM CORP
Why Eureka
Try Eureka