Debugger program time monitor

a time monitor and program technology, applied in the field of data processing, can solve problems such as difficult to track down, inability to provide information, and potential for introducing “bugs”

Inactive Publication Date: 2005-02-08
IBM CORP
View PDF7 Cites 51 Cited by
  • Summary
  • Abstract
  • Description
  • Claims
  • Application Information

AI Technical Summary

Benefits of technology

[0010]Apparatus, methods and articles of manufacture are provided for collecting performance data in a debugger environment. In one embodiment, a method of categorizing performance data in a debugging environment, comprises: executing a computer program during a debugging session; collecting performance data during the debugging session; and categorizing the performance data with debugger information. In another embodiment, the forgoing method is implemented as a program on a computer readable medium.
[0011]Illustratively, at least three modes of categorizing the performance data with debugger information are provided. A first mode comprises associating the performance data with breakpoint information for at least one execution path having an execution path origination point and a program termination point at a breakpoint. A second

Problems solved by technology

Inherent in any software development technique is the potential for introducing “bugs”.
A bug will typically cause unexpected results during the execution of the program.
Threads present timing problems that

Method used


Image

  • Debugger program time monitor
  • Debugger program time monitor
  • Debugger program time monitor

Examples


Embodiment Construction

class="d_n">[0018]FIG. 5 is a performance class list.

[0019]FIG. 6 is a monitor event list.

[0020]FIG. 7 is a flow chart illustrating the operation of a user interface.

[0021]FIG. 8 is a flow chart illustrating the operation of a performance monitor.

[0022]FIG. 9 is a flow chart illustrating the operation of a debug hook.

[0023]FIG. 10 is a flow chart illustrating the operation of a user interface.

DETAILED DESCRIPTION OF THE PREFERRED EMBODIMENTS

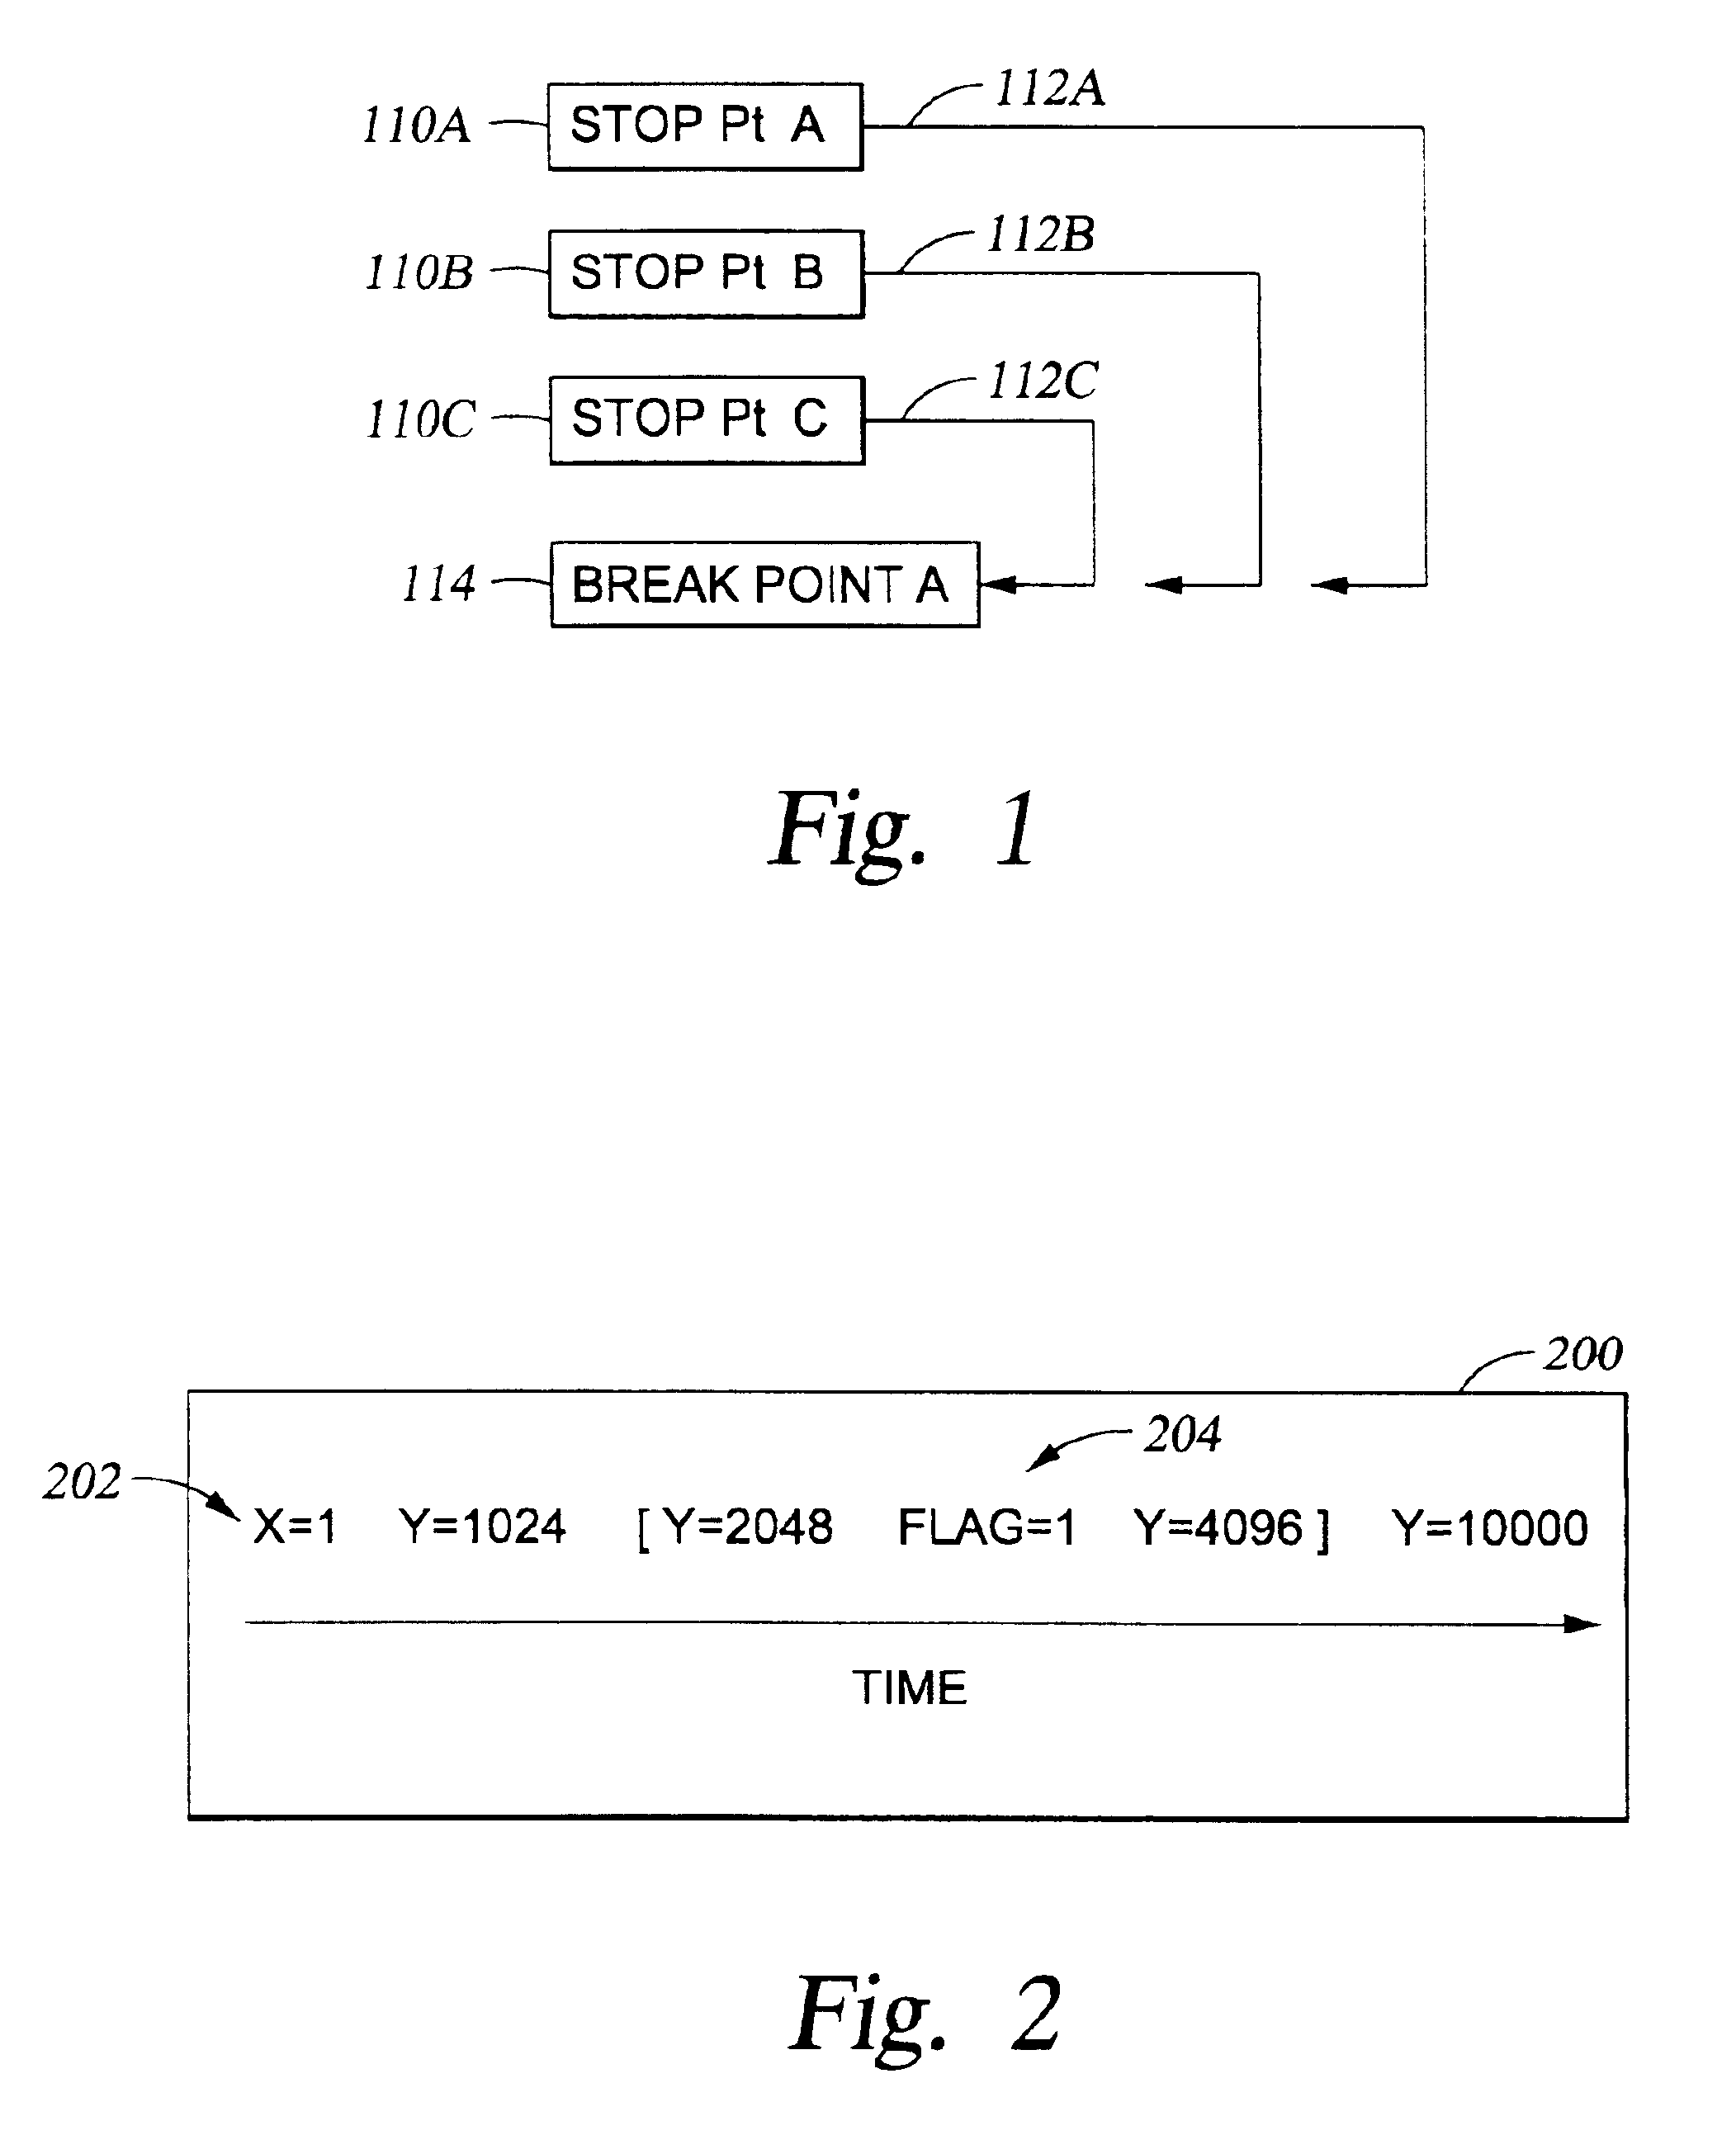
[0024]Apparatus, methods and articles of manufacture are provided for collecting performance data in a debugger environment. Performance data includes any data associated with the execution of a program, as in known in the art. For example, performance data includes histograms showing functions, sub-functions and lines of code. In general, the performance data is categorized with debugger information in at least one of various modes. Some embodiments may be understood with brief reference to FIG. 1. FIG. 1 shows a plurality of stop points 110A-C ...


PUM


Abstract

Apparatus, methods and articles of manufacture for collecting performance data in a debugger environment. In one embodiment, performance data is collected and associated with a breakpoint. The performance data may then be displayed to a user in a meaningful way. In one embodiment, a user is provided with performance data for the last execution path resulting in terminating at a breakpoint, regardless of an origination point of the execution path. In another embodiment, a user is provided with the collective performance data for any execution path terminating at a breakpoint. In still another embodiment, a user is provided with a historical account for a particular execution path using cumulative data for that path. Still another embodiment provides a debugger configured to track performance data based on variable values.

Description

BACKGROUND OF THE INVENTION[0002]1. Field of the Invention[0003]The present invention generally relates to data processing. More particularly, embodiments are provided for organizing performance data collected for a program being debugged.[0004]2. Description of the Related Art[0005]Inherent in any software development technique is the potential for introducing “bugs”. A bug will typically cause unexpected results during the execution of the program. Locating, analyzing, and correcting bugs in a computer program is a process known as “debugging.” Debugging of programs may be done either manually or interactively by a debugging system mediated by a computer system. Manual debugging of a program requires a programmer to manually trace the logic flow of the program and the contents of memory elements, e.g., registers and variables. In the interactive debugging of programs, the program is executed under the control of a monitor program (known as a “debugger”). The debugger may be locate...

Claims


Application Information

Patent Timeline
IPC IPC(8): G06F11/36G06F11/34
CPCG06F11/3636
Inventor BATES, CARY LEEGERARD, SCOTT N.SANTOSUOSSO, JOHN MATTHEW
Owner IBM CORP
Why Eureka
Try Eureka