System and method for estimating tones in an input signal

a technology of input signal and system, applied in the field of signal analysis, can solve the problems of affecting the negative frequency image of the tones may distort or and one or more of the positive frequency images of the tones may also possibly disturb the observation of the positive frequency image of the tones of interest, so as to achieve the effect of improving the estimation

Active Publication Date: 2005-11-15
NATIONAL INSTRUMENTS
View PDF14 Cites 11 Cited by
  • Summary
  • Abstract
  • Description
  • Claims
  • Application Information

AI Technical Summary

Benefits of technology

[0009](4) The processor may correct the transform array values in the neighborhood of each peak frequency location by subtracting the effect of any interacting positive and / or negative frequency images due to other tones or the self-interaction due to the negative frequency image of the same tone. The positive and negative frequency images of the interacting (i.e. aliasing) tones are approximated using the initial frequency, amplitude and phase estimates computed in (3) above. The difference values resulting from the transform corrections comprise a better approximation to the positive frequency image for each tone.
[0016]After correcting the transform array values, the processor may recomputed the tone frequencies, amplitudes and phases based on the corrected transform array values. Because the corrected transform array values more closely approximate the positive frequency images that the original transform array values, the recomputed parameter estimates may be more accurate.

Problems solved by technology

The negative frequency images of the tones may distort or disturb observations of the positive frequency images of the tones of interest.
Furthermore, one or more of the positive frequency images of the tones may also possibly disturb observations of the positive frequency images of the tones of interest.(2) The processor may identify locations of one or more magnitude peaks in the transform array.

Method used


Image

  • System and method for estimating tones in an input signal
  • System and method for estimating tones in an input signal
  • System and method for estimating tones in an input signal

Examples


Embodiment Construction

FIG. 1A

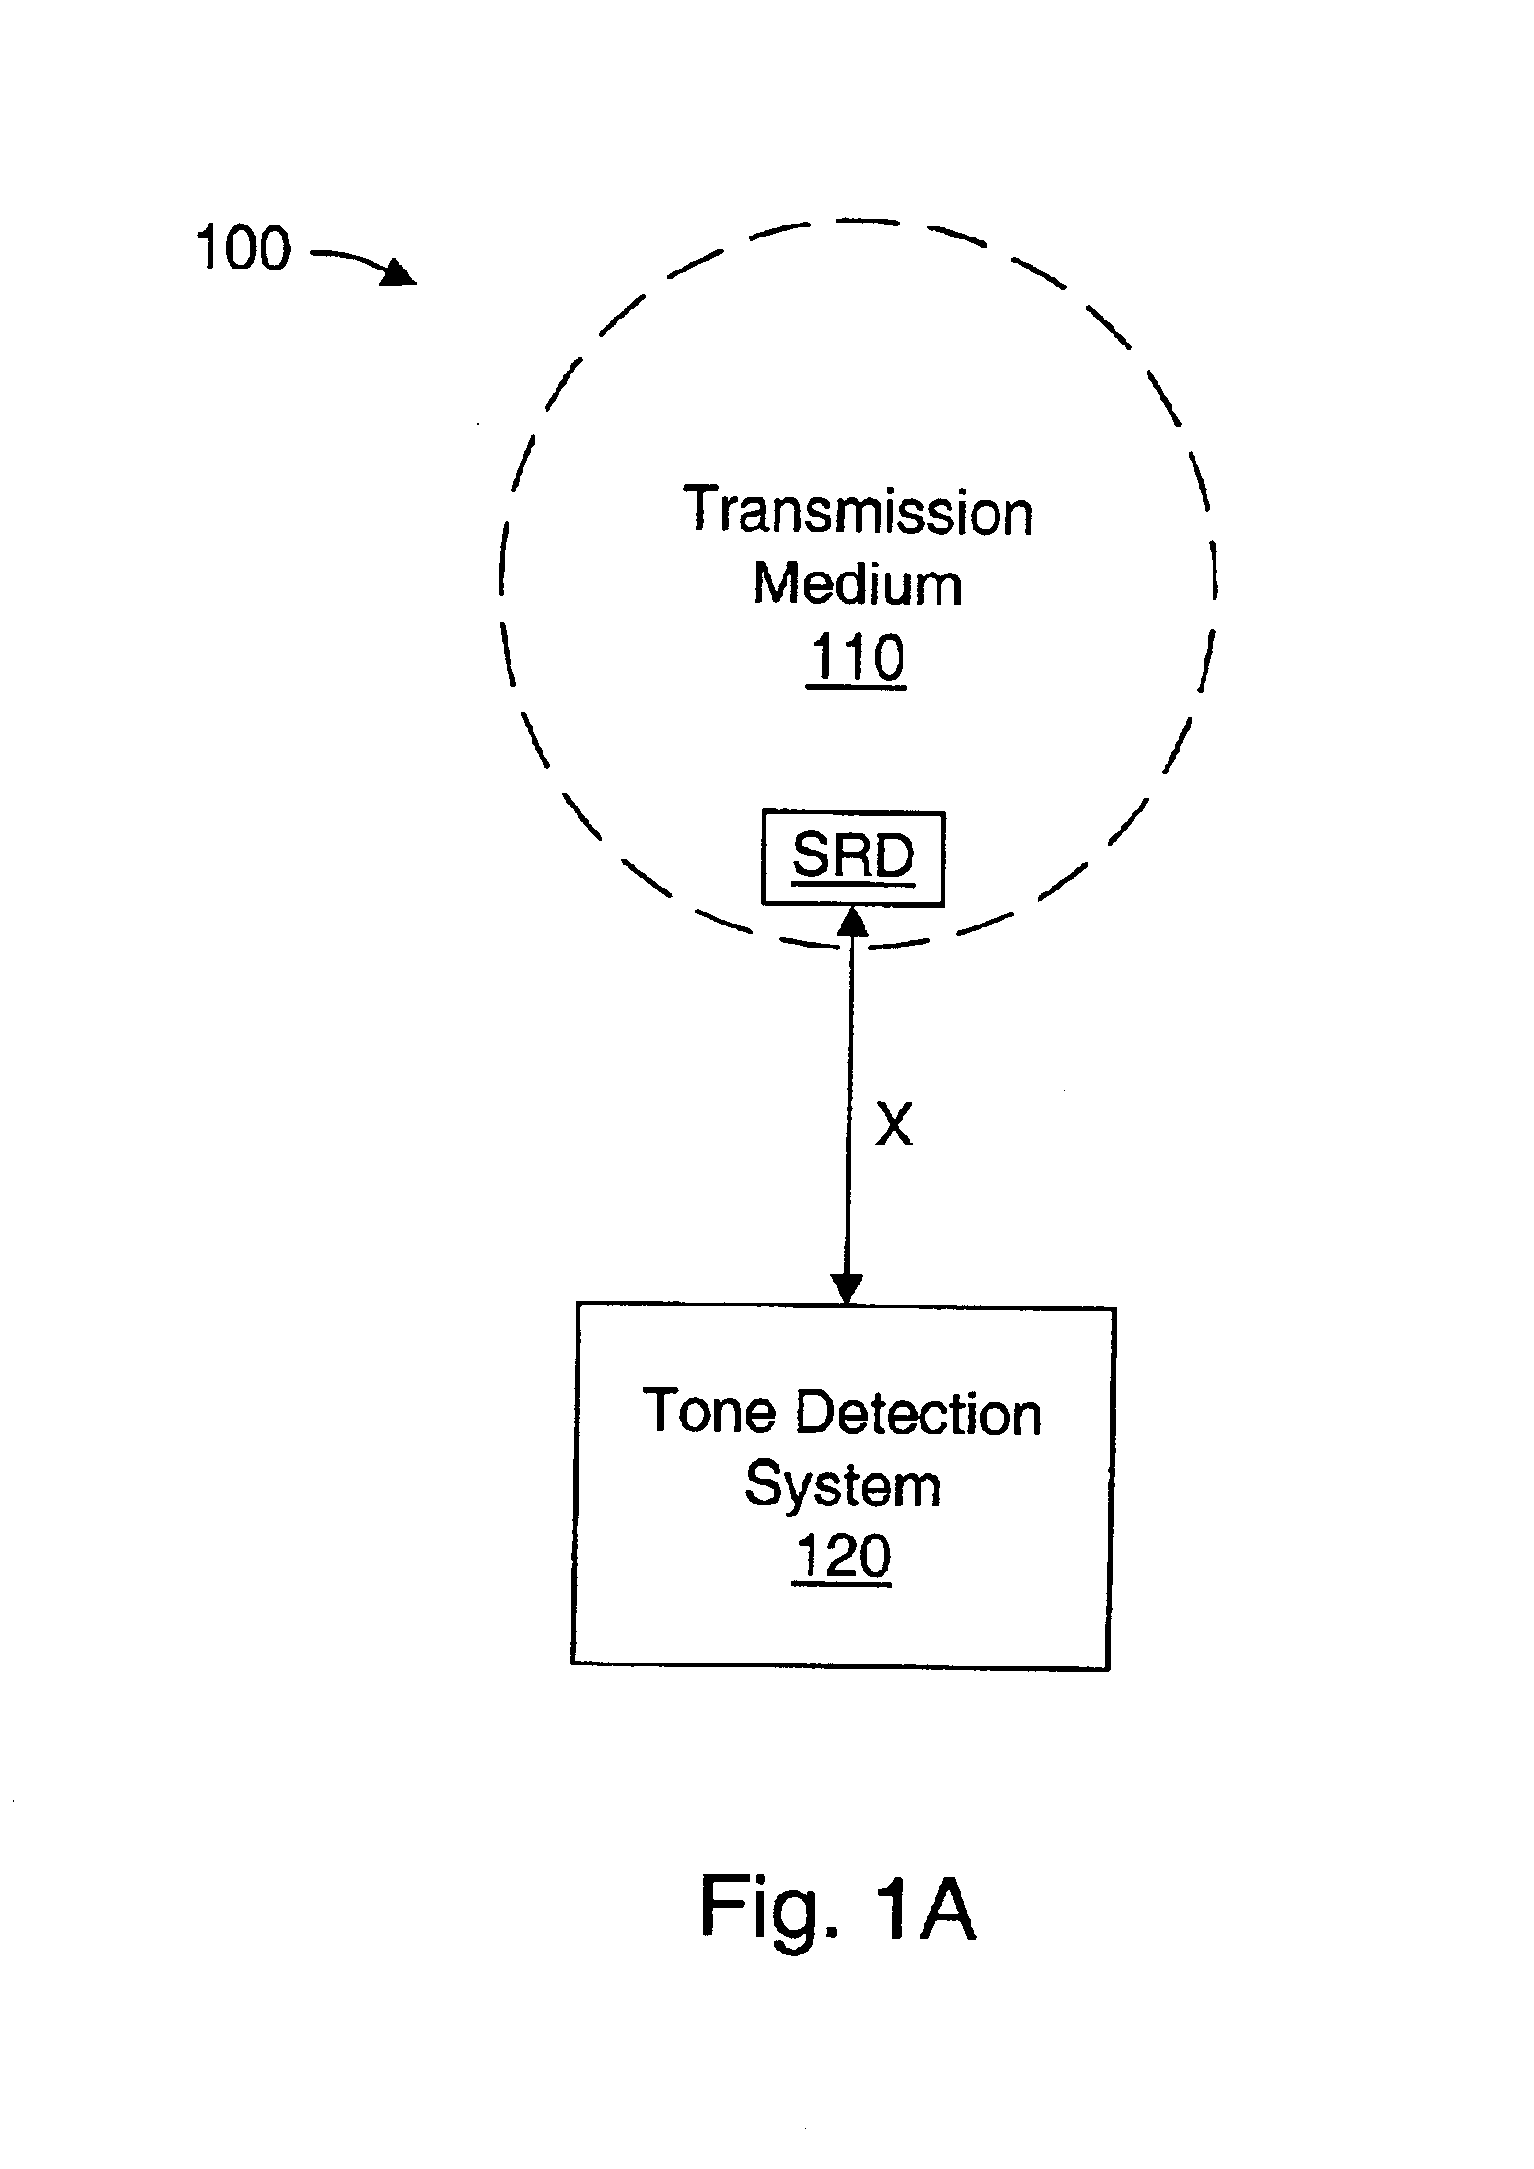
[0036]FIG. 1A illustrates a system configuration 100 for performing signal processing on a signal comprising one or more tones. System configuration 100 may comprise a signal reception device SRD and a tone detection system 120. The SRD may coupled to receive a signal from a device, unit under test (UUT) or a transmission medium 110, or any other system capable of transmitting a signal that may contain tones. The term “transmission medium” is used herein to refer generally to a device, unit under test (UUT) or a transmission medium 110 that may generate a signal including one or more tones. As used herein, the term “tone” includes a signal at a frequency, e.g., at a primary or single frequency, which may be contained within another signal.

[0037]As shown in FIG. 1A, SRD may be coupled to a transmission medium 110. Transmission medium 110 may represent any of a variety of transmission media such as the atmosphere, free space, an optical fiber or fiber bundle, a communication bu...


PUM


Abstract

A system and method for analyzing an input signal comprising one or more sinusoidal tones. A processor of the system receives samples of an input signal and operates on the samples to generate a transform array. The processor identifies positive frequency peaks of the transform array, and estimates a set of signal parameters (e.g. tone frequency and complex amplitude) for each of the positive frequency peaks. Each tone is represented in the transform array as a positive frequency image and a corresponding negative frequency image. Using the parameter sets, the processor may estimate the amount of cross-interaction between the images, i.e., may compute the amounts by which each positive frequency peak is effected by the negative frequency images and other positive frequency images. These amounts may be subtracted from each positive frequency peak to generate improved peak values. The processor may use the improved peak values to compute improved estimates for the signal parameters. The operations of (a) estimating the cross-interaction amounts based on current parameter estimates for the multiple tones, (b) subtracting the cross-interaction amounts from the current peak values to generate improved peak values for each tone, and (c) computing improved parameter estimates for the multiple tones from the improved peak values may be repeated a predefined number of time or until a termination criteria is achieved.

Description

FIELD OF THE INVENTION[0001]The invention relates generally to the field of signal analysis, and more particularly, to a system and method for detecting the frequency, amplitude and / or phase of one or more tones comprised within an input signal.DESCRIPTION OF THE RELATED ART[0002]The discrete Fourier transform (DFT) is a popular tool for analyzing signals. However, before an input signal is transformed, it is quite often windowed with a windowing function. (It is noted that the action of capturing of a finite-length sequence of samples of the input signal automatically implies a rectangular windowing.) The transform Y of the windowed input signal will typically exhibit multiple scaled and shifted versions of transform function W, i.e., the transform of the window function. Each sinusoidal component of the input signal expresses itself as a pair of such shifted versions, one version shifted up to the frequency fj of the sinusoidal component, and the other shifted down to frequency −f...

Claims


Application Information

Patent Timeline
Patent Type & Authority Patents(United States)
IPC IPC(8): G06F17/14
CPCG06F17/141
Inventor MORIAT, ALAIN
Owner NATIONAL INSTRUMENTS
Why Eureka
Try Eureka