
Measuring linear separations in digital radiographs

a digital radiograph and linear separation technology, applied in the field of digital radiography, can solve the problems of difficult to distinguish closely adjacent features of high brightness, and difficult to accurately measure the separation between objects

Active Publication Date: 2007-08-21
LEIDOS
View PDF3 Cites 35 Cited by
  • Summary
  • Abstract
  • Description
  • Claims
  • Application Information

AI Technical Summary

Benefits of technology

The present invention addresses the problem of measuring linear distances in digital radiographs with high precision. It involves obtaining data from imaging objects and creating a reference profile to account for the point spread function of the imager. The difference between the data profile and the reference profile is calculated, and the degree by which the actual condition of the objects varies from the reference condition is determined. This invention provides a method for increasing measurement precision in digital radiography.

Problems solved by technology

Digital radiographic imaging of certain objects presents numerous challenges.
For example, when imaging adjacent objects that have significant differences in density, it is often difficult to accurately measure the separation between the objects when that separation is of the same order of magnitude as the pixel pitch of the imager.
The human eye has difficulty distinguishing closely adjacent features of highly differing brightness.

Method used


Image

  • Measuring linear separations in digital radiographs
  • Measuring linear separations in digital radiographs
  • Measuring linear separations in digital radiographs

Examples


Embodiment Construction

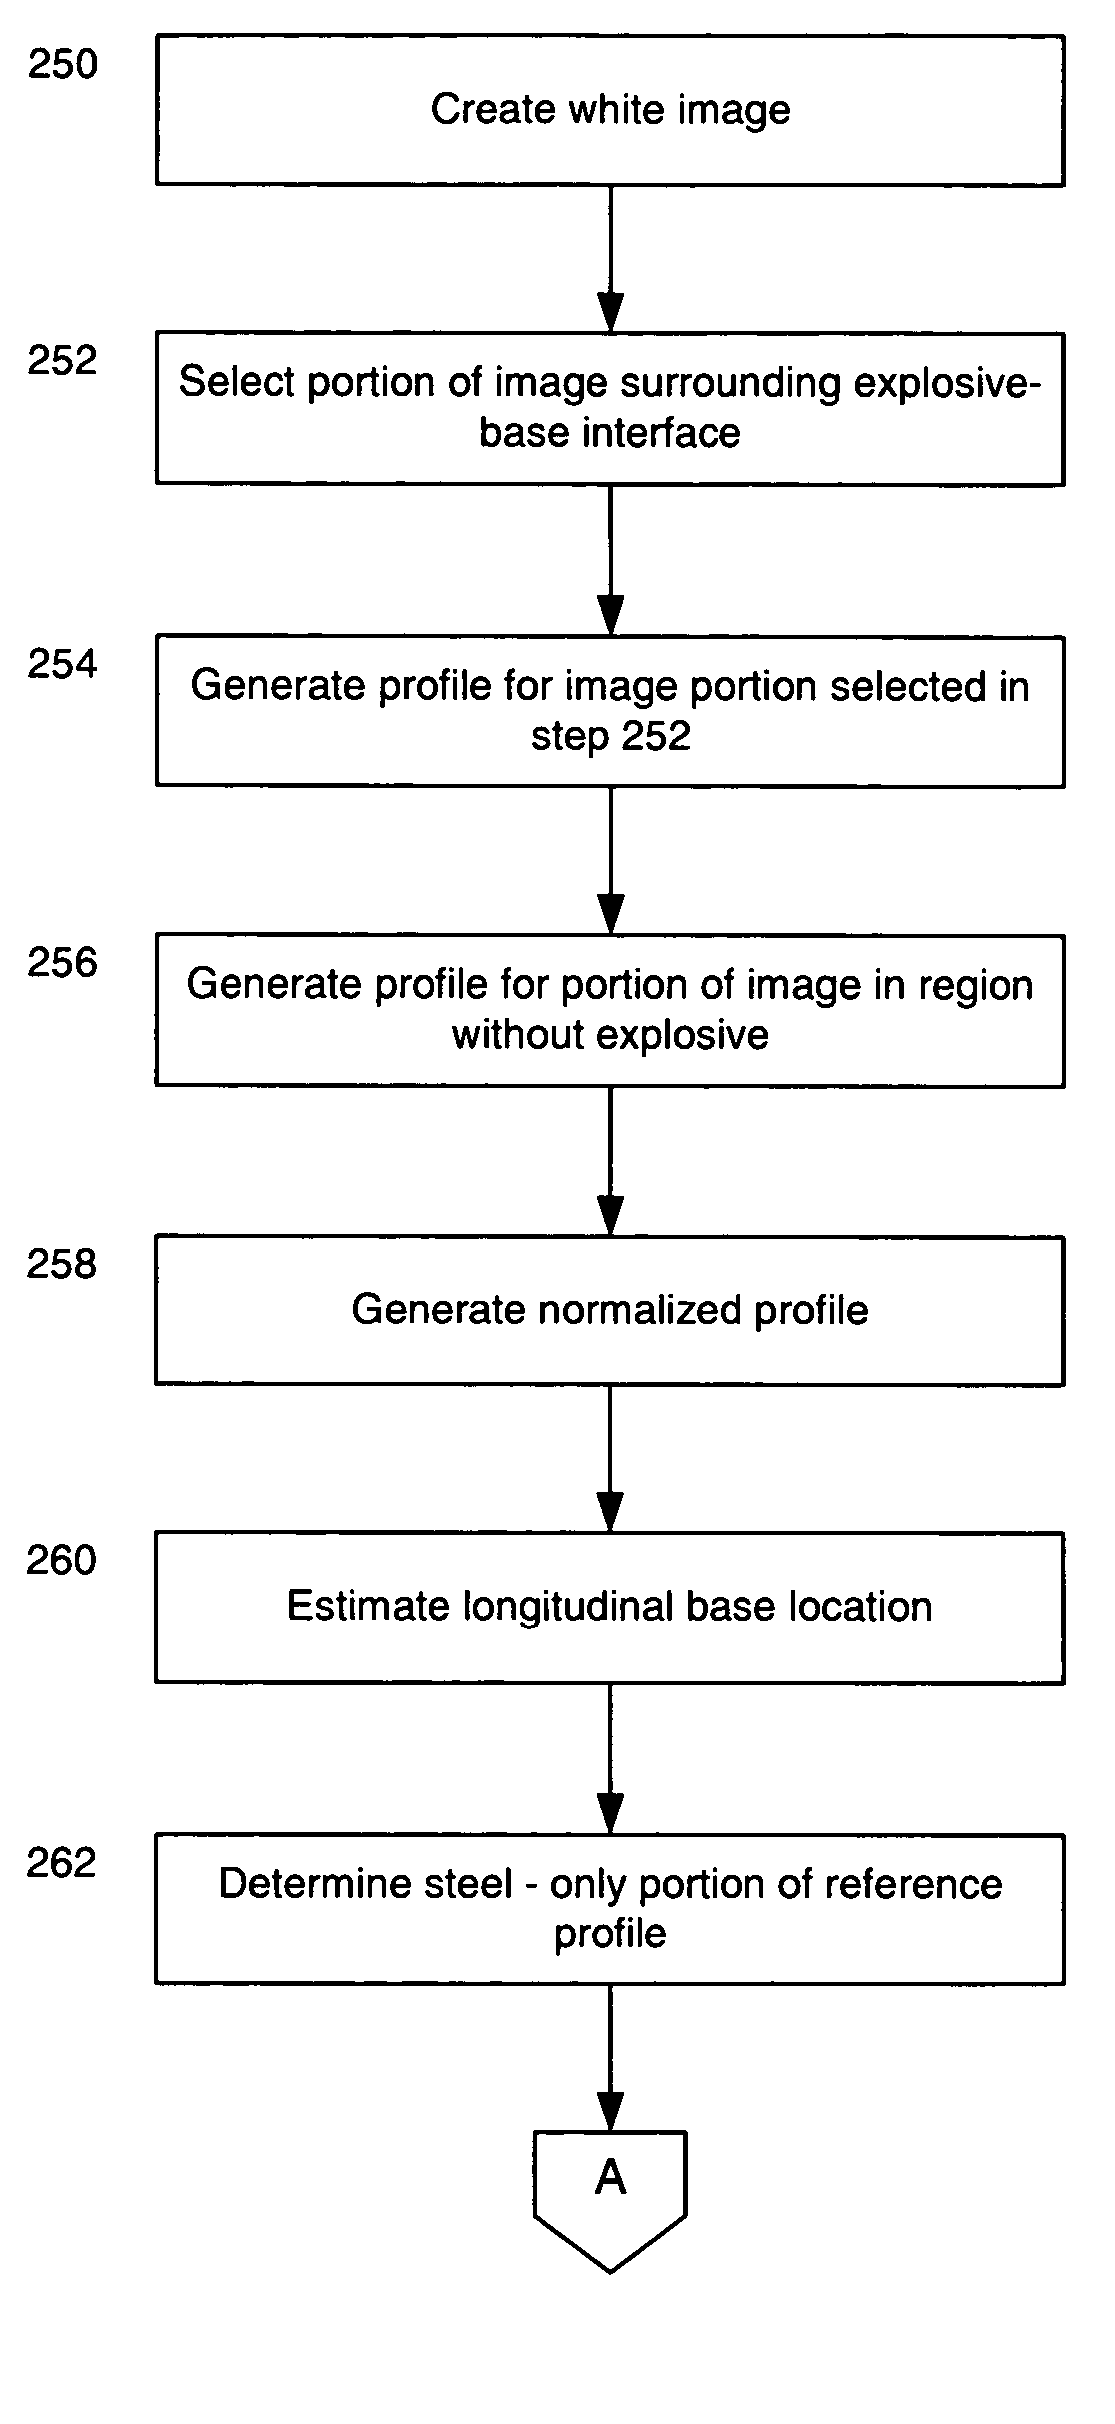
[0038]As used herein, “image” refers to a visual display of an object (or objects) created by illuminating the object(s) with energy and detecting passage of that energy through the object(s). “Image data” refers to the underlying data quantifying the amount of energy passing through a particular portion of the imaged object(s). Image data for multiple portions of the object(s) may be aggregated and otherwise processed to generate an image. In some embodiments, image data represents digitized values of energy intensity detected by individual pixels of a detection array. A data “profile” is an ordered set of data corresponding to a region of an object or objects. In some cases, a profile may be a set of actual data collected during imaging. In other cases, a profile may be a set of actual image data after averaging, normalization and / or other processing. In still other cases, a profile may be an expected set of data for a particular condition of the object(s).

[0039]Embodiments of the...


PUM


Abstract

Digital pixel data is obtained from radiographic imaging of one or more objects, and corresponds to an imaged area containing a feature to be measured. A data profile for a region around the measured feature is created from the digital pixel data. A reference profile is then created from the data profile. The reference profile represents an expected data profile for a reference condition of the objects, and accounts for the point spread function of the imager. The difference between the data profile and the reference profile is calculated. Based on that difference, the degree by which the actual condition of the objects varies from the reference condition is determined. The calculated difference can be compared to a lookup table mapping previously calculated differences to degrees of variation from the reference condition. The calculated difference can also be used as an input to an experimentally derived formula.

Description

CROSS-REFERENCE TO RELATED APPLICATIONS[0001]This application claims the benefit of U.S. Provisional Application Ser. No. 60 / 531,660 , filed Dec. 23, 2003, titled “A Measurement Methodology to Determine Linear Separations Between Objects of Strongly Differing Densities in Digital Radiographs,” hereby incorporated herein by reference.STATEMENT REGARDING FEDERALLY SPONSORED RESEARCH OR DEVELOPMENT[0002]The U.S. Government has a paid-up license in this invention and the right in limited circumstances to require the patent owner to license others on reasonable terms as provided for by the terms of contract number DAAE30-96-C-0013 awarded by the United States Army.FIELD OF THE INVENTION[0003]This invention relates to digital radiography. More specifically, the invention relates to methods for determining a separation between adjacent materials having a substantial difference in densities after those materials have been imaged in a digital radiograph.BACKGROUND OF THE INVENTION[0004]Radio...

Claims


Application Information

Patent Timeline
Patent Type & Authority Patents(United States)
IPC IPC(8): G06K9/00G01V5/00G06K9/36
CPCG01V5/0008G01V5/20
Inventor POLICHAR, RAULF M.RUSH, GARY M.SMITH, SCOTT T.
Owner LEIDOS
Learn More