Method of graphical presentation of relationships between individuals, business entities, and organizations

a business entity and relationship technology, applied in the field of graphical presentation of relationships between individuals, business entities, and organizations, can solve the problems of not being able to visualize without prior knowledge of any of these relationships, and achieve the effects of facilitating the comprehension of content, faster grasping of content, and utilizing the viewer's time more efficiently

Active Publication Date: 2008-05-27
INTELLECTSPACE
View PDF14 Cites 54 Cited by
  • Summary
  • Abstract
  • Description
  • Claims
  • Application Information

AI Technical Summary

Benefits of technology

[0009]My method of graphically presenting various relationships with business significance between individuals, companies, financial or business entities, and organizations is superior because the presentation is graphical rather than textual, thus easier for a reader to comprehend the content, therefore using the viewer's time more efficiently. Further, all relationships are displayed together. This approach eliminates the need to research multiple sources as well as the need for industry-specific knowledge to decipher convoluted business intelligence text that is often narrowly tailored toward professionals in the field. Also, the presented individuals, companies, entities and other organizations may be symbolized by representative icons to give a viewer a much faster grasp of the content. Some entities may not only be represented via a symbol of an individual, or a company, but will actually have the person's portrait as the graphical portrayal of the person and logo of the company as the graphical representation of the company on the screen. This method also highlights “illogical” and “questionable” relationships in the context of the given and presented data, thus giving the user not only raw data, but clues on possible points of interest.

Problems solved by technology

Although information in this particular example is somewhat simple, it is nonetheless very hard to visualize without prior knowledge of any of these relationships.

Method used


Image

  • Method of graphical presentation of relationships between individuals, business entities, and organizations
  • Method of graphical presentation of relationships between individuals, business entities, and organizations
  • Method of graphical presentation of relationships between individuals, business entities, and organizations

Examples


Embodiment Construction

[0024]In the following detailed description of exemplary embodiments of the invention, reference is made to the accompanying drawings. The detailed description and the drawings illustrate specific exemplary embodiments by which the invention may be practiced. Other embodiments may be utilized, and other changes may be made, without departing from the spirit or scope of the present invention. The following detailed description is therefore not to be taken in a limiting sense, and the scope of the present invention is defined by the stated claims.

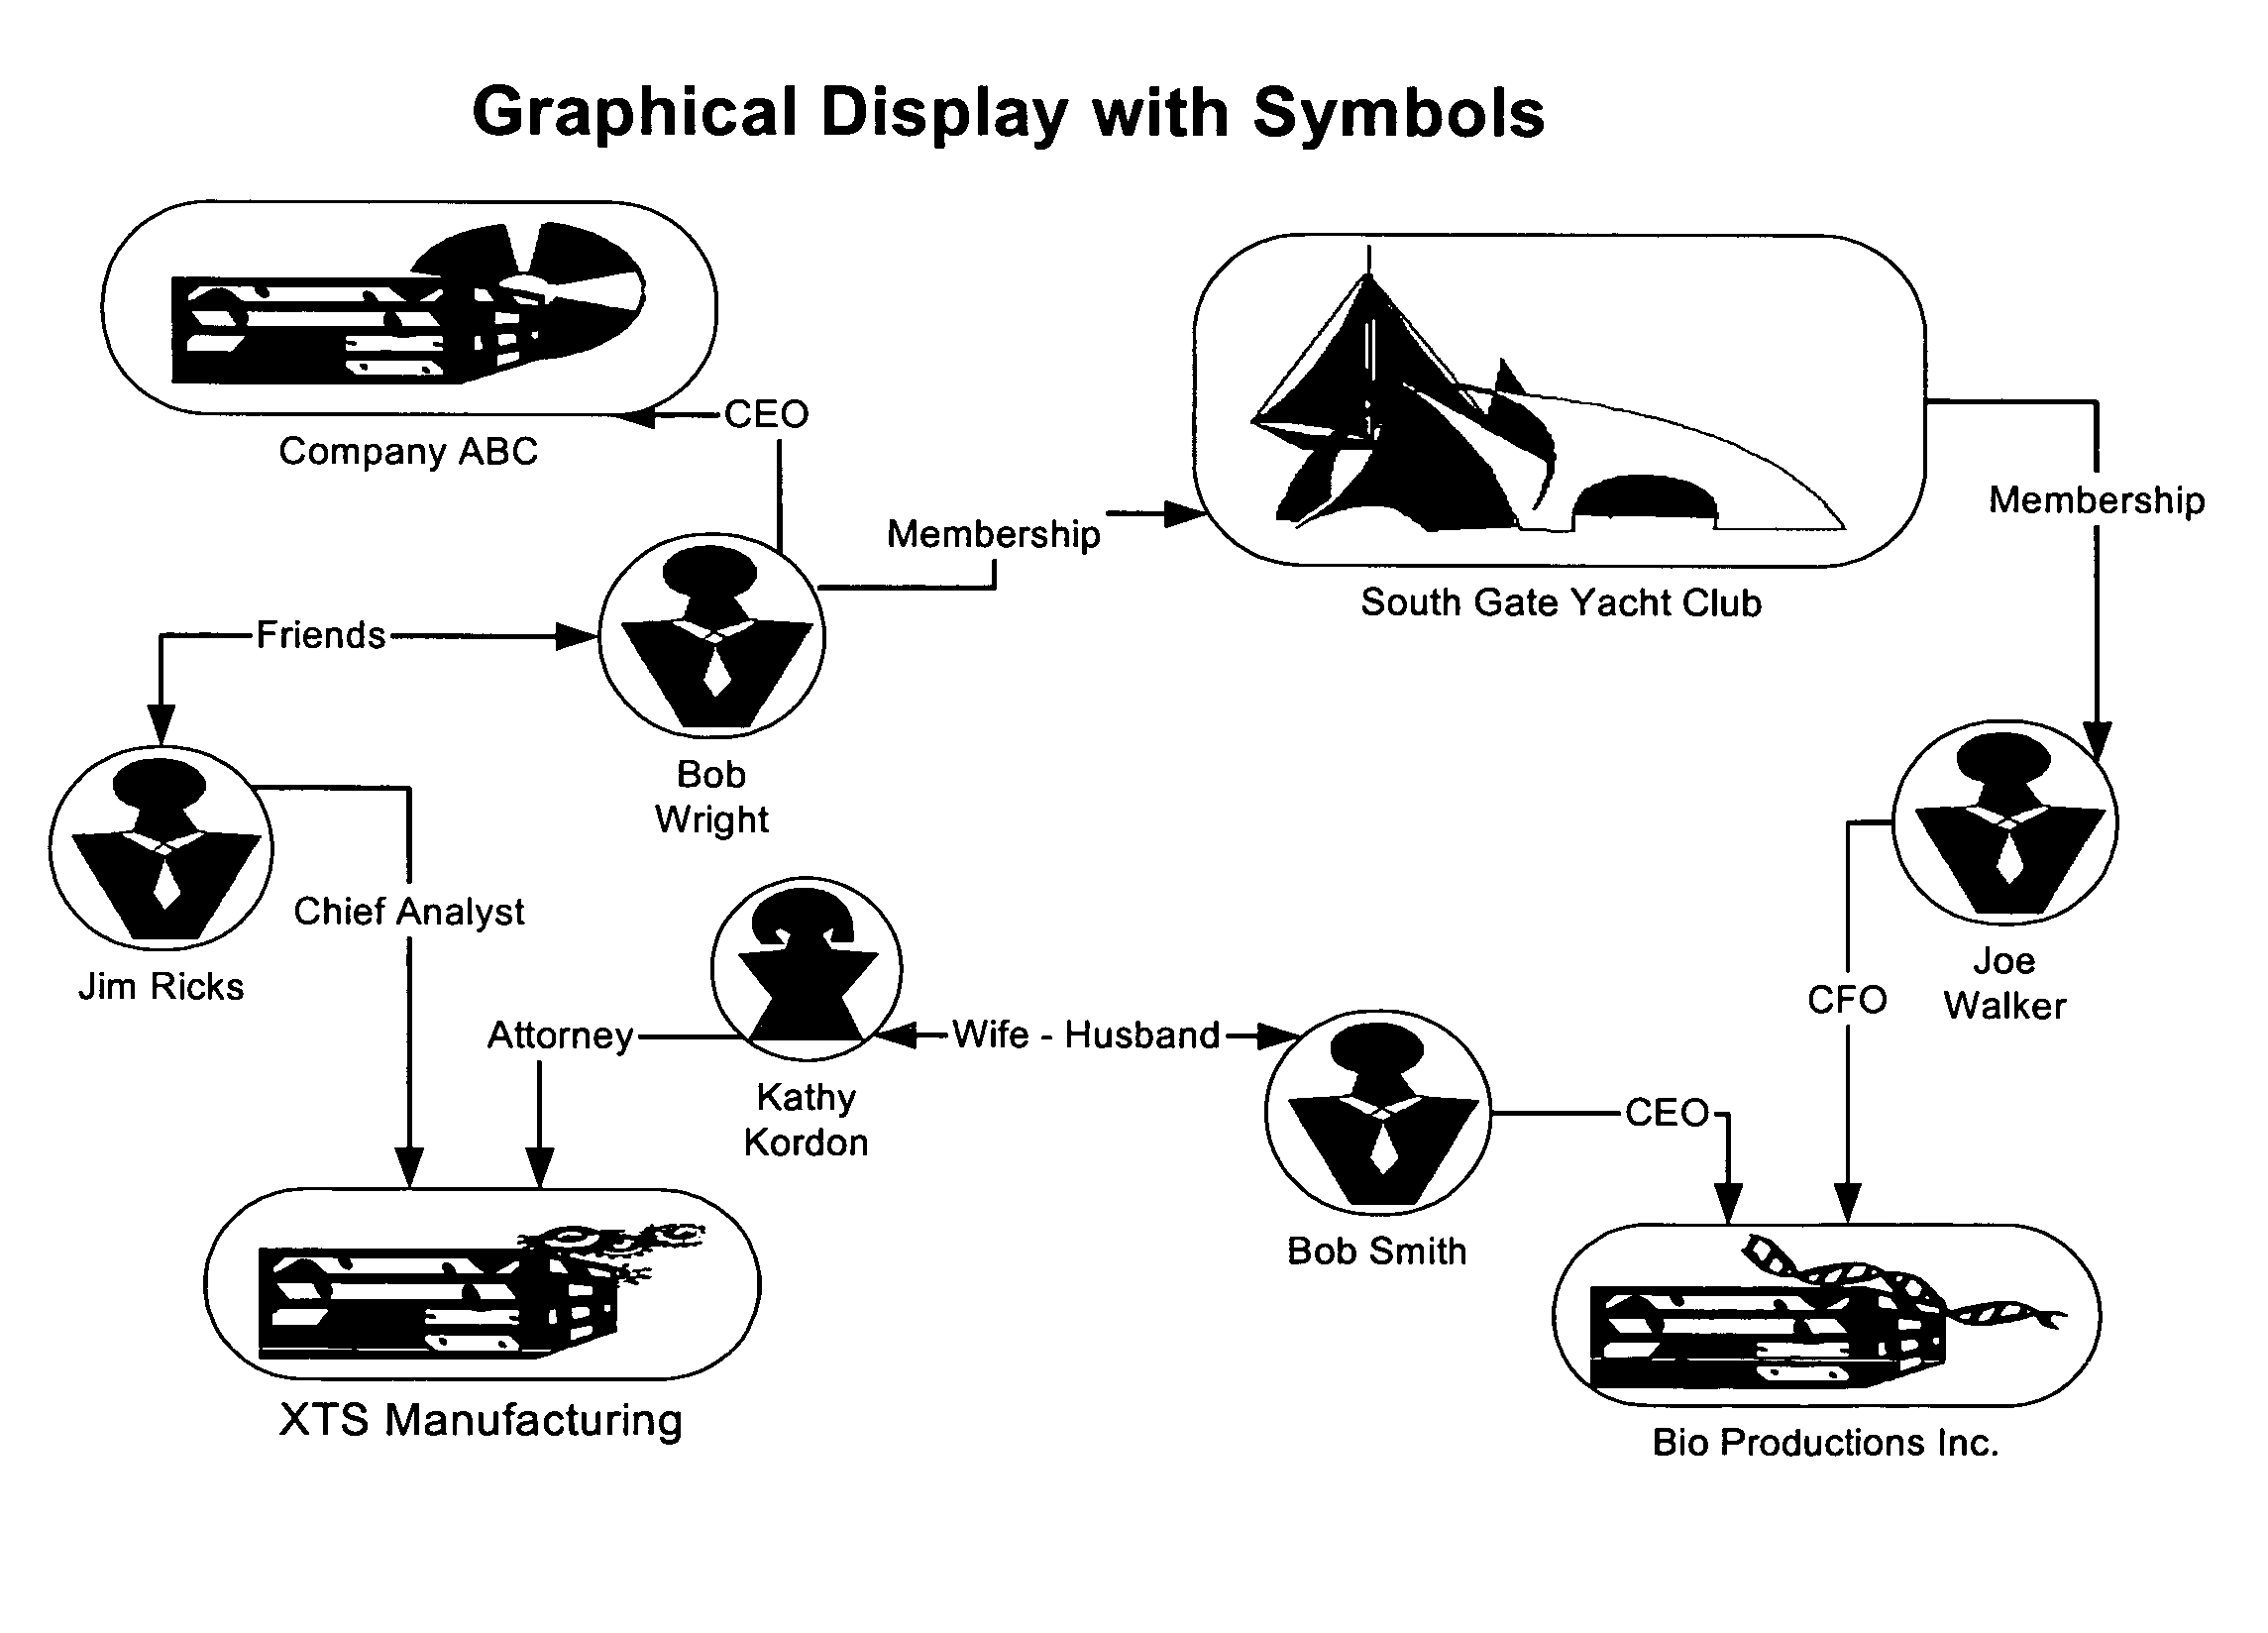
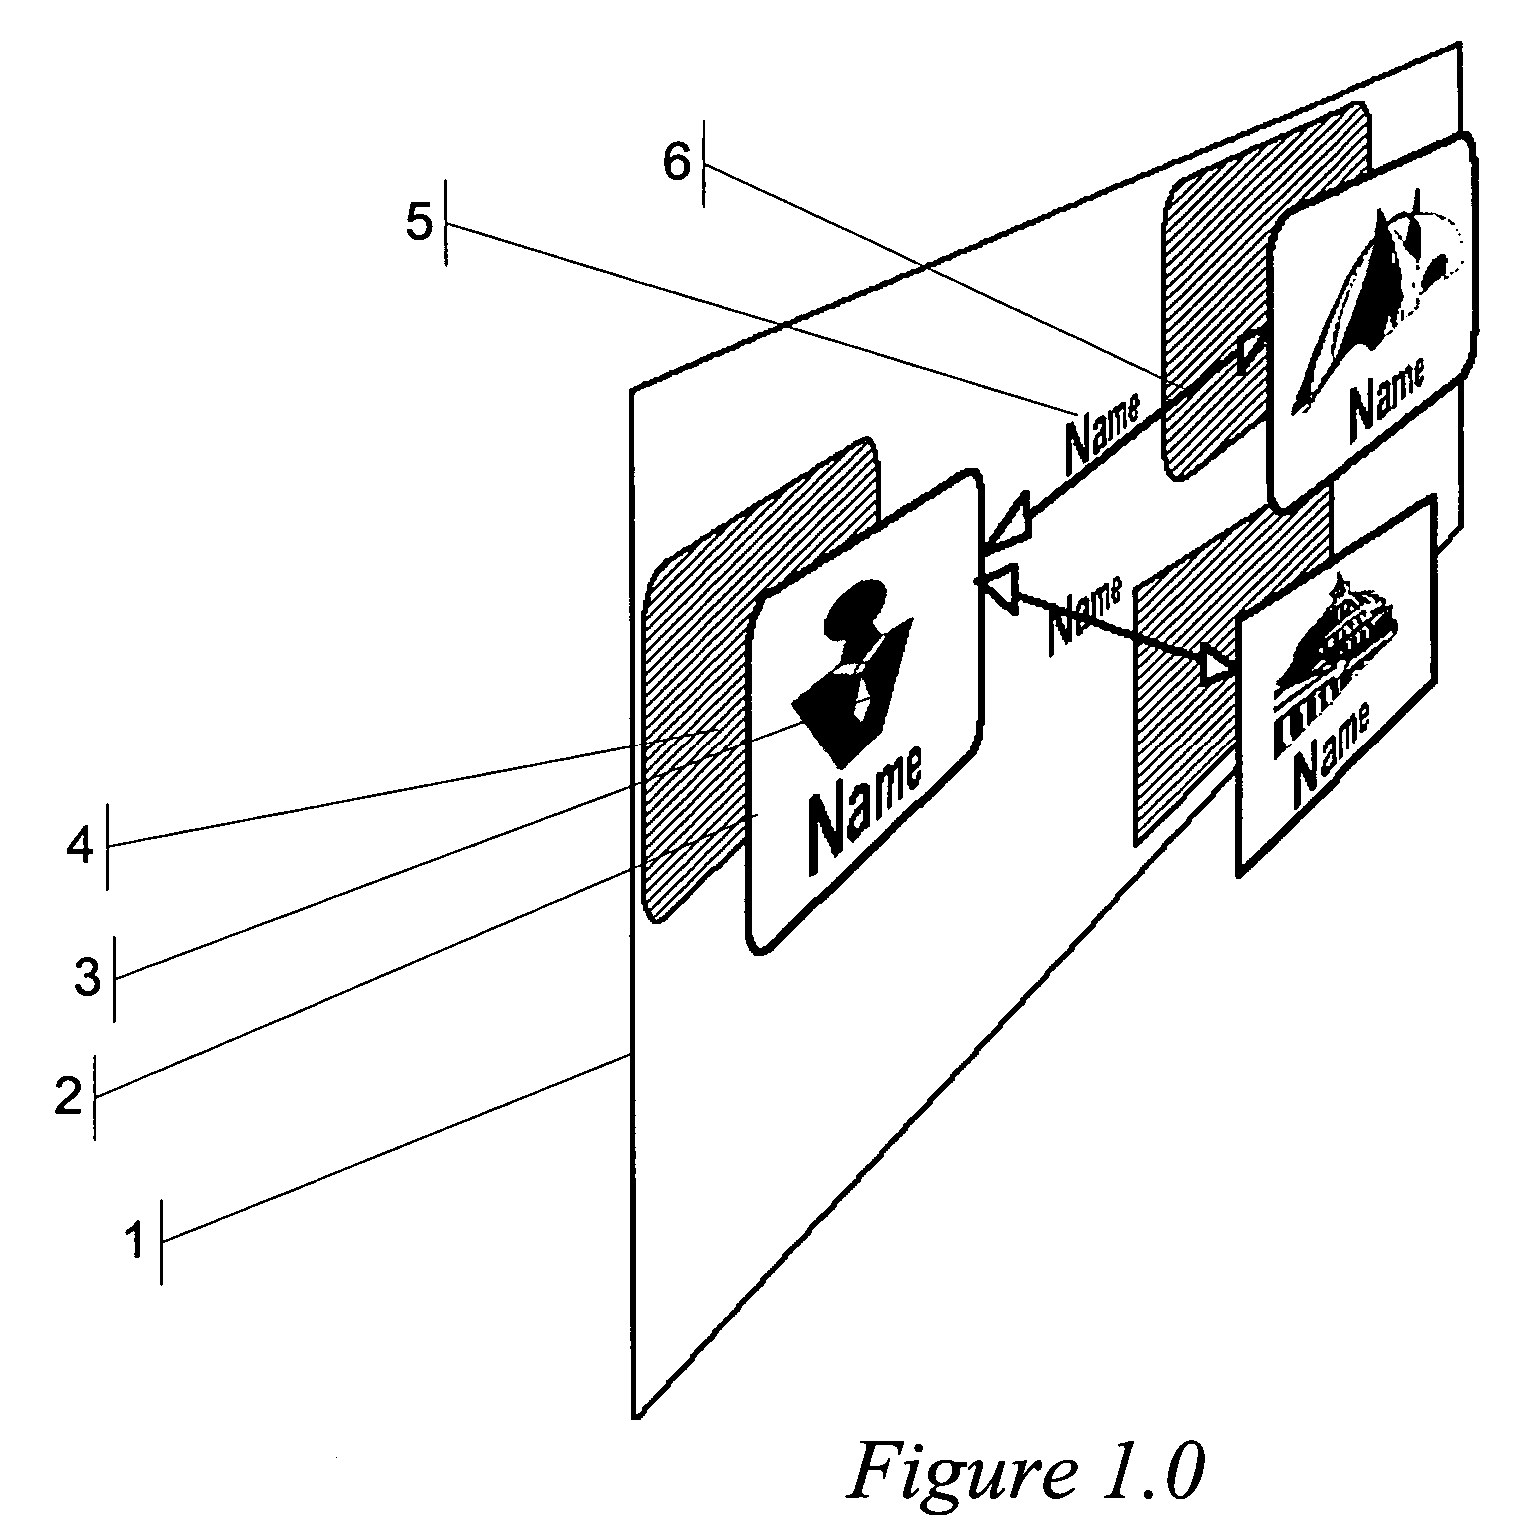
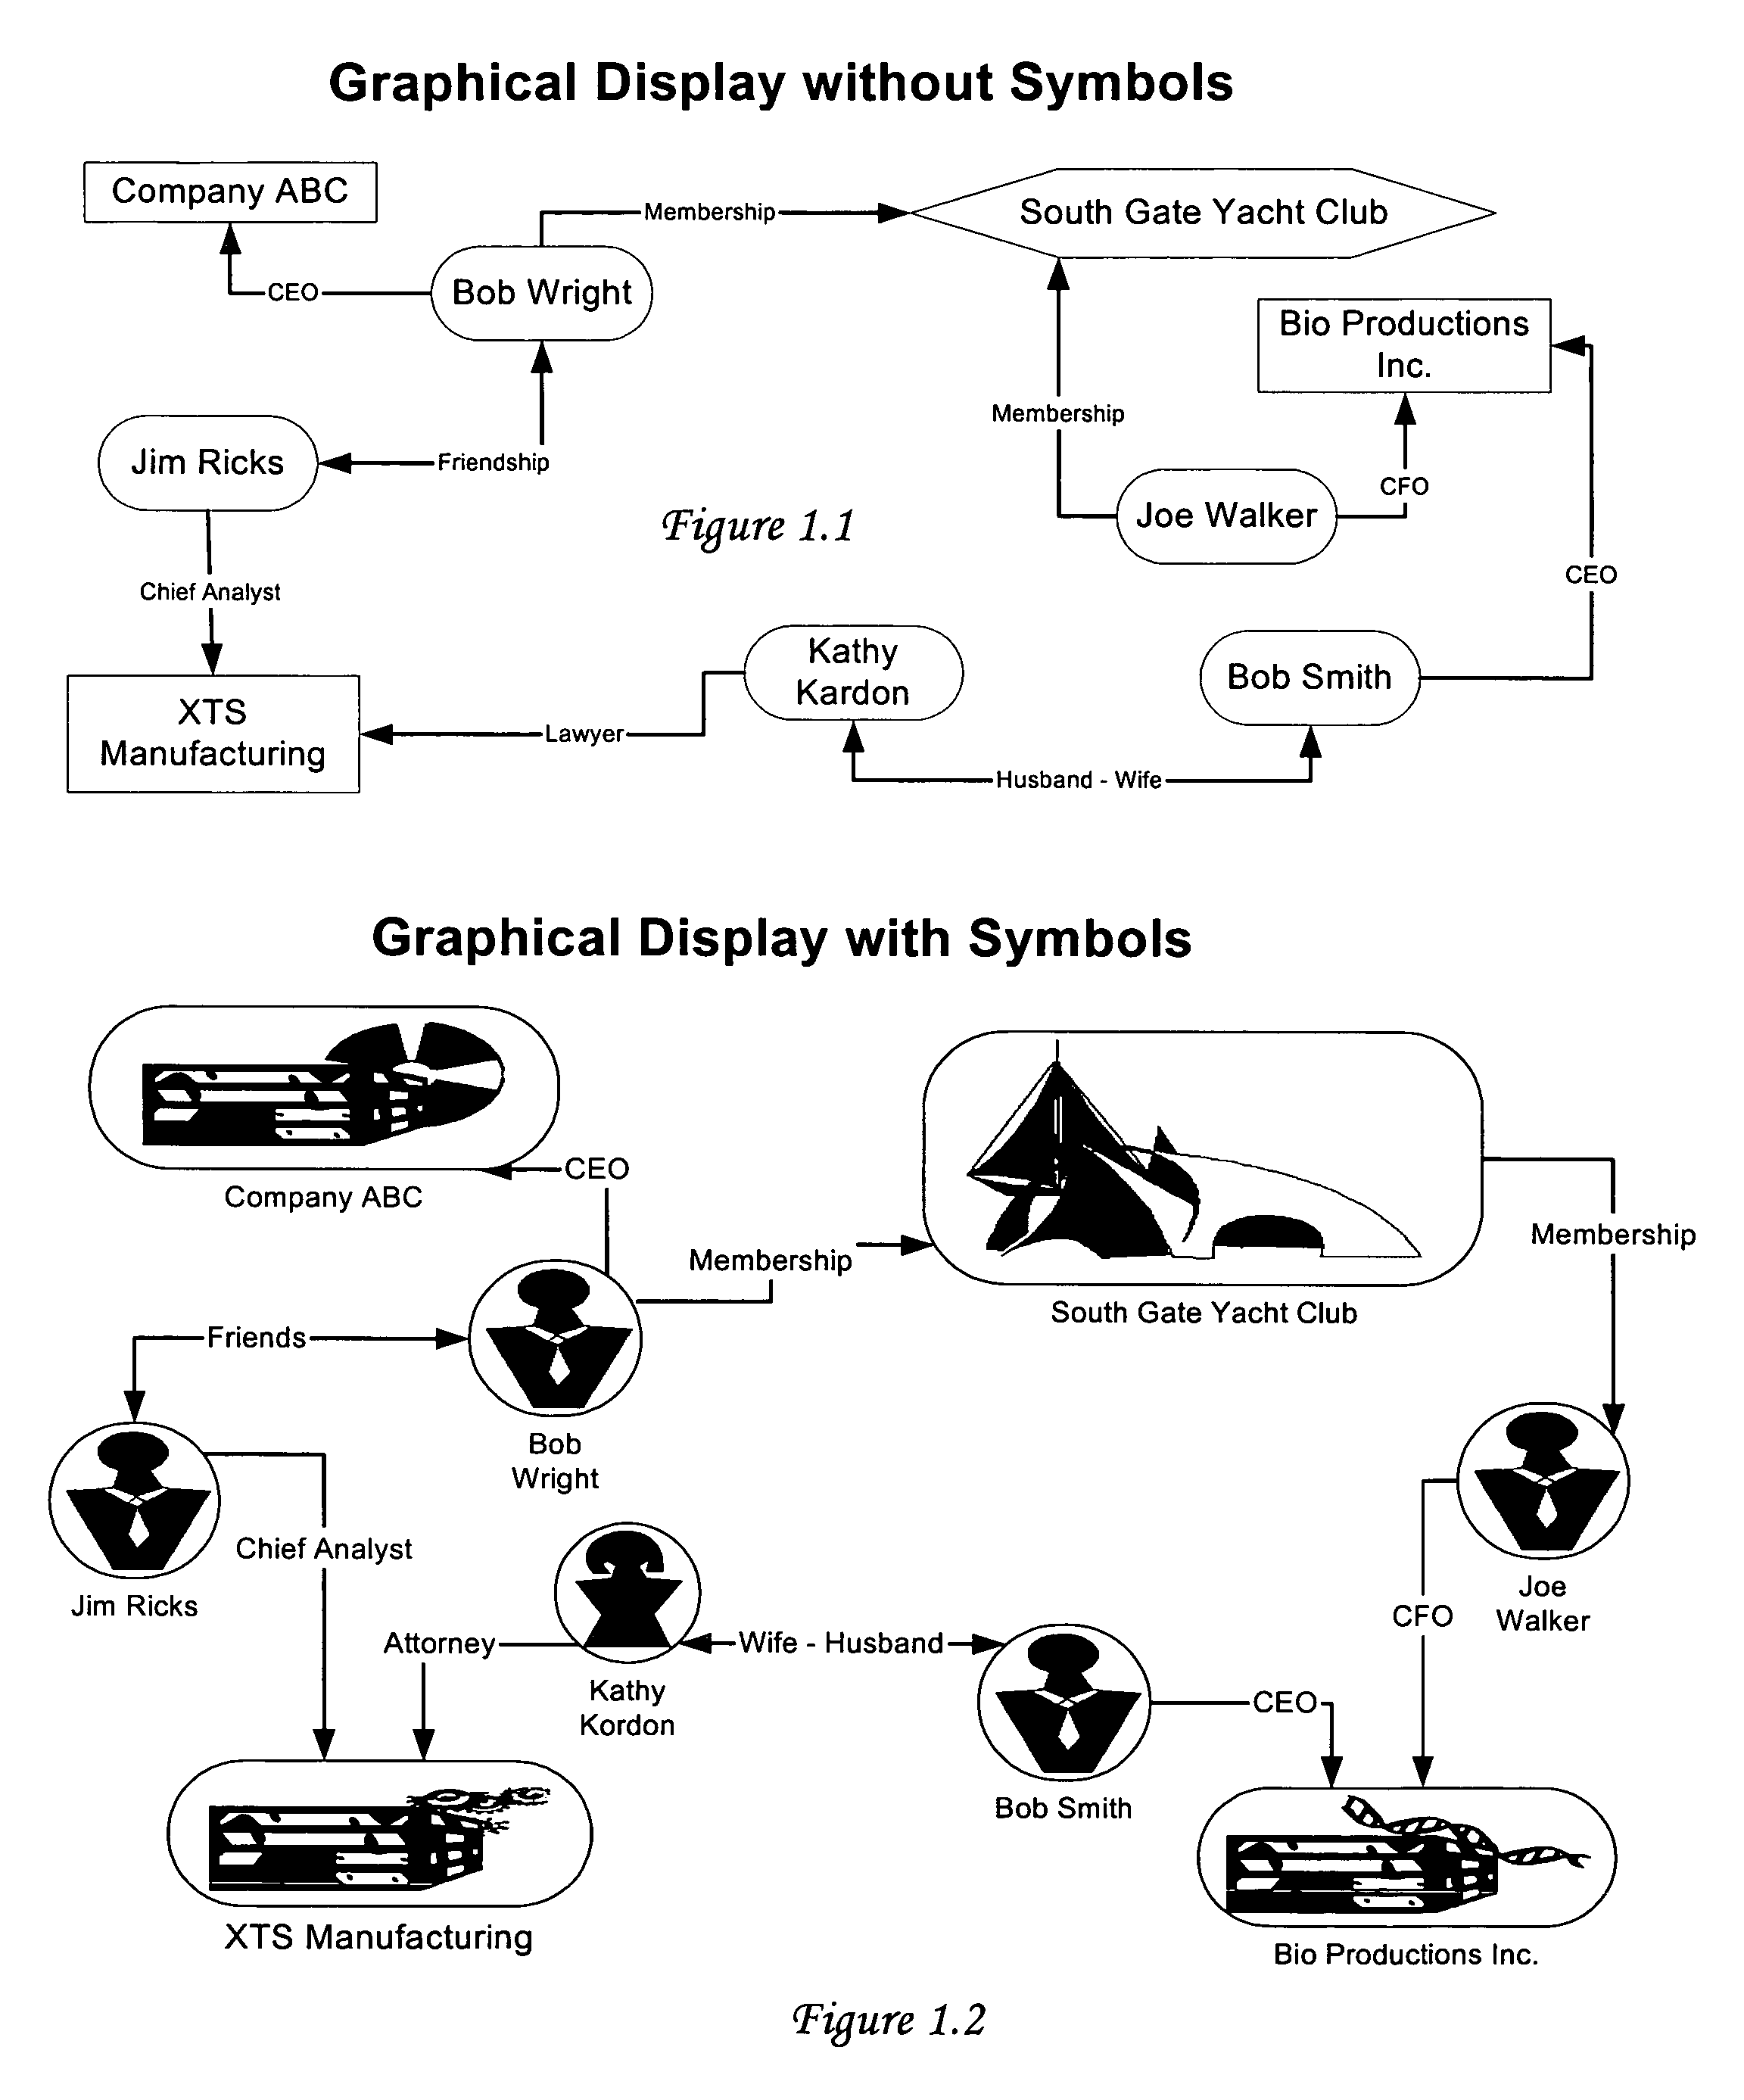
[0025]The FIGS. 2.3-2.12, 3.1-3.7, 4.1-4.17 and 5.1-5.13 exemplify the plurality of relationships that my method uses to graphically portray the interdependencies between individuals, companies, financial or business entities, and organizations. Each figure consists of two variations. The top part displays the relationship without symbolic representation, while the bottom part of the figure uses symbols. These figures are discussed in detail ...


PUM


Abstract

A method of graphical presentation of relationships with business significance between business related entities such as individuals, business entities, and activities of human endeavor. Information retrieved from databases about relationships between business related entities can be more quickly and more clearly understood if the relationships are presented graphically with a symbol for each entity and links connecting the entities where each link specifies the type of relationship, such as employee, owner, shareholder, contractors, etc. When databases are queried about a particular entity, that entity is displayed in a prominent position, such as the center of the display.

Description

FIELD OF INVENTION[0001]I invented a more effective method of presenting information from one or many computer databases about companies' and individuals' involvement in the business marketplace through a graphical presentation of various relationships with business significance between individuals, companies, corporate entities, and other organizations. Examples of such involvement include past or present executive positions, board positions, company suppliers, company customers, and others.BACKGROUND[0002]Every money manager's most valuable asset is information. A critical piece of information has a potential to make or break a deal involving large sums of money. The information that is highly valuable for financial institutions is not raw facts involving a company or an individual of their interest, but rather is an agglomeration of these facts into a relevant representation of a complete picture. Although it is true that an advent of digital medium has made a wealth of informati...

Claims


Application Information

Patent Timeline
Patent Type & Authority Patents(United States)
IPC IPC(8): G06F3/048G06F17/30G06Q10/00G06Q30/00G07G1/00
CPCG06Q10/10
Inventor GVELESIANI, ALEKSANDR L.
Owner INTELLECTSPACE
Why Eureka
Try Eureka