Visual landscape for multi-tiered application environment component interactions

a component interaction and application environment technology, applied in the field of computer systems and software, can solve the problems of inexperienced viewers, many organizations are not prepared to handle the performance load of production systems, and specific product vendors have not delivered real-time global views of internal application server performance, etc., to achieve the effect of monitoring and analyzing application and server data quickly and efficiently

Active Publication Date: 2008-06-03
DYNATRACE
View PDF7 Cites 39 Cited by
  • Summary
  • Abstract
  • Description
  • Claims
  • Application Information

AI Technical Summary

Benefits of technology

[0014]The data agent automatically identifies the high-level components of interest, such as Servets, JSP, and EJB components, as well as detecting key user defined components. Data from the agent application is sent to a data collector (e.g., an Enterprise Performance Data Collector (EPDC)), which stores information for many agents. The data collector also provides access to this information for the visual landscape display. The data collector manages the data, data persistence, data delivery, and authentication of data viewers. The data persistence of collected data can be used for trend analysis, resource consumption analysis over time, and other purposes. The data saved can be configured to include the aggregate SQL statements observed, which can help users rapidly find tuning opportunities in the database tier of their application as well as coding inefficiencies.
[0016]The present invention beneficially includes a system and a method for generating a visual framework of presenting data associated with application server performance in a server-centric application framework in graphical user interface format. Moreover, the present invention graphically illustrates interaction between incoming requests, internal resources and external resources for application components. Hence, a user is able to monitor and analyze application and server data quickly and efficiently without laboring through tables and text having little to no readily apparent meaning.

Problems solved by technology

While SCAF's such as the J2EE specification provide the capabilities for monitoring components at an individual level via Java Management Extensions (JMX), the specification and product vendors have fallen short on delivering real-time global views of internal application server performance.
However, conventional products only deal with data display and / or graphing of individual calls (method calls) and application server resources.
Inexperienced viewers are challenged at interpreting the data.
Moreover, as experienced technical developers focus on product enhancements and business requirements, many organizations are not prepared to handle the performance load of production systems.
Due to the lack of technical programming knowledge, these individuals are ill equipped to solve the performance issues.

Method used


Image

  • Visual landscape for multi-tiered application environment component interactions
  • Visual landscape for multi-tiered application environment component interactions
  • Visual landscape for multi-tiered application environment component interactions

Examples


Embodiment Construction

[0026]The Figures (“FIG.”) and the following description relate to preferred embodiments of the present invention by way of illustration only. It should be noted that from the following discussion, alternative embodiments of the structures and methods disclosed herein will be readily recognized as viable alternatives that may be employed without departing from the principles of the claimed invention.

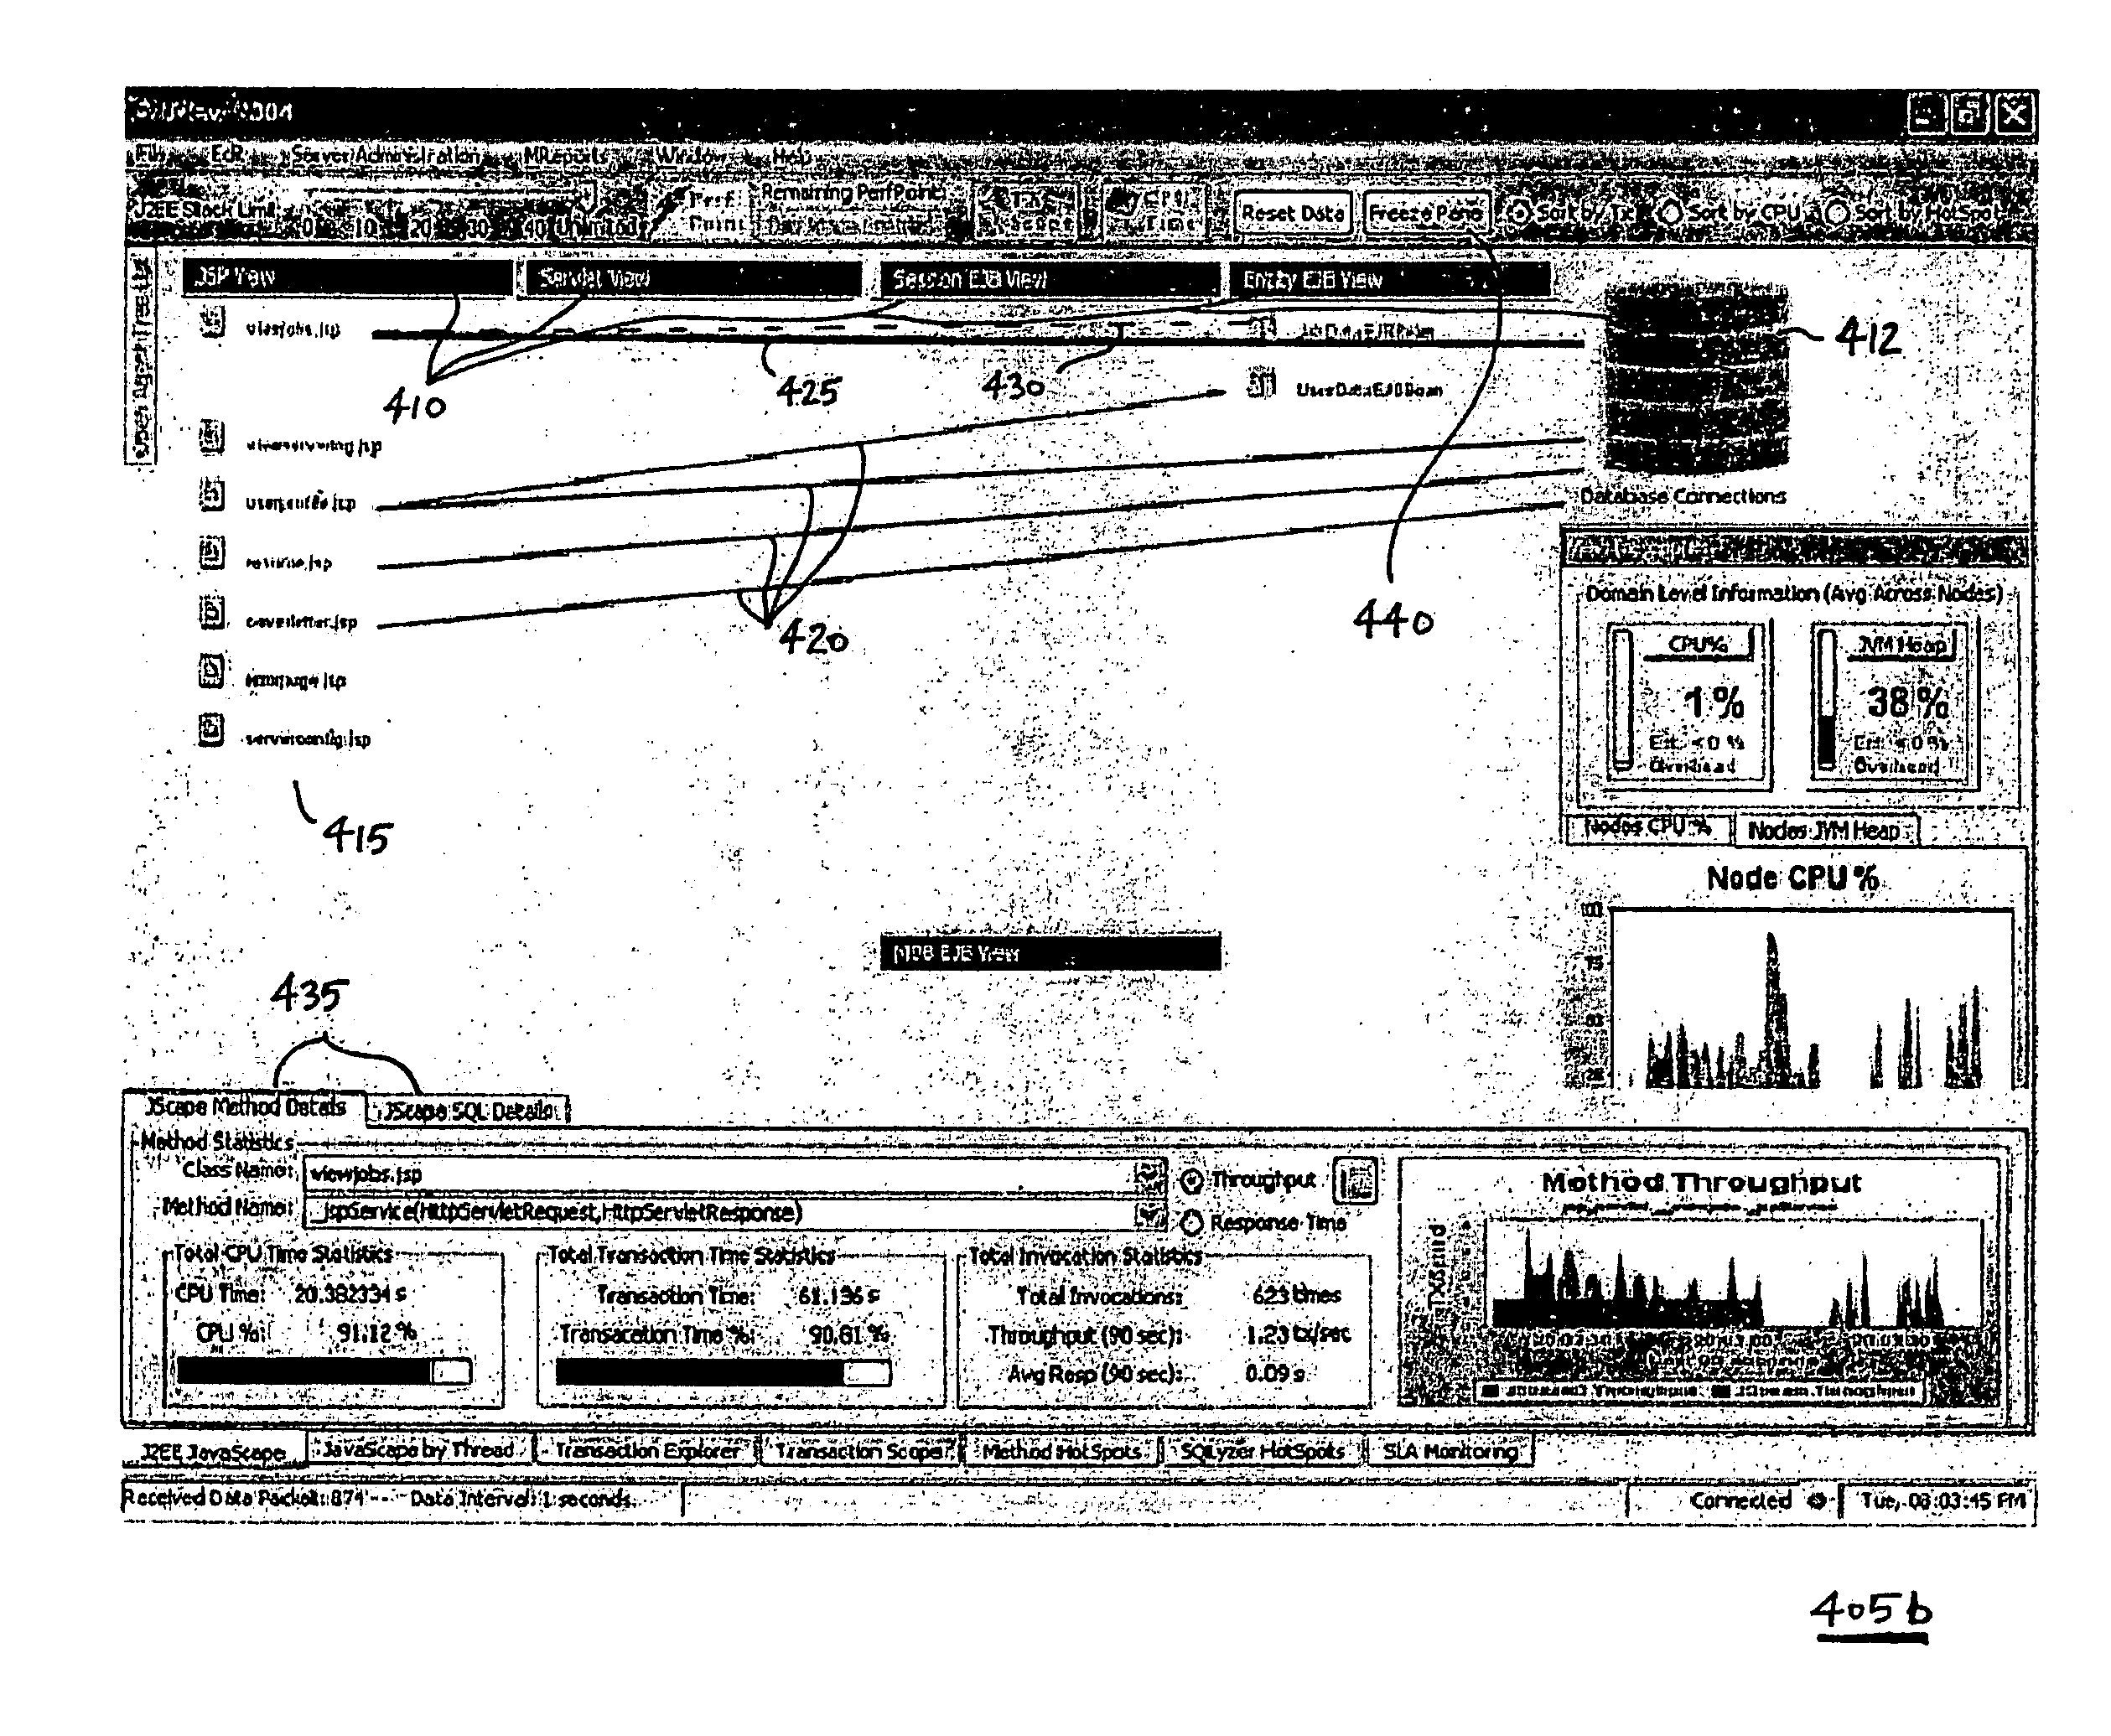
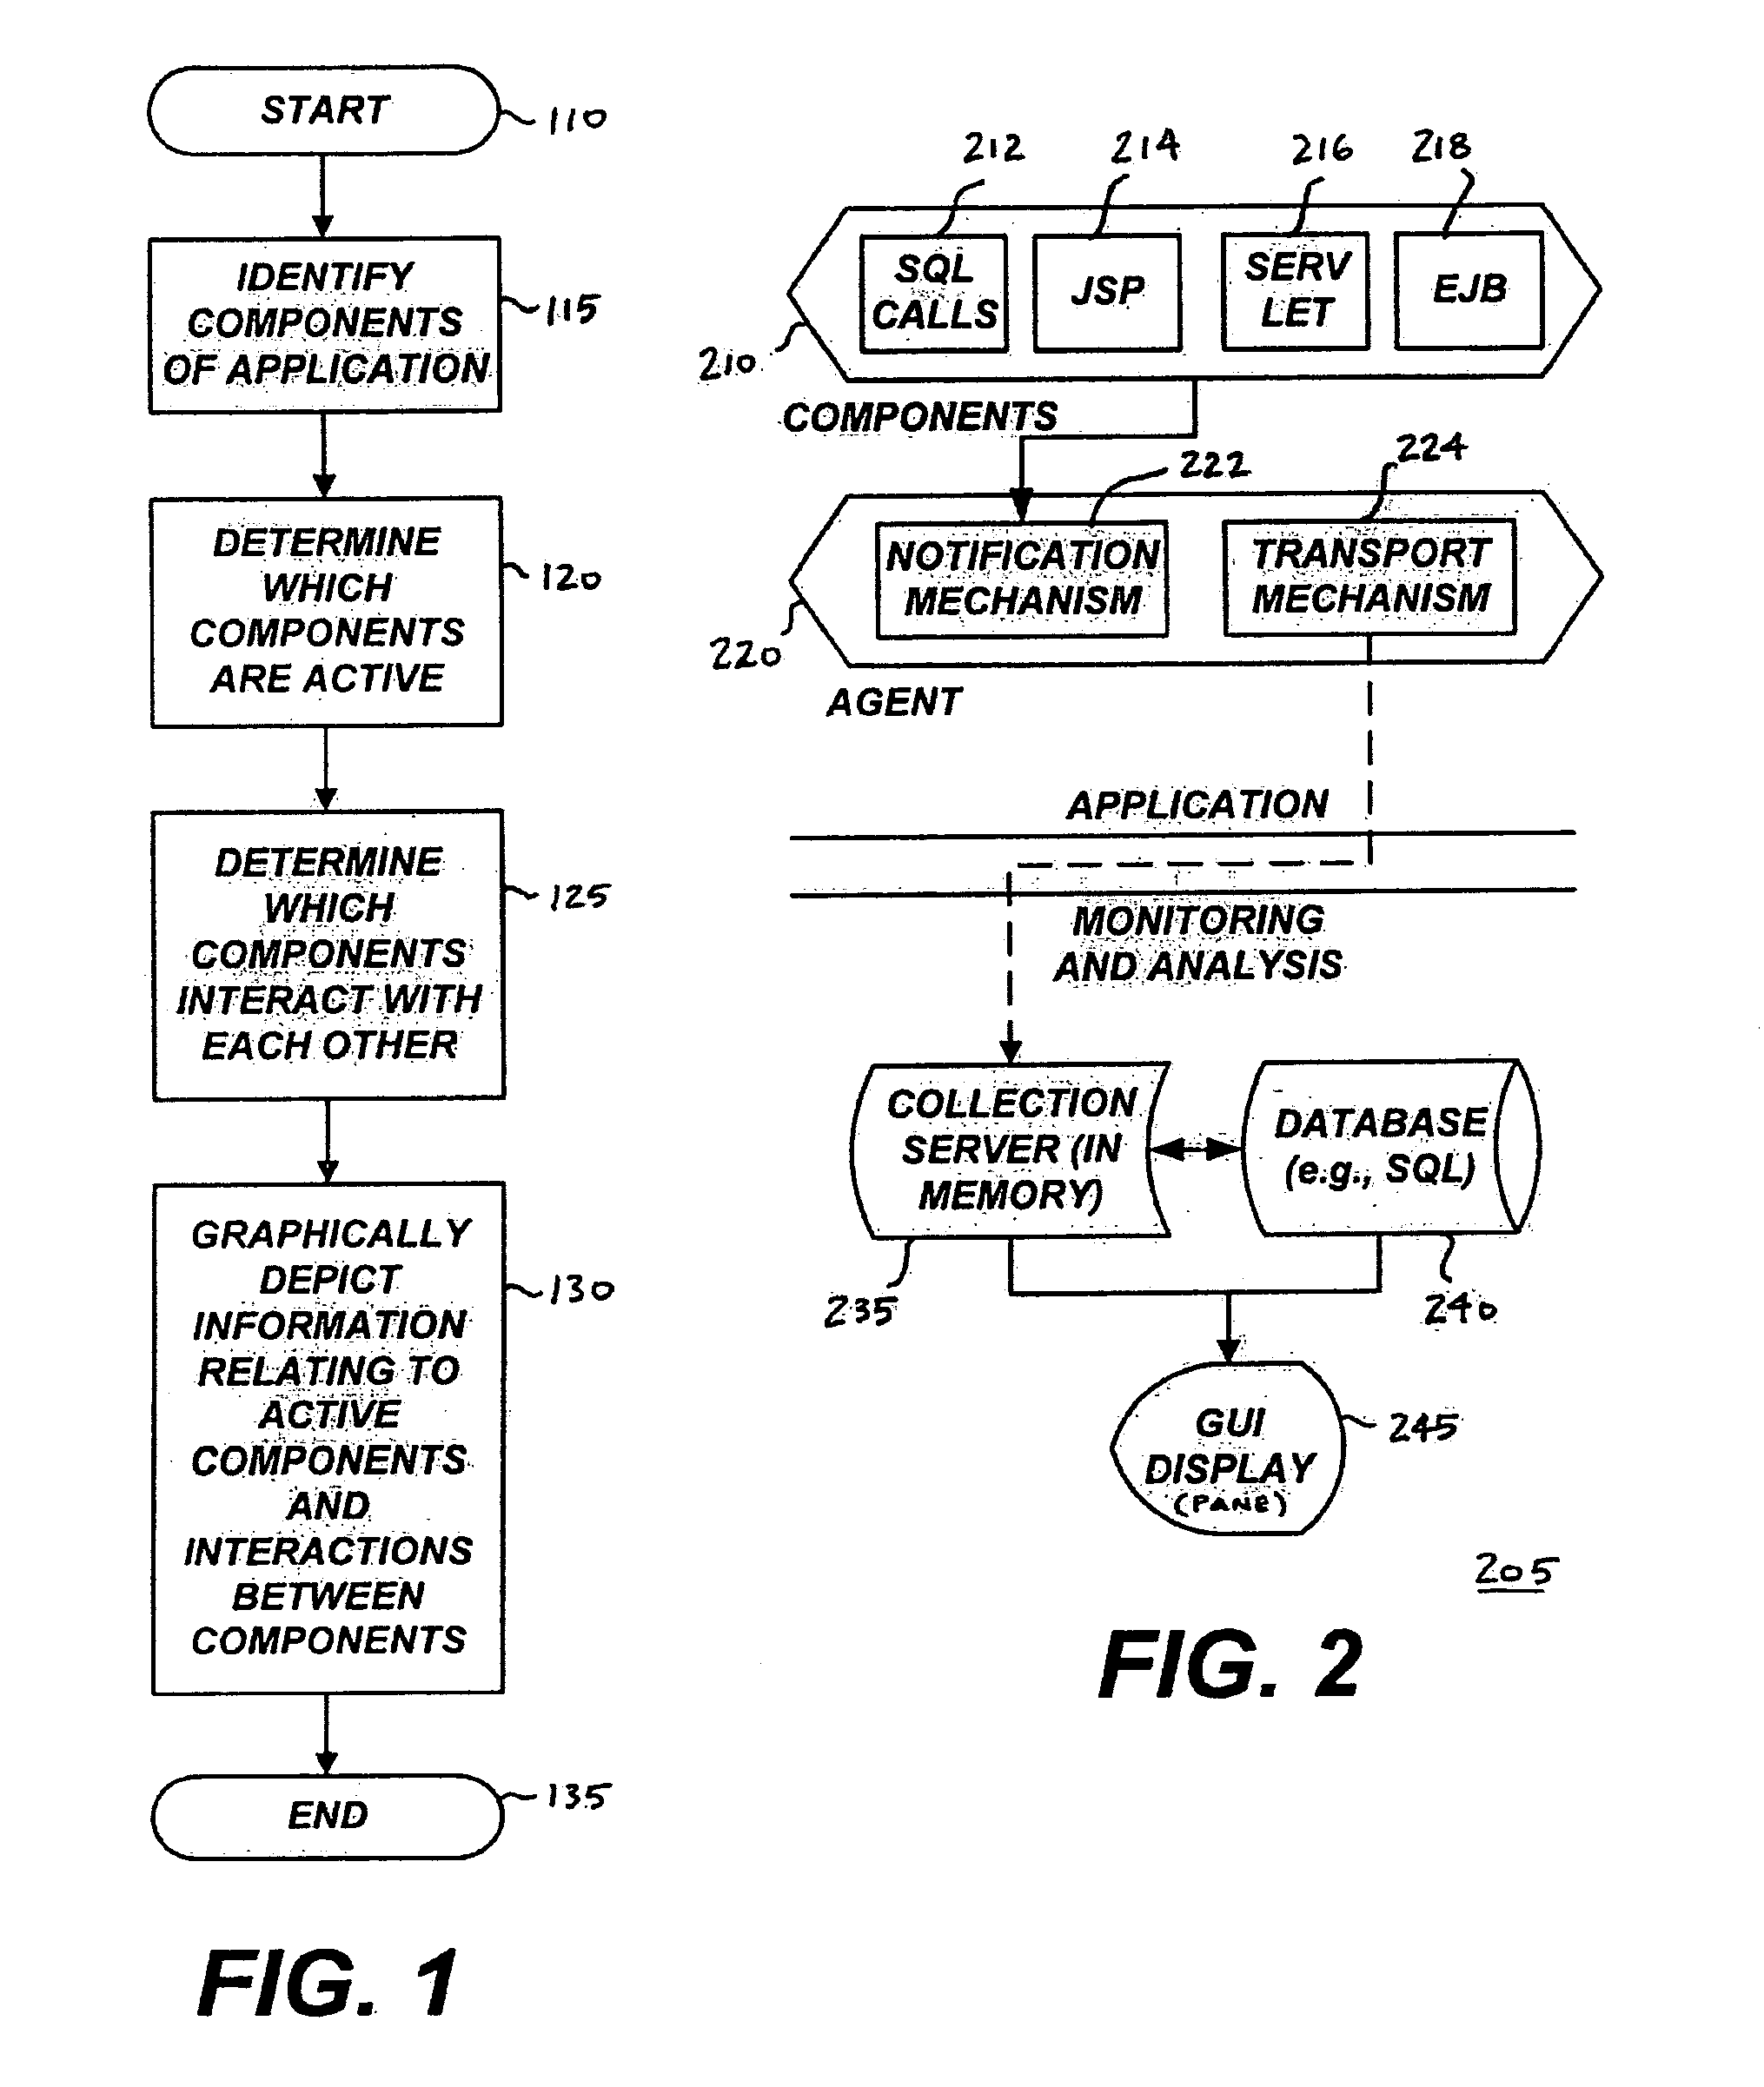
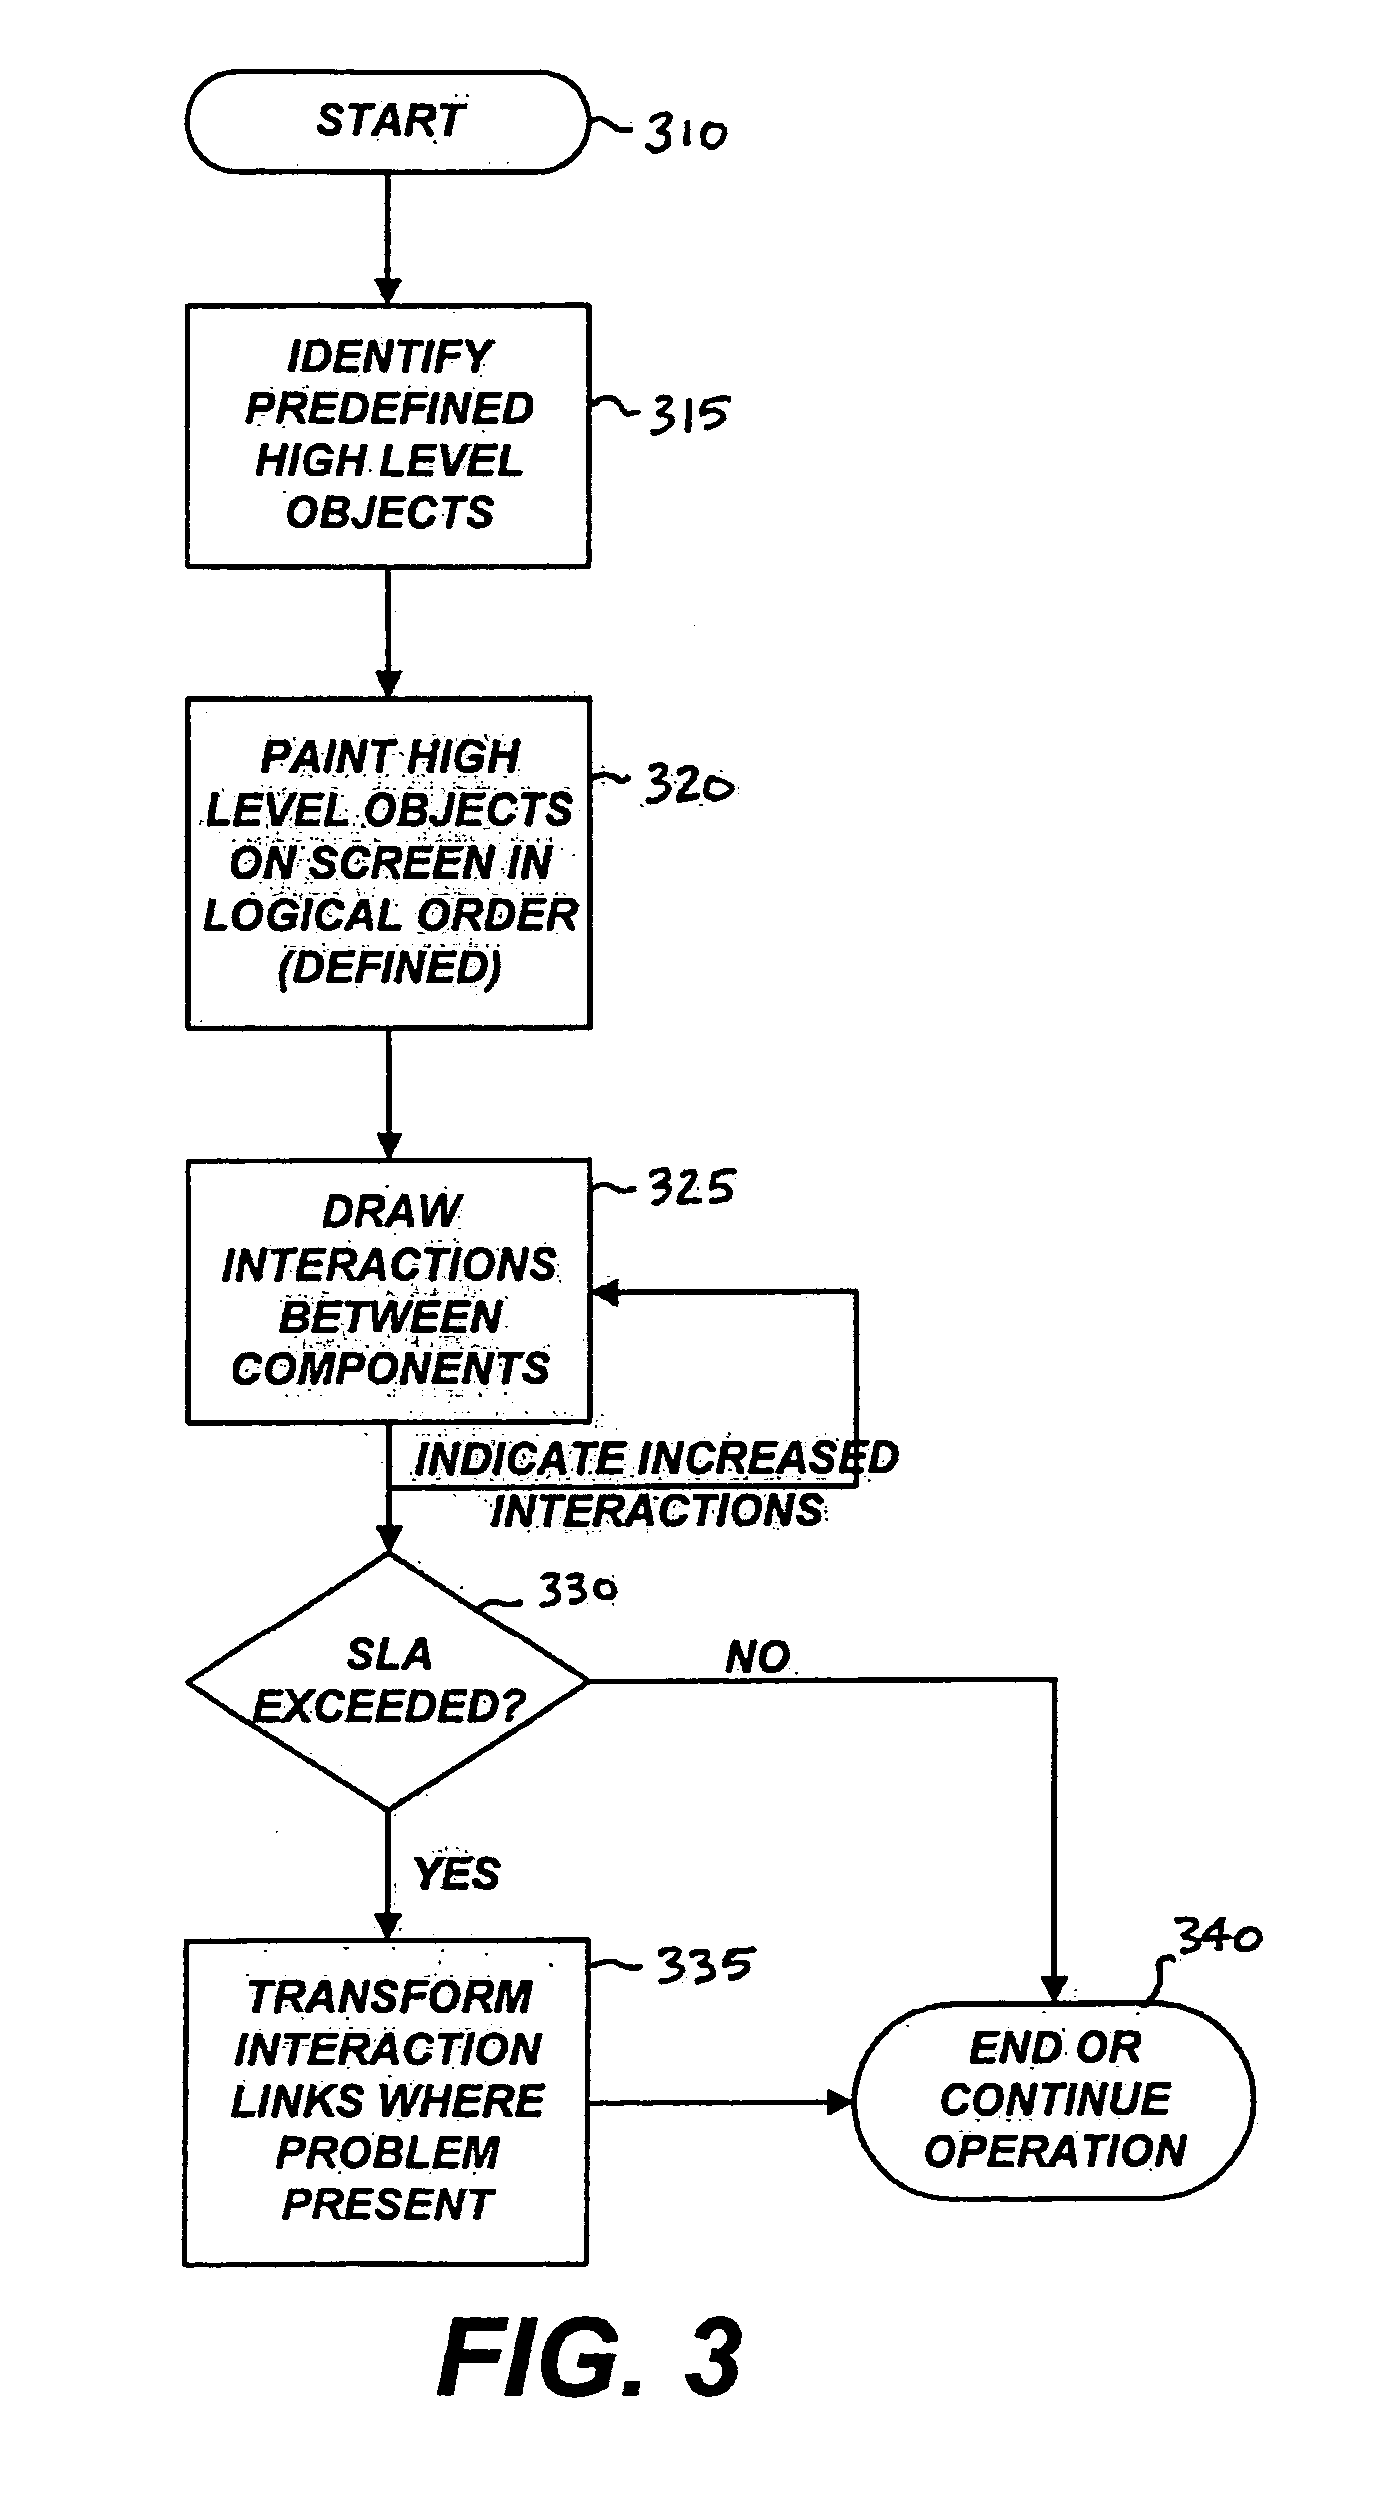
[0027]The present invention includes a system and a method for providing a visual landscape of application server performance in a server-centric application framework (SCAF), for example, Sun Microsystems J2EE or Microsoft .NET. In one embodiment, the visual landscape collects and graphically displays information on component-based performance metrics, component interactions, and analysis of performance shortcomings. Additionally, the system collects the performance metrics of any user-selected internal application server objects.

[0028]Additionally, the system optionally collects the pe...


PUM


Abstract

A system and a method to provide a visual landscape of a server-centric application framework (SCAF) with multiple tiers, multiple components, component interactions, and performance monitoring and analysis. The system and method includes a multi-tiered visual display of component interactions, tuning, monitoring, and analyzing of custom-developed application server components, and alert system for production grade performance monitoring. The system is comprised of a native agent, which interfaces with the an appropriate SCAF machine running the SCAF application server. The agent gathers and sends data transactionally to an enterprise data collector that persists the data and authenticates users / permissions to view the data. The displayed data may include component links, interactions, response times, transaction time degradations, general object performance metrics, and hardware / process performance data. Further, a data-mining system allows access to reporting and analysis tools that aid in delivering optimization recommendations to administrator and developers.

Description

CROSS REFERENCE TO RELATED APPLICATIONS[0001]This application claims priority under 35 USC § 119(e) to U.S. Provisional Patent Application No. 60 / 519,076, filed Nov. 10, 2003, and titled “Methods and systems of visual landscape for multi-tiered, near real-time Java J2EE component interactions, performance monitoring, and performance analysis application JavaScape technology,” the contents of which are herein incorporated by reference.BACKGROUND OF THE INVENTION[0002]1. Field of the Invention[0003]This invention relates generally to computer systems and software and more particularly to the performance management and performance monitoring of server-centric application framework servers and components.[0004]2. Description of the Related Arts[0005]Many organizations are migrating their legacy systems to server-centric application frameworks (SCAF), such as Sun Microsystems Java 2 enterprise environment (namely, J2EE application servers) and Microsoft .NET. While SCAF's such as the J2E...

Claims


Application Information

Patent Timeline
Patent Type & Authority Patents(United States)
IPC IPC(8): G06T11/20
CPCG06F11/3419G06F11/3452G06F11/3495G06F2201/86G06F2201/865G06F2201/87G06F2201/88G06F2201/885
Inventor CIABARRA, MARIO
Owner DYNATRACE
Why Eureka
Try Eureka