Method and system for determining histograms

a method and system technology, applied in the field of data analysis, can solve the problem that it is, of course, impossible to continuously vary any parameter

Active Publication Date: 2008-06-24
WEBER JAMES S
View PDF12 Cites 11 Cited by
  • Summary
  • Abstract
  • Description
  • Claims
  • Application Information

AI Technical Summary

Problems solved by technology

However, just as a data sample does not necessarily represent a population, a histogram does not necessarily represent a data sample.
In practice, it is, of course, impossible to continuously vary any parameter.
One problem is to determine well defined subsets of all histogram appearances that are possible for a given data sample and to display those histogram appearances and a typical or preferred histogram having an appearance.

Method used


Image

  • Method and system for determining histograms
  • Method and system for determining histograms
  • Method and system for determining histograms

Examples


Embodiment Construction

Exemplary Histogram Computing System

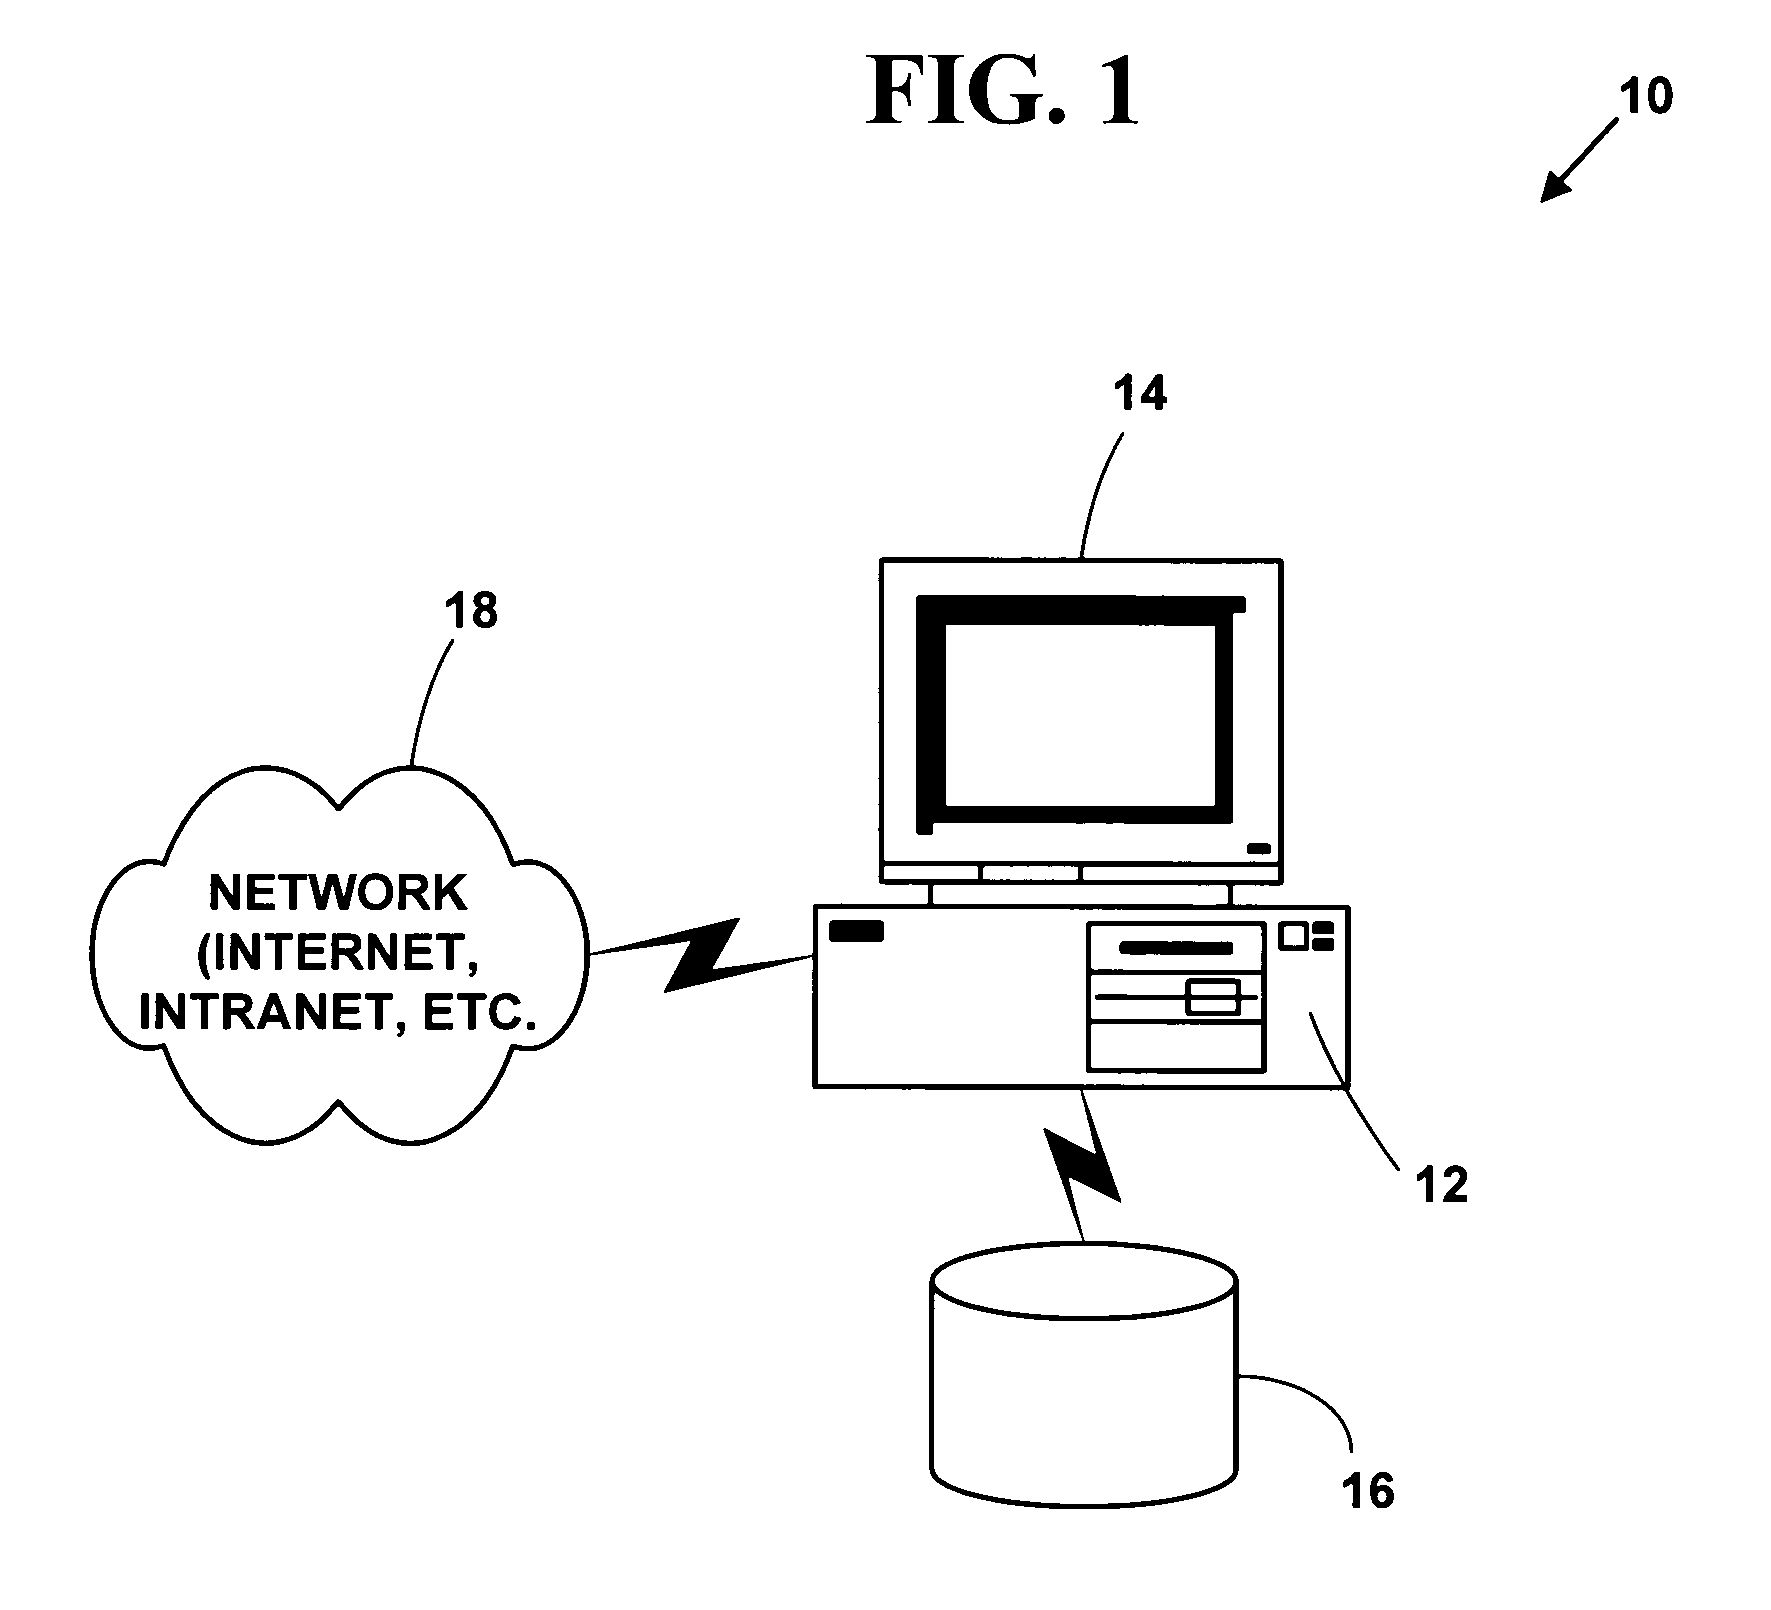
[0020]FIG. 1 illustrates a histogram computing system 10 for embodiments of the present invention. The histogram computing system 10 includes one or more computers 12 with computer displays 14 for graphically displaying histograms (only one is illustrated). The computer display presents a windowed graphical user interface (GUI) with multiple windows to a user. The computer 12 is associated with one or more databases 16 (one of which is illustrated) used to store data for the histogram computing system 10. The one or more databases 16 include a memory system within the computer 12 or secondary storage associated with computer 12 such as a hard disk, floppy disk, optical disk, or other non-volatile mass storage devices. The one or more computers 12 may be replaced with client terminals in communications with one or more servers, a personal digital / data assistant (PDA), a laptop computer, a mobile computer, an Internet appliance, one or two-way pager...


PUM


Abstract

Histograms are widely used to explore data, to present data, and to persuade with data. A method and system for identifying all possible histograms from a data sample using histogram appearances. The method and system includes determining all possible one dimensional histogram appearances for a transformed data sample using constant width intervals and for multidimensional appearances with data cell boundaries that are parallel as well as not parallel to data space axes together with multiple conditions on the interval widths for each dimension or transformed dimension.

Description

CROSS REFERENCES TO RELATED APPLICATIONS[0001]This application claims priority to U.S. Provisional Application 60 / 540,407, filed on Jan. 30, 2004, the contents of which are incorporated by reference.FIELD OF THE INVENTION[0002]This invention relates analysis of data. More specifically, it relates to a method and system for creating, analyzing and selecting histograms having a preferred appearance and / or other feature(s).BACKGROUND OF THE INVENTION[0003]A histogram is a graphical chart, such as a bar chart, representing a frequency distribution of data elements where the heights of objects in the chart represent observed frequencies of the data elements. There is often a great variability among the many possible histograms of a data sample that are produced.[0004]Histograms have been in use for approximately 300 years and perhaps were the first and now are the most widely used graphic for quantitative data. The histogram is the most common graph of the distribution of one quantitativ...

Claims


Application Information

Patent Timeline
Patent Type & Authority Patents(United States)
IPC IPC(8): G06F17/18G06K9/00
CPCG06F17/18
Inventor WEBER, JAMES S.
Owner WEBER JAMES S
Why Eureka
Try Eureka