Resource tepee

a resource and color code technology, applied in the field of color coded display, can solve the problem that does not provide a visualization of other resources utilized, and achieve the effect of easy grasping depiction

Active Publication Date: 2009-02-24
SRINIVASAN SHANKAR S
View PDF8 Cites 2 Cited by
  • Summary
  • Abstract
  • Description
  • Claims
  • Application Information

AI Technical Summary

Benefits of technology

[0008]This invention maps data on resource utilization at various functions and at differing levels within the organization onto a color coded chart. This color coded chart is an easy to grasp depiction of resource utilization compared to raw data and it's mathematical transformations. If a color on the chart is dominant then the function associated with the color expen

Problems solved by technology

While the organizational chart provides an overview of manpower distri

Method used


Image

  • Resource tepee
  • Resource tepee
  • Resource tepee

Examples


Embodiment Construction

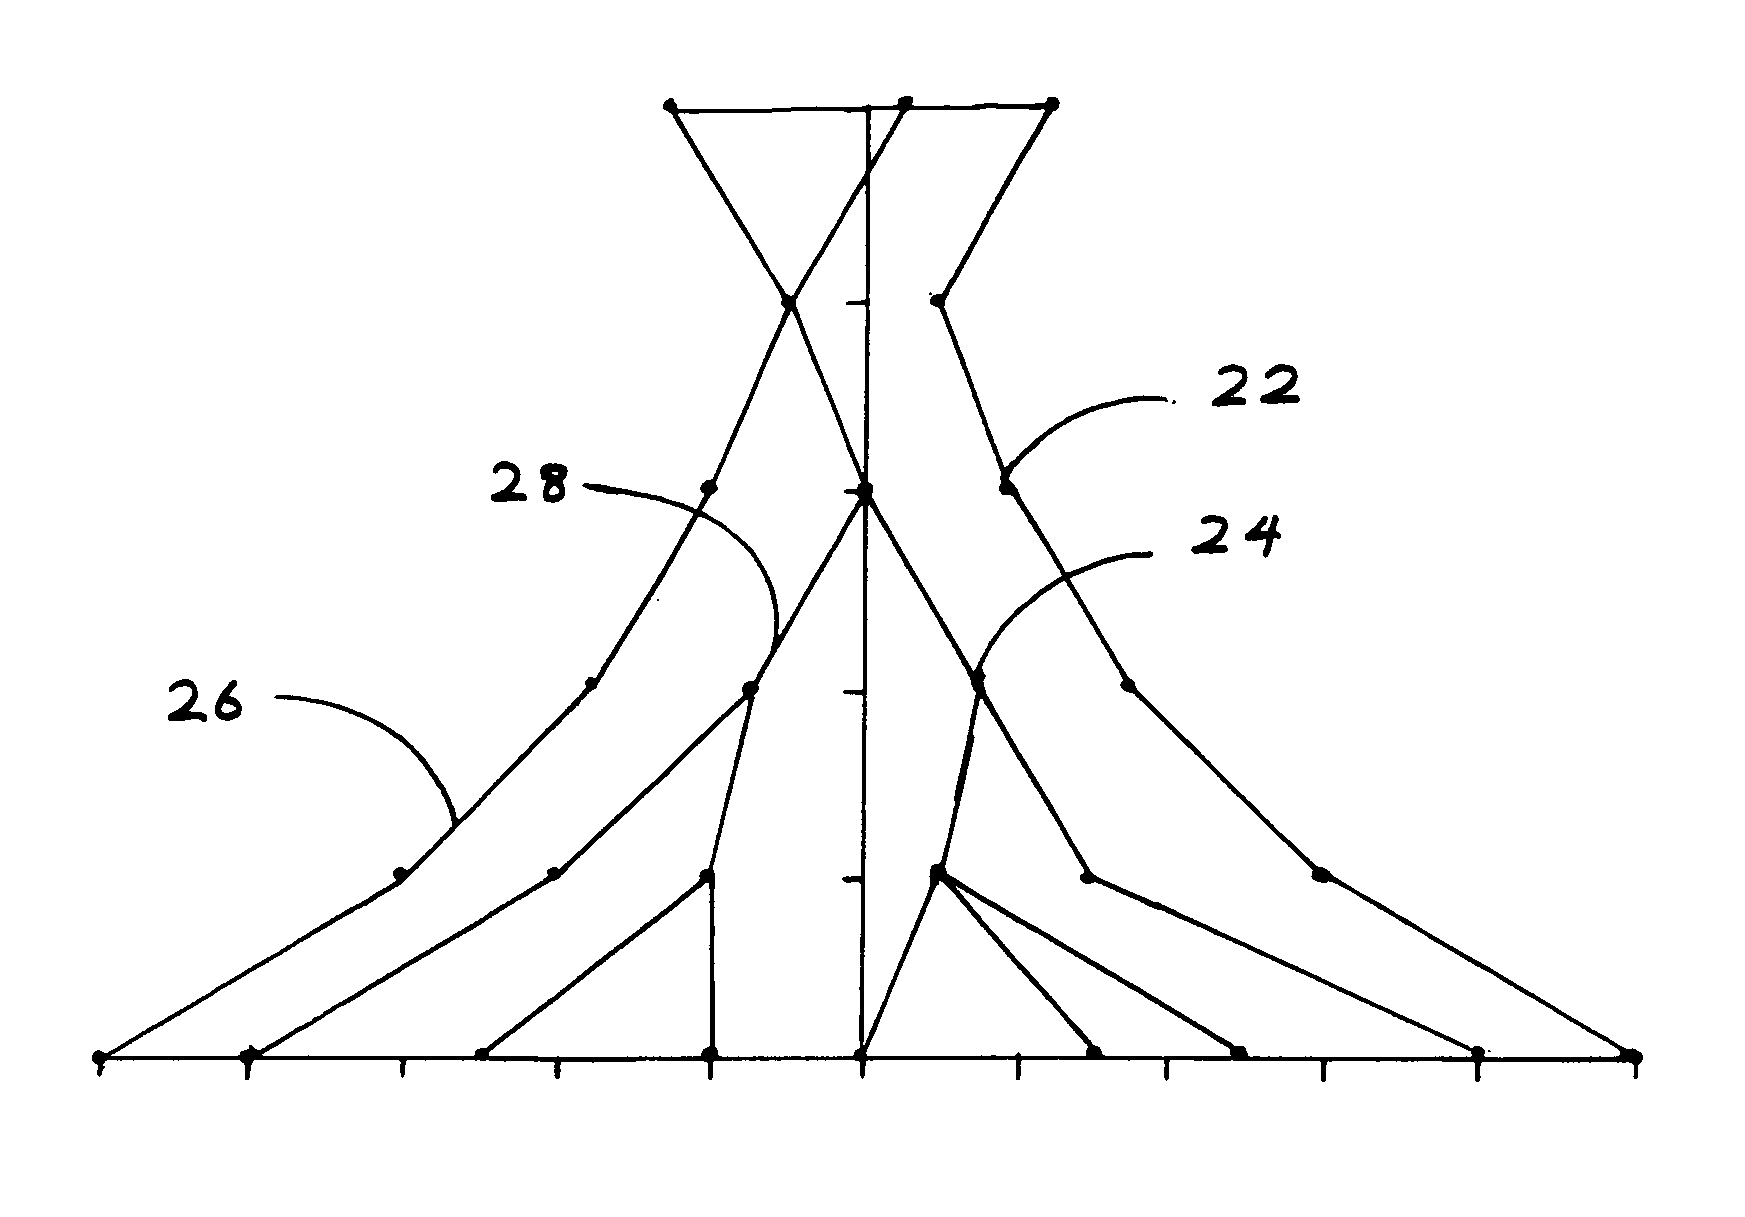
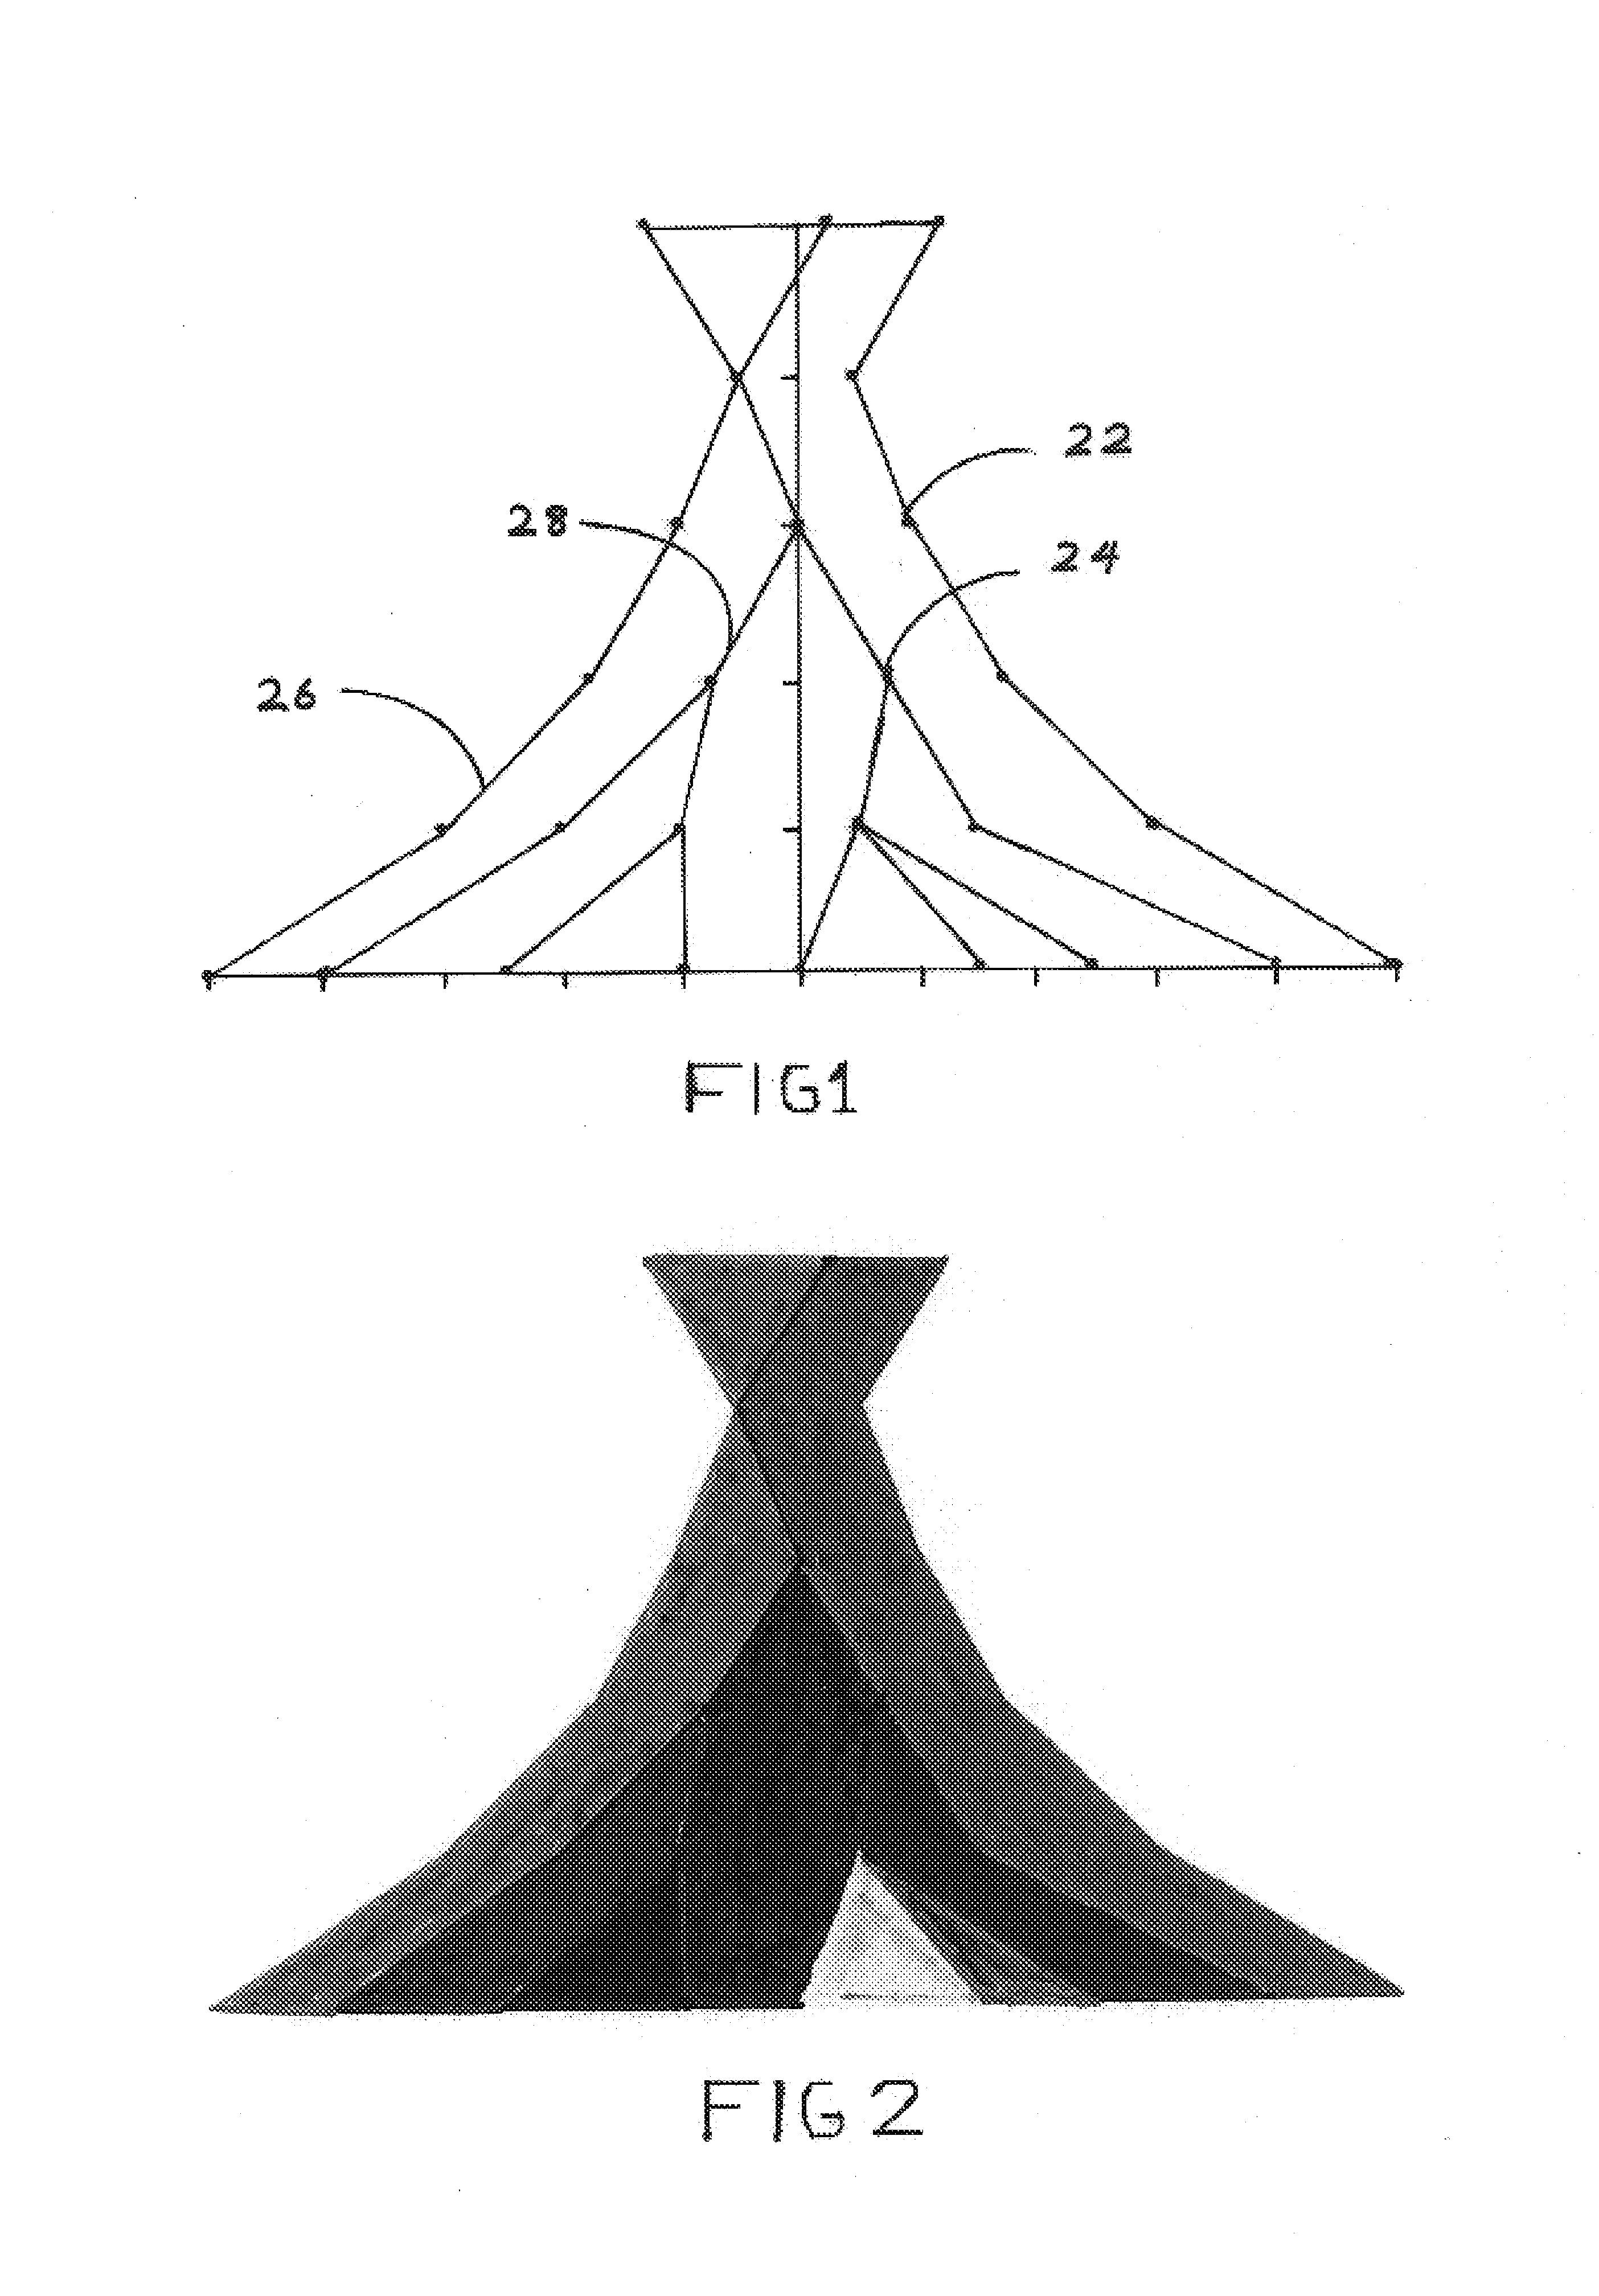
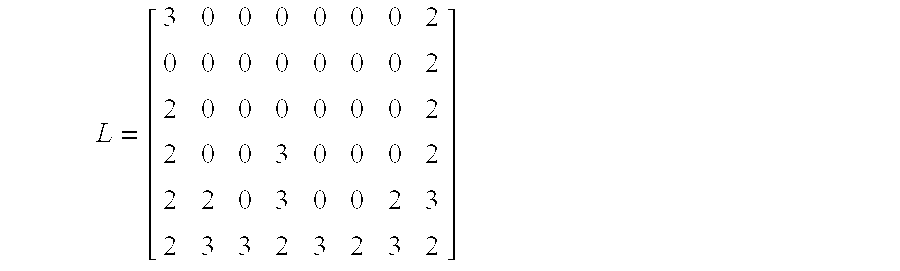
[0013]In this discussion, organizations are any commercial, non-profit or governmental collective entities, resources refer to costs, supplies or supports used to achieve organizational objectives and functions refers to coalitions within organizations typically professional groupings such as marketing, finance, R&D etc. Briefly, the process of constructing a Resource Tepee starts with a resource utilization matrix. This generates a matrix of co-ordinates whose elements are the nodes of the Tepee. The nodes of the Tepee are connected by lines going from the bottom to the top of the Tepee. The spaces between the lines are colored appropriately to generate the Resource Tepee. An example is interspersed within the detailed description that follows in order to illustrate the Resource Tepee.

Resource Utilization

[0014]The resource utilization matrix, denoted by L, will consist of element lkj which represent the resource utilization by the kth function at the jth level. The subscript k for ...


PUM


Abstract

A color display called a Resource Tepee depicting, at a glance, resource utilization across functions and over levels of an organization. The display is constructed by starting with a resource utilization matrix whose elements are resources utilized at each combination of function and level. A matrix of co-ordinates is computed using the resource utilization matrix. This matrix contains the nodes of the Tepee. Boundary lines to separate the colors of the Tepee are obtained by connecting co-ordinates in each column of the matrix of co-ordinates. Colors representing distinct functions are applied to the spaces between boundary lines to obtain the Resource Tepee.

Description

CROSS REFERENCE TO RELATED APPLICATIONS[0001]Not ApplicableFEDERALLY SPONSORED RESEARCH[0002]Not ApplicableSEQUENCE LISTING OR PROGRAM[0003]Not ApplicableBACKGROUND OF THE INVENTION[0004]1. Field of Invention[0005]The invention is a color coded display depicting resource utilization across the functions and levels of an organization and ties organizational structure to resource utilization.[0006]2. Description of Related Art[0007]The structure of organizations is often depicted using an organizational chart consisting of blocks and lines. The blocks contain the name and title of an employee and the lines define reporting relationships. An organizational chart tells us how personnel are distributed over various functions at different hierarchical levels within an organization. Enhancements pertaining to organizational charts are in U.S. Pat. No. 5,467,440 to Nehei (1995), U.S. Pat. No. 5,829,003 to Okura (1998) and U.S. Pat. No. 5,341,223 to Shigeeda et al. (1994). U.S. Pat. No. 6,61...

Claims


Application Information

Patent Timeline
IPC IPC(8): G09G5/00G06F3/00G06T11/20
CPCG06Q10/06G06Q10/10
Inventor SRINIVASAN, SHANKAR S
Owner SRINIVASAN SHANKAR S
Why Eureka
Try Eureka