
Method of seismic signal processing

a technology of seismic signal and processing method, applied in the field of seismic signal processing, can solve the problems of seismic image degradation or distortion, inaccuracy or technological limitations may have quite complicated degradation effects on seismic images, and the processing requires extensive computer resources

Inactive Publication Date: 2010-05-18
STATOIL ASA PETRO SA (NO)
View PDF9 Cites 19 Cited by
  • Summary
  • Abstract
  • Description
  • Claims
  • Application Information

AI Technical Summary

Benefits of technology

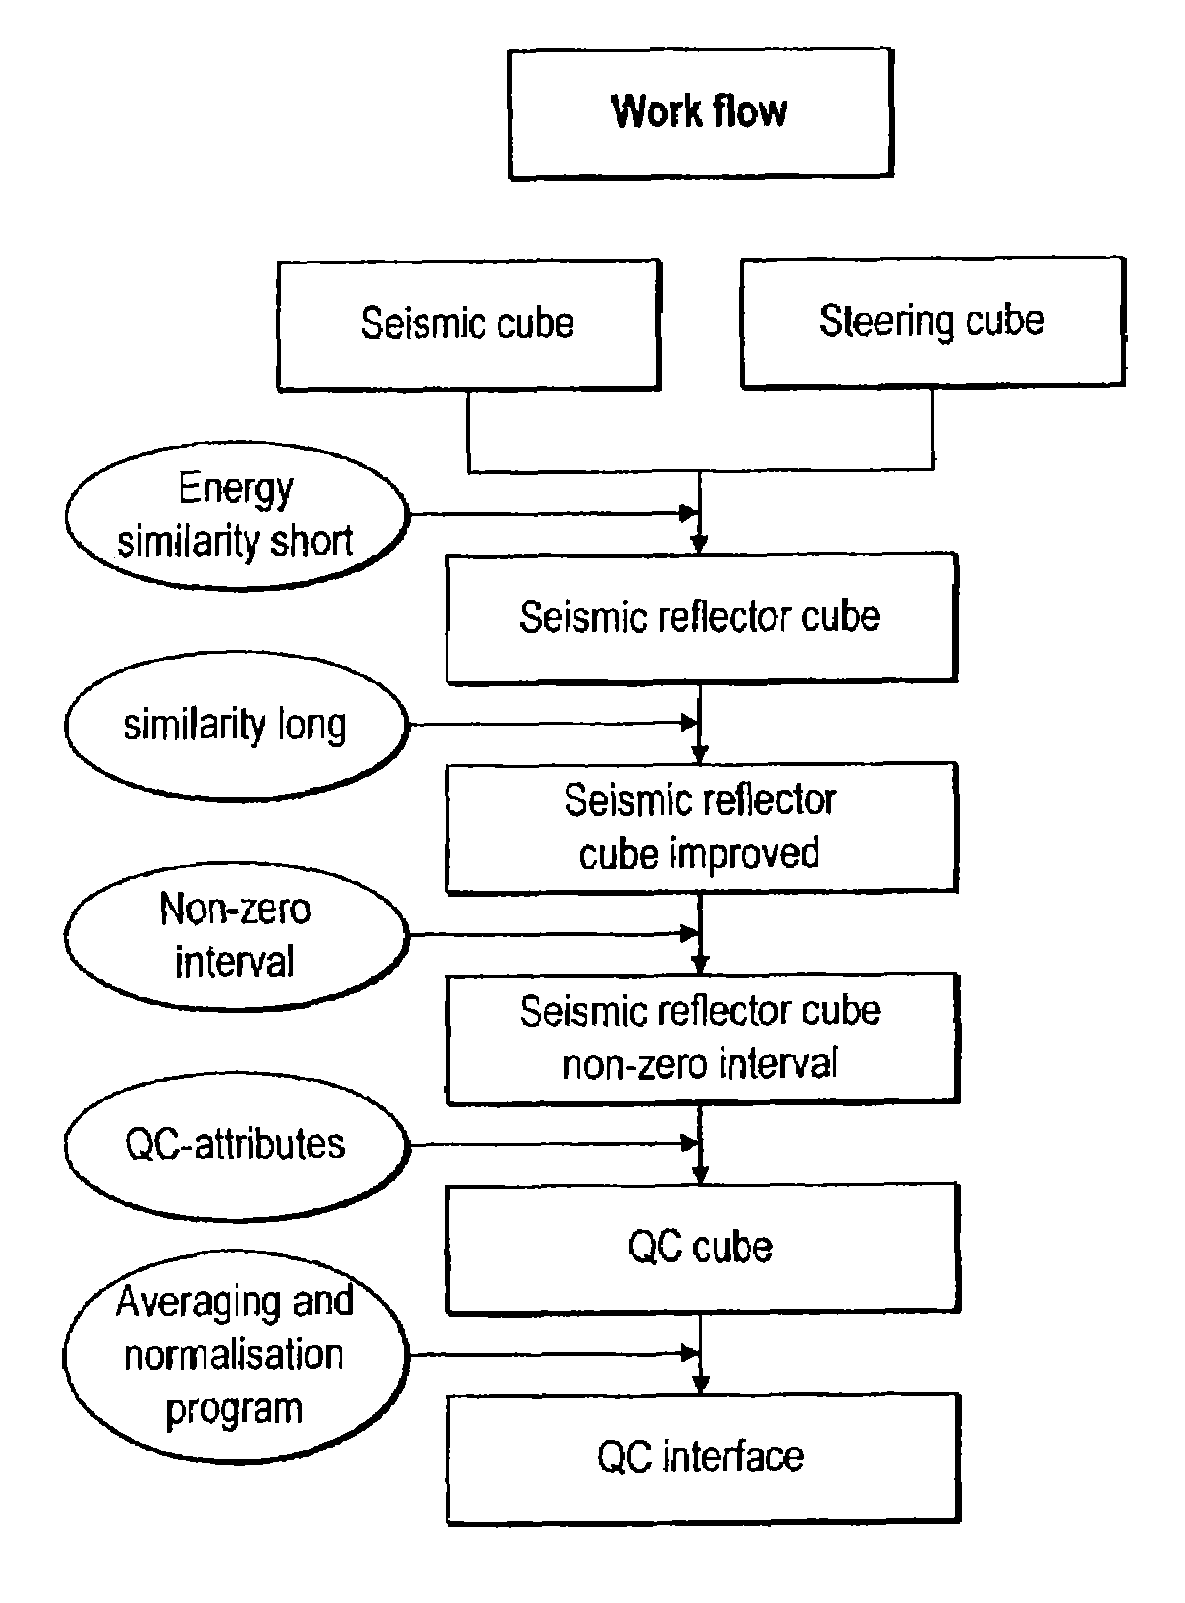
"The present invention is about a method for monitoring and assessing the quality of seismic images in real-time and offshore. The method uses a series of quality measurements made on seismic attributes within a moving seismic volume to identify and reduce distortion and degradation in the seismic images. The method is particularly sensitive to acquisition errors and external influences, such as human error, inaccuracies, and technological limitations. By measuring and stacking the quality measurements, the method helps to improve the accuracy of seismic imaging and reduce the size of the seismic data volume. The method can be carried out simultaneously with the data acquisition process and can be used to improve the quality of seismic images in real-time and offshore."

Problems solved by technology

The processing requires extensive computer resources.
For several reasons, these processes deviate from ideal imaging conditions and therefore the seismic images tend to be degraded or distorted.
A challenge in the seismic imaging field is therefore to monitor the quality and conditions at all stages of the imaging process and finally to evaluate the quality of the seismic images to be used in building geological models of the subsurface.
Distortions of imaging conditions such as instabilities, inaccuracies or technological limitations may have quite complicated degradation effects on seismic images.
However, in real seismic events, the shape and complexity of the subsurface layers may distort measurements of quality.
In addition, numerous different seismic events and noise may interfere and distort the direct quantification of the quality of the seismic data obtained.
Human error, inaccuracies and technological limitations will further distort the seismic data and hence the seismic image produced.
It is difficult to predict the presence of such influences, which may occur individually or in groups at any one time.
These influences affect all seismic traces locally and lead to errors in the seismic data obtained.
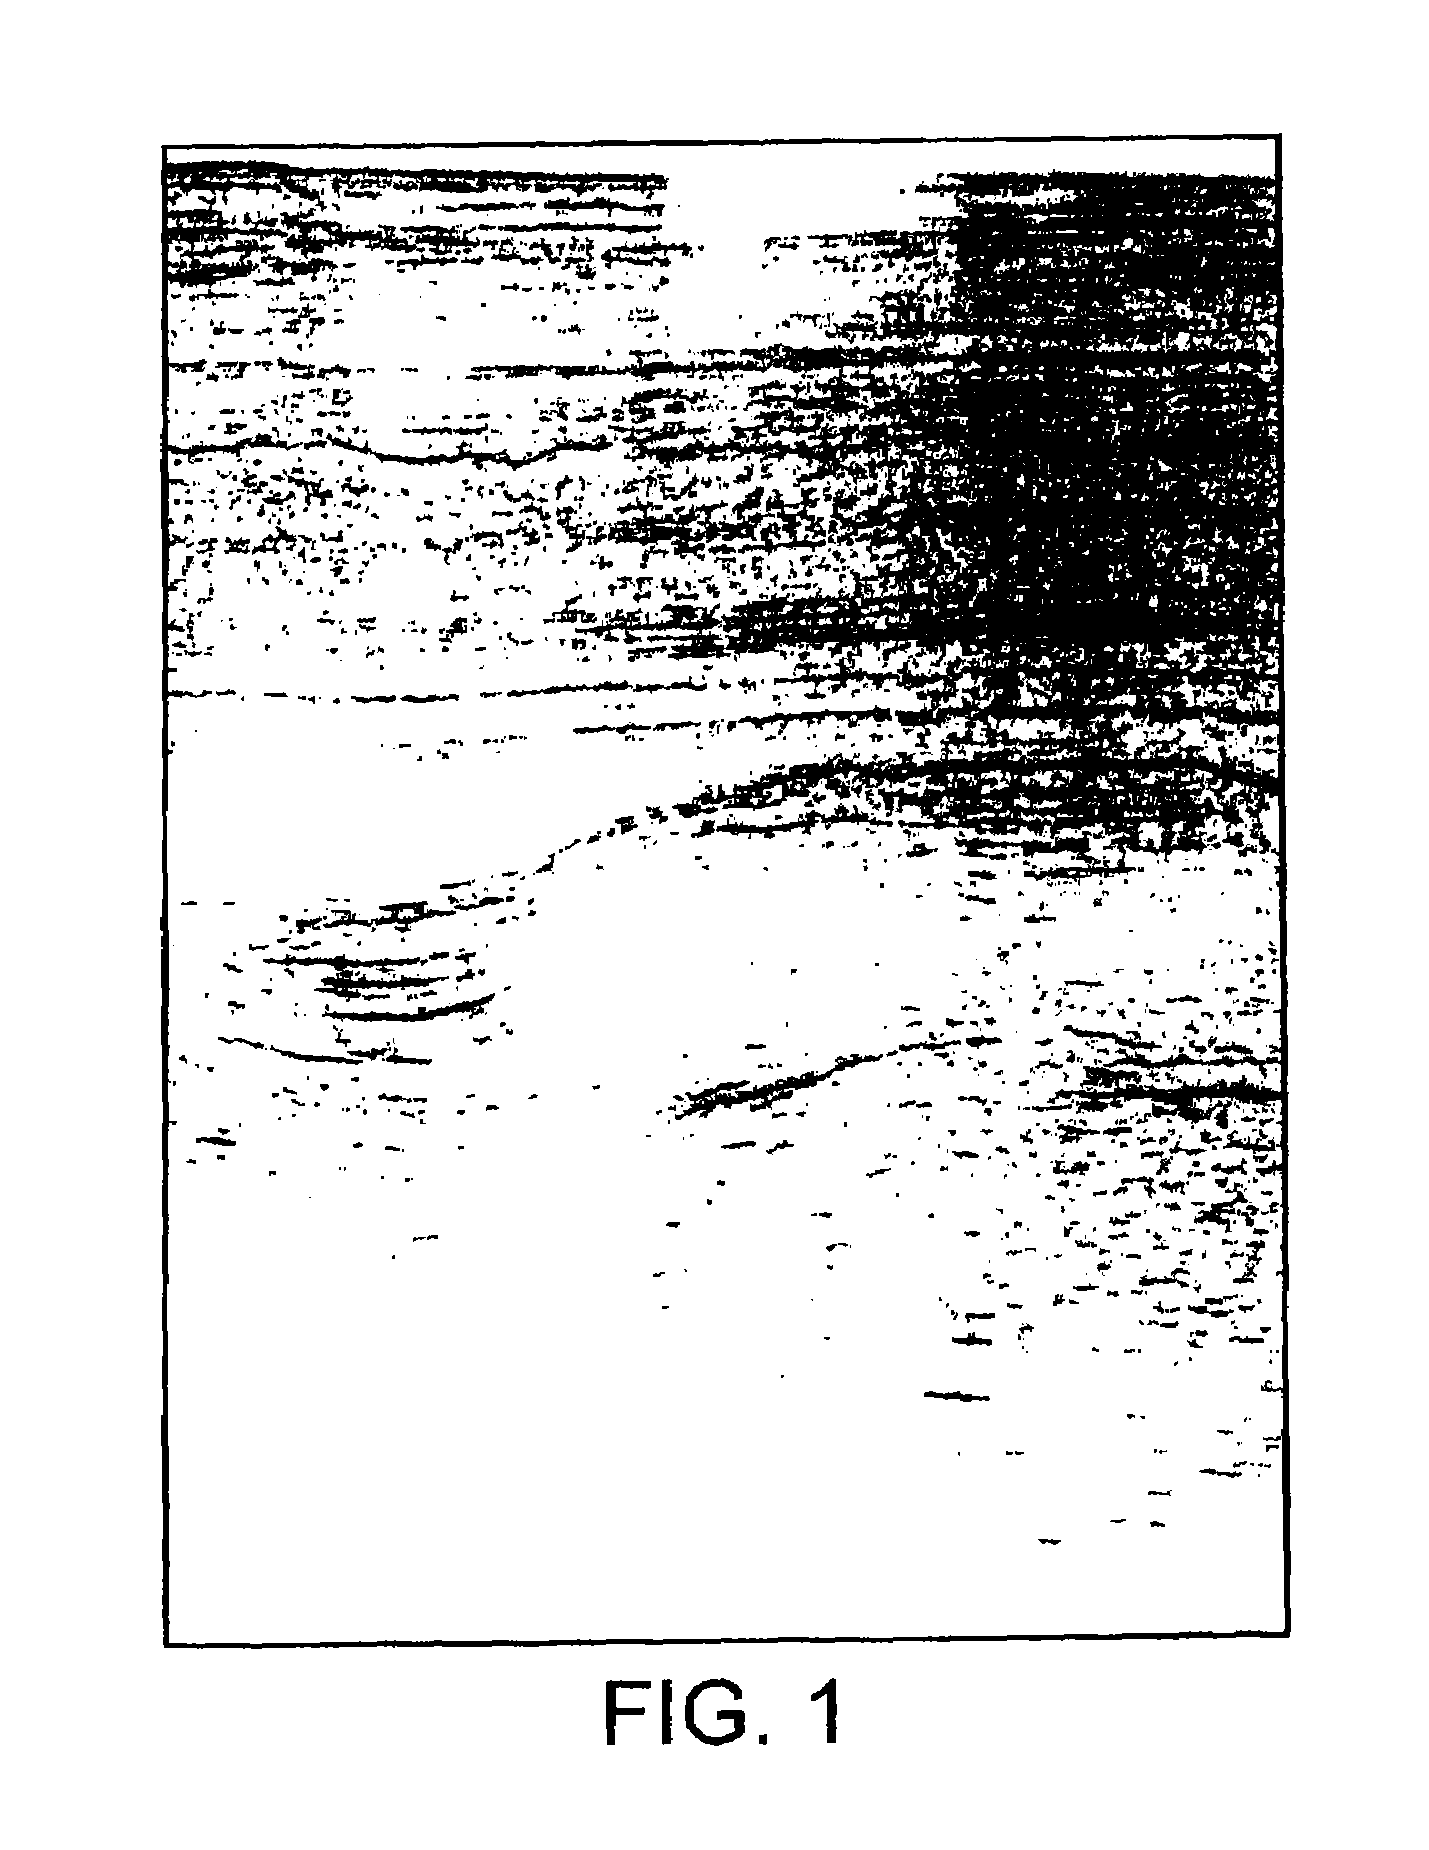
The cobwebs may be difficult to identify by eye and even more difficult to detect by standard quality measurements, since the geological footprint may dominate.
Due to the systematic reduction in data qualities along the vertical axis, both due to the absorption of sound in the earth's crust, and limitations in the imaging concept, vertical normalisation of the quality values may be conducted before they are stacked.

Method used


Image

  • Method of seismic signal processing
  • Method of seismic signal processing
  • Method of seismic signal processing

Examples


Embodiment Construction

[0032]The errors and limitations in obtaining the raw data may include, for example, human error, inaccuracy and technological limitations. The size of the “cobwebs” is dependent on such factors as the geometry of the acquired data (e.g. where the data is acquired in the vertical or horizontal directions) and the sound velocity in the subsurface. The size of the cobwebs is in the order of the maximum source receiver offset and the vertical extension equal to the size of the trace length. The cobwebs may be difficult to identify by eye and even more difficult to detect by standard quality measurements, due to lateral variations in geology.

[0033]Quality measurements are performed along the detected reflectors within the particular data volume and the measured quality is normalised in time or depth intervals within the data volume. The normalised quality measurements are in turn stacked and the stacked measurements are then related to a surface point above the centre of the cobweb data...


PUM


Abstract

A method of assessing acquisition errors in seismic images in a seismic data volume. The method includes selecting a seismic attribute in a seismic data volume and then stacking seismic quality image measurements taken along the selected attribute. The stacked measurements are then related on the basis of any vertical correlation and any vertically correlated feature is identified as a cobweb. Any identified cobwebs are removed from the seismic data volume.

Description

RELATED APPLICATIONS[0001]This application claims priority to PCT Application No. PCT / GB2006 / 000075 filed Jan. 10, 2006, and Great Britain Application No. 0500484.1 filed Jan. 11, 2005, the disclosures of which are hereby incorporated by reference in their entirety.FIELD OF THE INVENTION[0002]The present invention is concerned with a method of monitoring and assessing distortion and degradation in seismic images. The invention is applicable both to on shore and off shore exploration.BACKGROUND OF THE INVENTION[0003]In conventional 3-D seismic surveying, seismic data is acquired along closely spaced lines which provide detailed subsurface information. With such high-density coverage, large volumes of digital data must be recorded, stored and processed prior to interpretation. The processing requires extensive computer resources. When the seismic data has been processed it is interpreted in the form a 3-D cube (or seismic data volume) which effectively represents a display of subsurfa...

Claims


Application Information

Patent Timeline
Patent Type & Authority Patents(United States)
IPC IPC(8): G01V1/28G01V1/00
CPCG01V1/288G01V2200/14G01V1/28G01V1/366
Inventor MELDAHL, PAUL
Owner STATOIL ASA PETRO SA (NO)
Learn More