
Graphical system for determining the relative attractiveness of investments

a graph system and relative attractiveness technology, applied in the field of financial and stock investment, can solve the problems of a number of limitations, little adaptation to personal investment, complex issue of stock valuation and other financial investments

Inactive Publication Date: 2011-02-01
INFINANCIALS
View PDF5 Cites 11 Cited by
  • Summary
  • Abstract
  • Description
  • Claims
  • Application Information

AI Technical Summary

Benefits of technology

Enables investors to quickly and accurately assess the relative attractiveness of stocks within their personalized investment universe, providing a clear graphical representation of financial indicators, facilitating informed investment decisions by overcoming the limitations of prior art methods.

Problems solved by technology

The evaluation of stocks and other financial investments is a complex issue.
A number of methods and strategies to rank stocks have been developed but they suffer from a number of limitations.
The purpose of many models is to help investors in the selection of stocks and the construction of portfolios that theoretically outperform the market, but in doing so they introduce a bias into the investment strategy and allow little adaptation to the personal investment strategy of the investor.
The universe of stocks considered by prior art methods is generally quite limited and usually covering only one country and / or few indices thus reducing their effectiveness.
There is little focus given to the comparison of the relative attractiveness of industry peers and, when done, they suffer from the lack of accurate peer groups.
Furthermore, stock scores or ranks used in the prior art are often described by a set of numbers which are difficult and time-consuming to interpret.

Method used


Image

  • Graphical system for determining the relative attractiveness of investments
  • Graphical system for determining the relative attractiveness of investments
  • Graphical system for determining the relative attractiveness of investments

Examples


Embodiment Construction

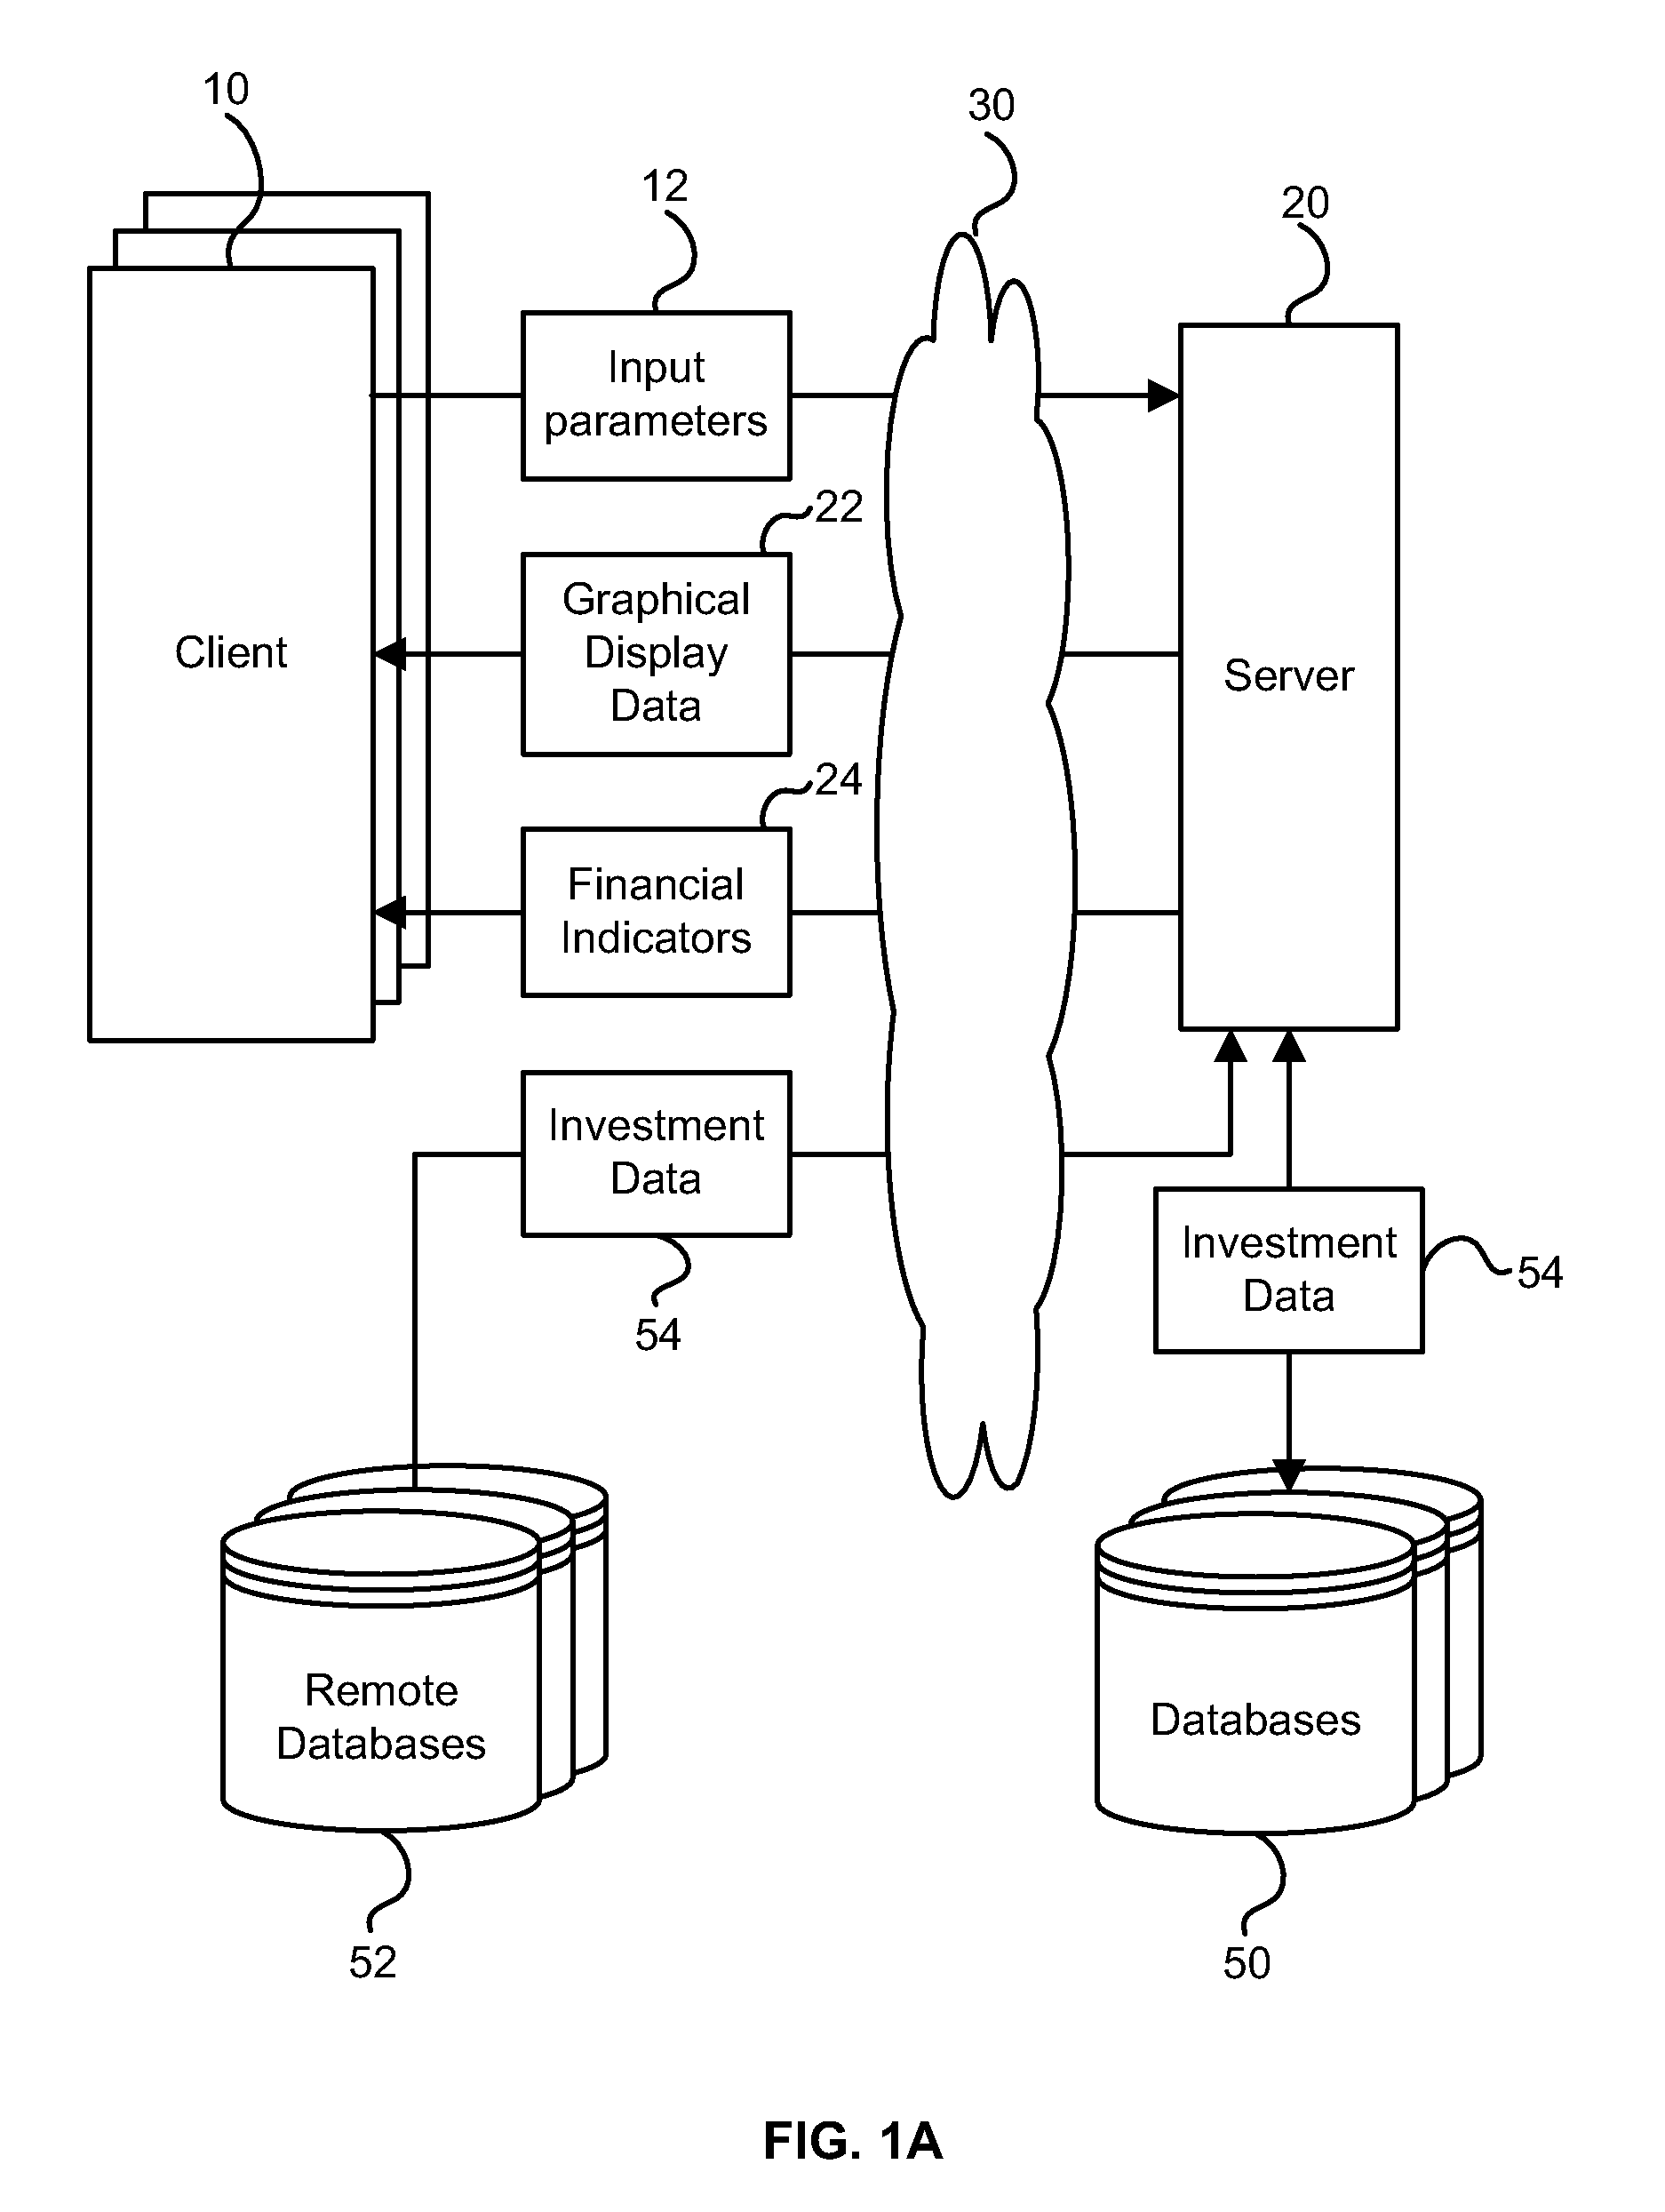
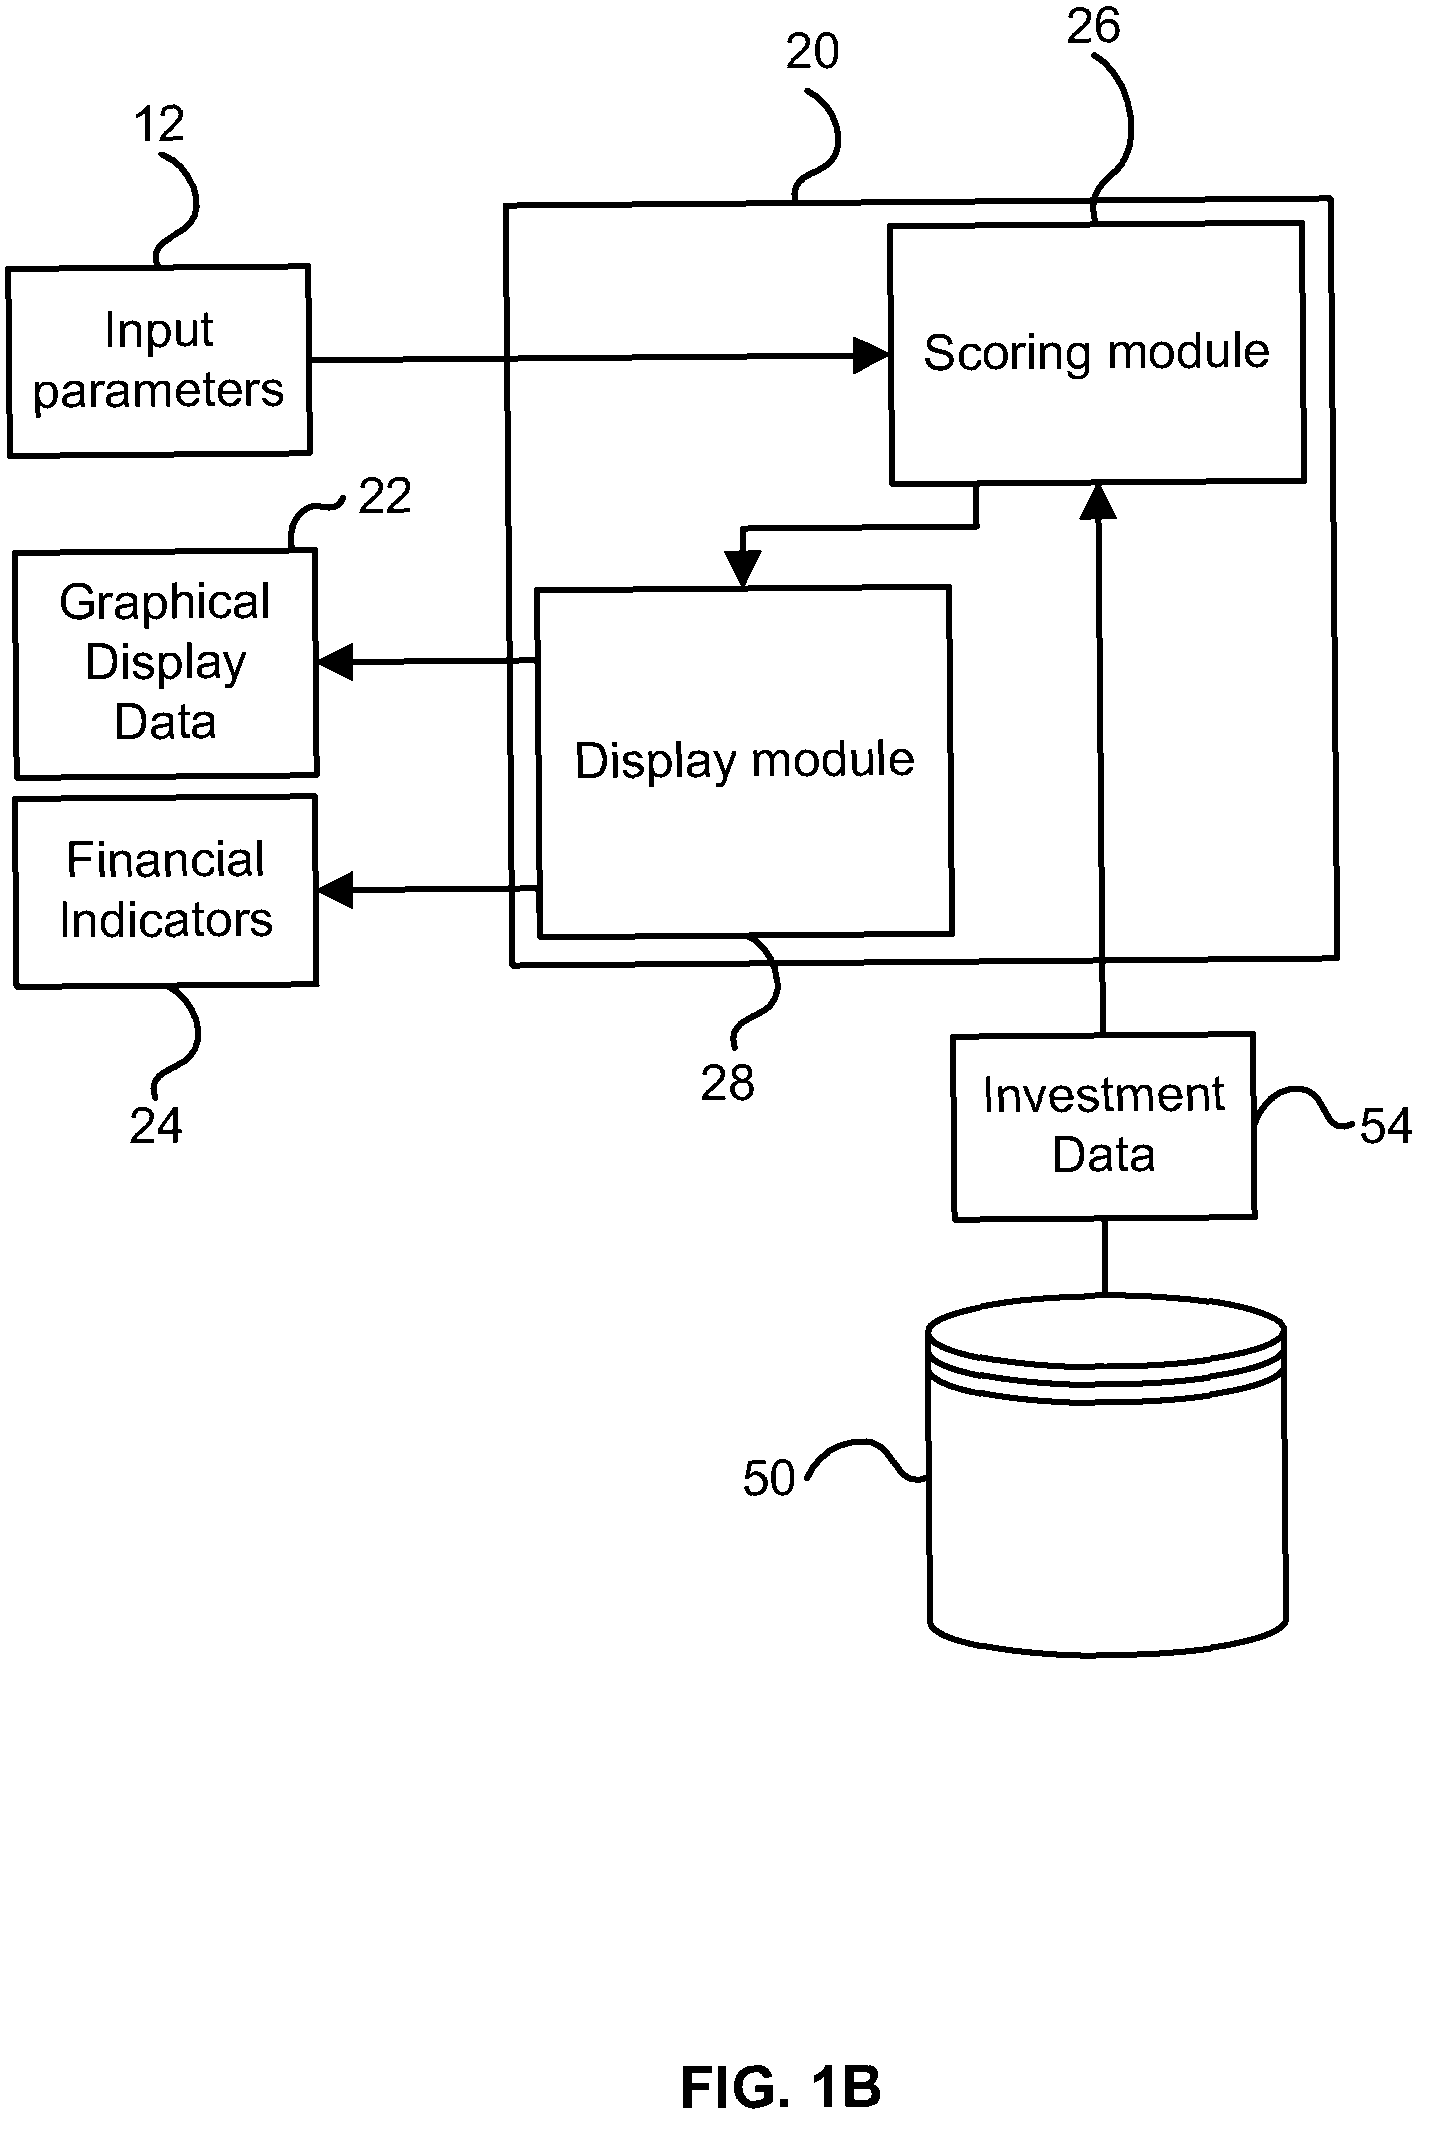
[0022]FIG. 1A illustrates a system for scoring and evaluating financial investments according to an exemplary embodiment of the present invention. The system includes a server 20 accessible by any number of clients 10 (e.g., investors) via a communication network 30 such as the Internet. In some embodiments, the server 20 may be a personal computer that is accessible (via the communications network 30 or directly) by a single client or multiple clients. The system further includes one or more databases 50 including investment data 54 including data and indicators pertaining to a plurality of financial investments such as stocks and securities. The databases 50 provide the system with historical and forecast fundamental and market data for approximately 20,000 or more listed companies worldwide.

[0023]In some embodiments, investment data 54 may be generated or determined by the system or administrators thereof. In preferred embodiments, the investment data 54 is collected from a plura...


PUM


Abstract

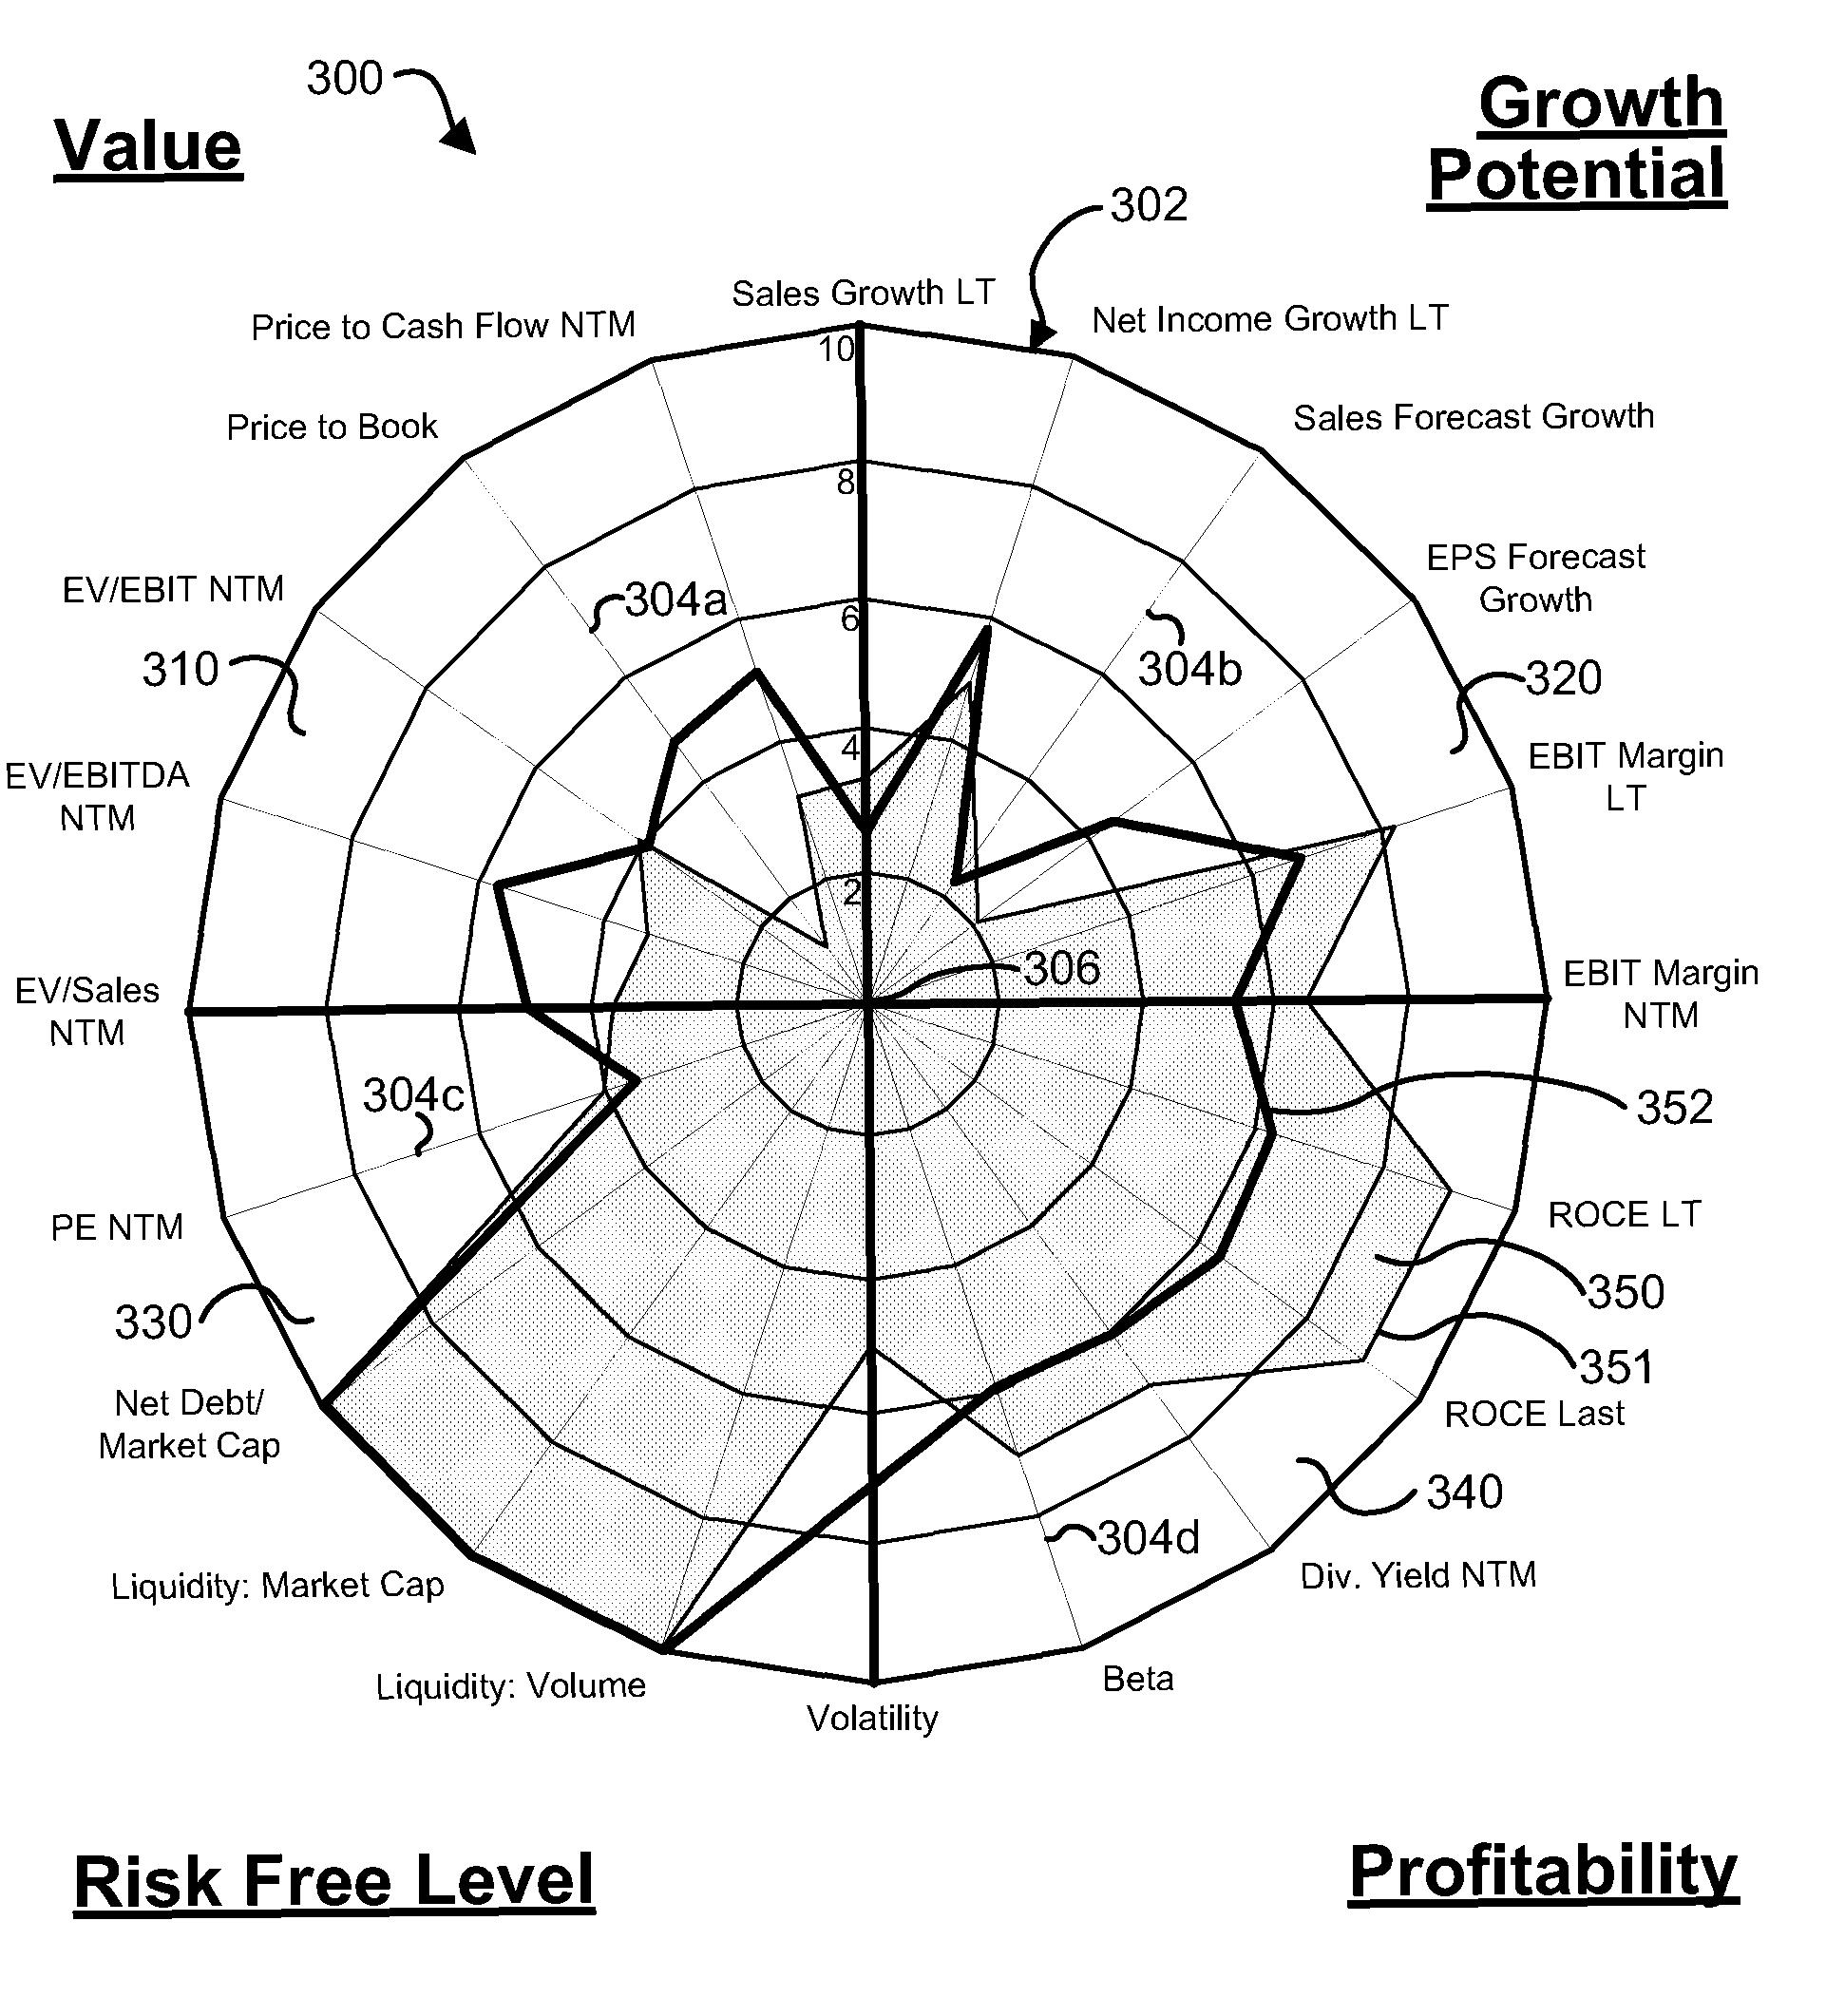
A system for scoring and evaluating financial investments including a server accessible by at least one client, a database including a plurality of financial indicators for a plurality of investments, software executing on the server for generating a score for each of at least a portion of the financial indicators for a target investment relative to a reference set of the investments, software for determining a comparison set including at least one of the plurality investments, software for generating a score for the portion of the financial indicators for the comparison set relative to the reference set, software for generating a display of the scores for the target investment, wherein the display includes a chart including an axis extending radially from a point for each of the portion of the financial indicators, wherein each of the scores is plotted along one of the axes.

Description

CROSS-REFERENCE TO RELATED APPLICATIONS[0001]This application claims priority benefits under 35 §U.S.C. 119(e) of the U.S. Provisional Application No. 61 / 025,528, filed on Feb. 1, 2008 and U.S. Provisional Application No. 61 / 038,203, filed on Mar. 20, 2008, each of which is incorporated herein by reference.FIELD OF THE INVENTION[0002]The disclosure relates to the field of finance and stock investment, and in particular relates to the implementation of a computerized quantitative analysis model and charting system for providing indicators of the relative attractiveness of worldwide stocks using a multi-factor scoring methodology.BACKGROUND OF THE INVENTION[0003]The evaluation of stocks and other financial investments is a complex issue. A number of methods and strategies to rank stocks have been developed but they suffer from a number of limitations. For example, most stock ranking models in the prior art focus on a single approach—being typically growth or value oriented—without tak...

Claims


Application Information

Patent Timeline
Patent Type & Authority Patents(United States)
IPC IPC(8): G06Q40/00
CPCG06Q40/00G06Q40/06
Inventor NAHUM, VINCENT
Owner INFINANCIALS
Learn More