Systems and methods of network visualization

a network visualization and network technology, applied in the field of systems and methods of network visualization, can solve the problems of complex and large supply chain data, difficult to ascertain these relationships and hierarchies, and large complexity of the supply chain

Pending Publication Date: 2021-04-15
KINAXIS INC
View PDF2 Cites 1 Cited by
  • Summary
  • Abstract
  • Description
  • Claims
  • Application Information

AI Technical Summary

Benefits of technology

[0003]The present disclosure relates to systems and methods that provide a visualization of data associated with a network. Rather than representing data in terms of tables, rows and columns, the data is represented as nodes and edges (i.e. relationships between entities). Such a representation of the data is valuable, since it provides a view of the underlying structure of associations between entities. This allows for a deeper analysis of networks, identification of problematic issues, and a quick path to finding root causes of problems.

Problems solved by technology

Supply chain data is complex and large, comprising a large number of entities.
Often, there are complex relationships between these entities, as well as hierarchies among the entities.
Such data is input in tabular form, consisting of rows and columns, making it difficult to ascertain these relationships and hierarchies.
Often, such tabular form is not appropriate for data associated with a network.
It also makes analysis of hotspots in the supply chain complex and cumbersome—thereby leading to potentially disruptive delays.

Method used


Image

  • Systems and methods of network visualization
  • Systems and methods of network visualization
  • Systems and methods of network visualization

Examples


Embodiment Construction

[0040]The present disclosure provides systems and methods to visualize complex relationships within data that is typically stored in, for example, spreadsheets. The data can include any type of hierarchical structure (e.g. Parent / child relationship).

[0041]In some embodiments, the network visualization relies on a visualization framework that allows a dynamic visualization to access data from a table and customize data mappings; a graph visualization library and a hierarchical layout algorithm; and a web browser to render the visualization.

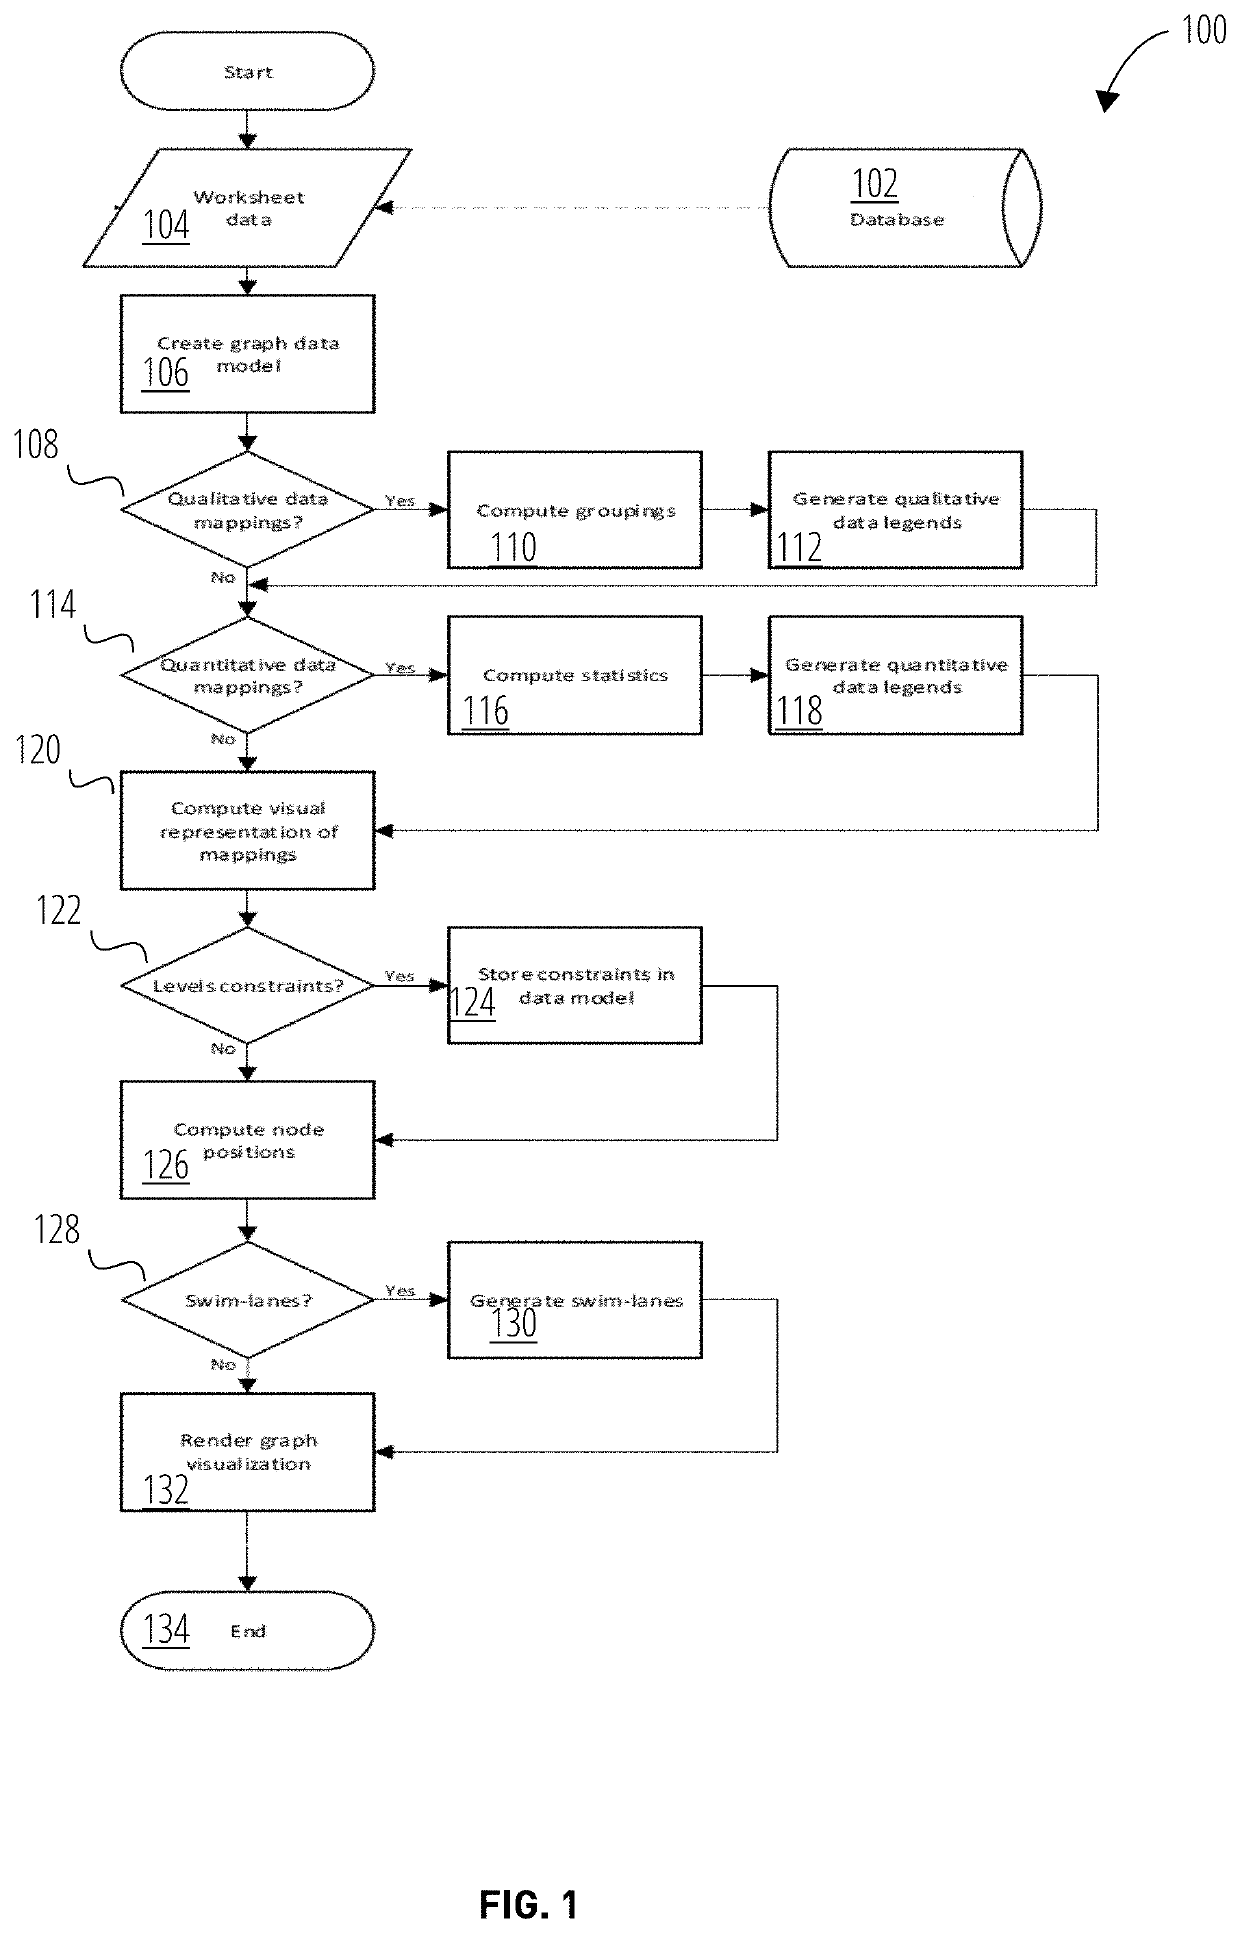
[0042]FIG. 1 illustrates a flowchart 100 in accordance with an embodiment of a network visualization.

[0043]In some embodiments, the network visualization takes as input: a table structure / format that can represent a finite graph for use in one or more computer programs; generates a graph data model comprising a list of source-target edges, with optional node attributes and edge attributes. In some embodiments, the network visualization comprises: a...


PUM


Abstract

Systems and methods that provide visualization of networks. Data is input into a table structure that represents any hierarchy of entities, relationships and their attributes. The content of the table is processed to extract the entities, relationships and their attributes. These are turned into nodes, edges and a visual representation of their attributes using color gradients, categorical colors, shapes, thickness, text labels, etc.

Description

CROSS-REFERENCE TO RELATED APPLICATIONS[0001]This application claims priority on U.S. Provisional application Ser. No. 62 / 913,756 filed Oct. 11, 2019, the disclosure of which is incorporated herein by reference in its entirety.BACKGROUND[0002]Supply chain data is complex and large, comprising a large number of entities. Often, there are complex relationships between these entities, as well as hierarchies among the entities. Such data is input in tabular form, consisting of rows and columns, making it difficult to ascertain these relationships and hierarchies. Often, such tabular form is not appropriate for data associated with a network. It also makes analysis of hotspots in the supply chain complex and cumbersome—thereby leading to potentially disruptive delays.BRIEF SUMMARY[0003]The present disclosure relates to systems and methods that provide a visualization of data associated with a network. Rather than representing data in terms of tables, rows and columns, the data is represe...

Claims


Application Information

Patent Timeline
Patent Type & Authority Applications(United States)
IPC IPC(8): G06F16/901G06Q50/28G06T11/20
CPCG06F16/9024G06T11/206G06Q50/28G06F16/904
Inventor BOUDIN, JEREMIEKHAN, RISHADBLACKMORE, IVYDUNBAR, ANDREW
Owner KINAXIS INC
Why Eureka
Try Eureka