Radio frequency identification functionality coupled to electrically conductive signage

Active Publication Date: 2011-05-10
3M INNOVATIVE PROPERTIES CO
16 Cites 8 Cited by

AI-Extracted Technical Summary

Problems solved by technology

However, the relatively short lifetime of the battery limits the useful life of the tag.
In a...

Abstract

The present disclosure relates to multiple embodiments of a signage having radio-frequency responsive features, methods of making and using the signage, and the performance characteristics of the signage. These embodiments include a cutout, aperture, or opening in an electrically conductive sign into which or adjacent to which is placed an RFID tag or chip.

Application Domain

Electric signal transmission systemsRoad vehicles traffic control +13

Technology Topic

Radio frequencyElectrically conductive +1

Image

  • Radio frequency identification functionality coupled to electrically conductive signage
  • Radio frequency identification functionality coupled to electrically conductive signage
  • Radio frequency identification functionality coupled to electrically conductive signage

Examples

  • Experimental program(8)

Example

EXAMPLE 1
A signage article was made using a plastic substrate onto which was adhered or affixed non-metallized prismatic reflective sheeting. RFID tags (915 MHz) manufactured by Transcore Co. were affixed to one side of each of a variety of plastic substrates having thicknesses ranging from 1/10 inch (2.54 mm) to ½ inch (12.7 mm). Retroreflective Diamond Grade™ nonmetallic sheeting manufactured by 3M Company of St. Paul, Minn. was applied to the other side of each of the plastic substrates. The RFID tag on each of the plastic substrates was successfully read with an Intermec handheld reader at a distance of approximately 30 feet.

Example

EXAMPLE 2
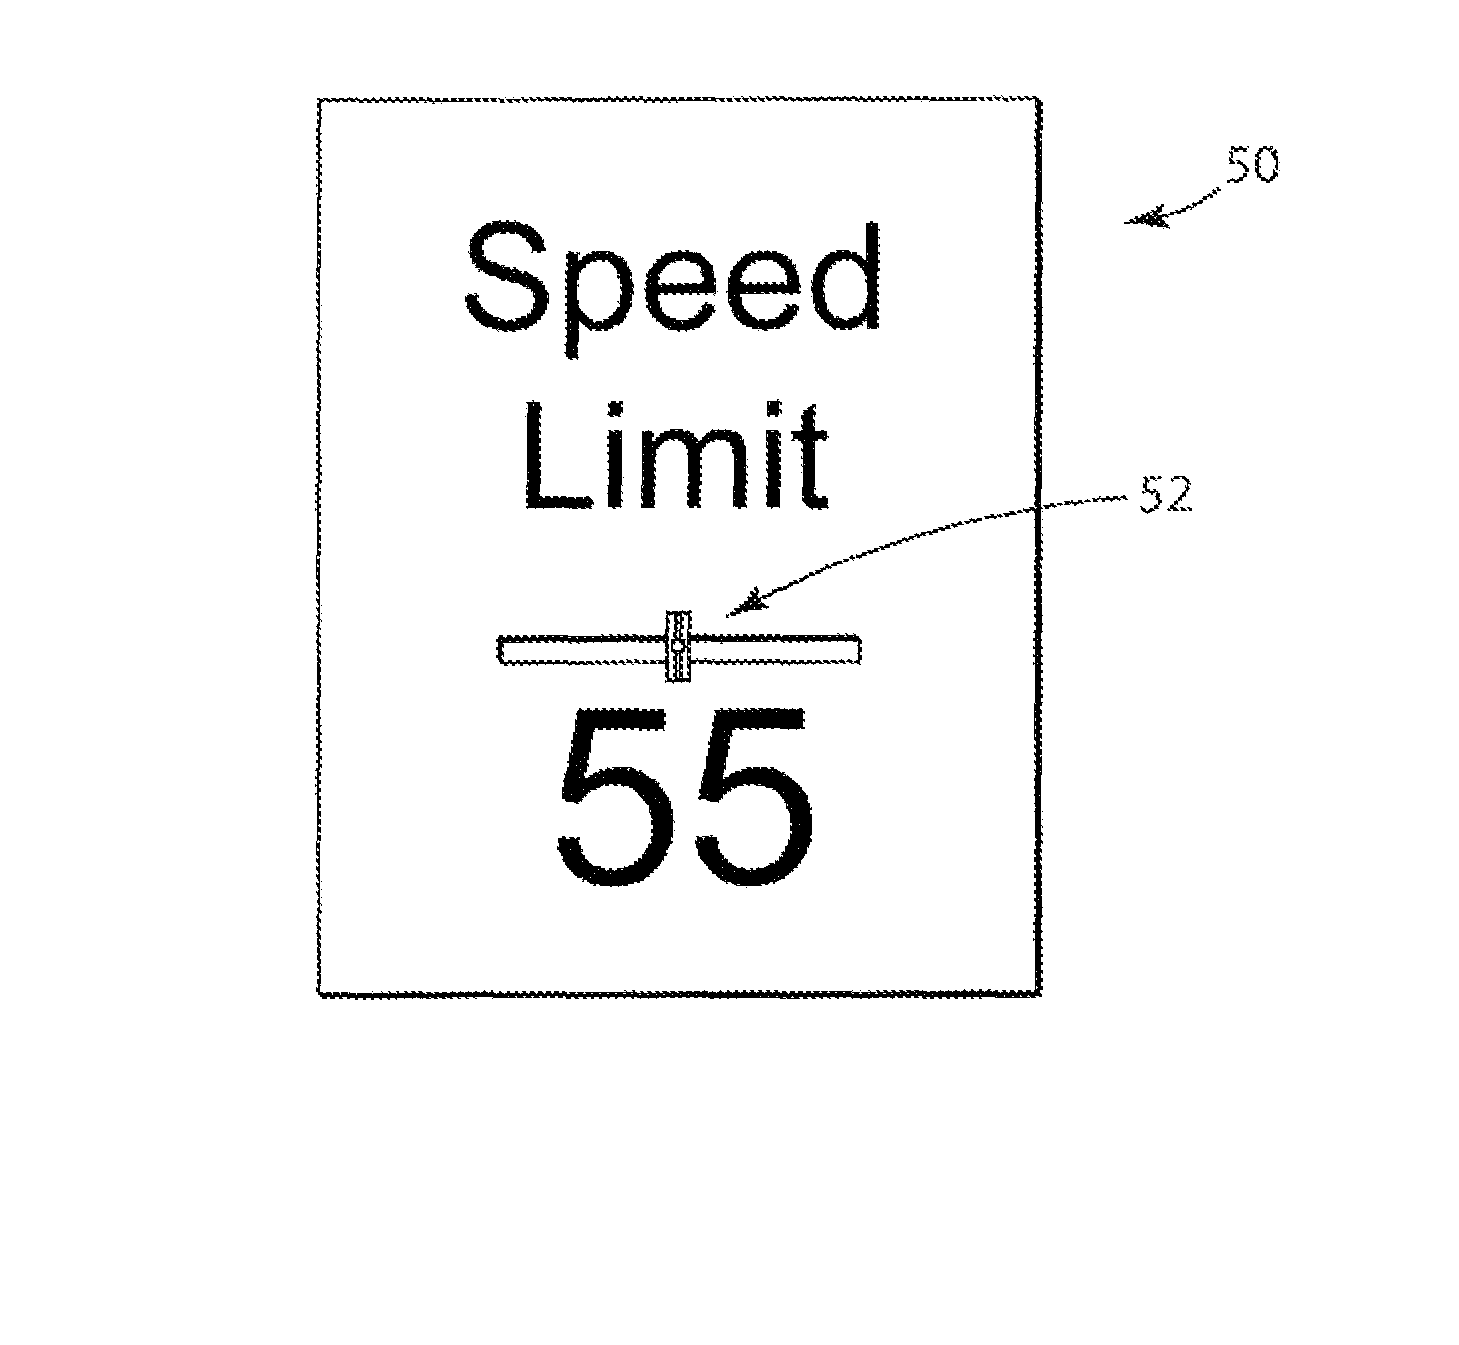
A cutout roughly 0.5 inch (12.7 mm) greater in dimension on all sides than a 2 inch (5.08 cm) by 3 inch (7.62 cm) 915 MHz passive Transcore RFID tag was cut into a 0.08 inch (2.03 mm) thick, 18 inch (45.7 cm) by 24 inch (61 cm) aluminum sign substrate. One of the major surfaces of the sign substrate was covered with retroreflective Diamond Grade™ sheeting manufactured by 3M Company of St. Paul, Minn. The RFID tag was placed into the cutout. A plastic plug having a thickness and shape that approximately matched the thickness and shape of the removed sign substrate was placed into the cutout such that the plastic plug was positioned adjacent to the RFID tag. Thus the plastic plug was substantially similar in size and shape to a size and shape of the cutout. A piece of non-metallic tape was placed on the backside of the sign substrate such that it completely covered the cutout and was positioned adjacent to the plastic plug. The RFID tag was successfully read with an Intermec handheld reader at a distance of approximately 30 feet, a distance comparable to the nonconductive RFID signage articles as described in Example 1.
Additionally, the inventors of the present application determined that by carefully controlling or selecting the location of the cutout, opening, or aperture and/or the RFID tag within the cutout, opening, or aperture on the signage, one can control or tailor the radiation pattern of the RFID tag. The term “location” includes, for example, the position of the cutout, opening, or aperture on the signage as well as the placement of the RFID tag within the signage or the RFID integrated circuit across the cutout, opening, or aperture. Controlling the radiation pattern can facilitate direction of radiation from the signage toward the roadway and can reduce the amount of radiation that is directed in an unwanted or unproductive direction.
FIG. 7 depicts the location of each of the various cutouts that were cut from various plates for testing the effects of the cutout location. Cutouts 1 through 5 were used to investigate the effect of moving the minor (shorter) edge of the cutout toward the vertical edge of the metal sheet. Cutouts A through I were used to investigate the effect of moving the major (longer) edge of the cutout toward the horizontal edge of the metal sheet. Cutout A is the same as cutout 1.
FIGS. 8A, 8B, 8C, and 8D pictorially show how the thirteen cutout locations shown in FIG. 7 were implemented in four separate pieces of metal plate. The plate of FIG. 8A includes cutout locations A/1, E, and H. The plate of FIG. 8B includes cutout locations D, 2, and G. The plate of FIG. 8C includes cutout locations C, 3, 5, and F. The plate of FIG. 8D includes cutout locations 4, B, and I.
Each cutout was 4.5 inches (11.4 cm) long and 1 inch (2.54 cm) high. The metal plate was a 12 inches (30.48 cm) by 12 inches (30.48 cm) metal plate cut from ⅛ inch (0.317 cm) aluminum stock. During testing, a 915 MHz RFID tag ((a 4 inch long (10.16 cm) and ½ inch (1.27 cm) high Squiggle™ RFID tag manufactured by Alien Co.)) was placed in the center of one of the cutouts located in a single metal plate. The unused cutouts on each metal plate being tested were covered with copper tape during testing of a particular cutout. When cutouts 1 through 5 were tested, the metal plate was rotated about the y-axis (as shown in FIG. 7) with 90 degrees being normal to the plate and 0 degrees being off the left side of the plate. When cutouts A through I were tested, the metal plate was rotated about the x-axis (as shown in FIG. 7) with 90 degrees being normal to the plate and 0 degrees being off the top edge of the plate. The read performance of each plate was measured by placing an attenuator in between an RFID reader and a reader antenna. The attenuation was increased in 1 dB increments until the tag could no longer be read. This testing was performed in an anechoic chamber at a fixed distance between the circularly polarized reader antenna and the metal plate including the RFID tag.
FIG. 9 shows the effective radiation pattern of an RFID tag positioned in cutouts A, C, E, G, and I. The effective radiation pattern of an RFID tag positioned in cutouts B, D, F, and H was not tested. FIG. 9 shows that the radiation pattern for an RFID tag in a cutout near the center of the plate (e.g., cutouts A and C) is nearly symmetrical about 90 degrees (nearly normal to the plate). As the cutout location is moved toward the top of the plate (e.g., cutouts E and G), the radiation pattern shifts away from 90 degrees towards 120 degrees. For cutout I, the radiation pattern is maximum at 15 degrees, nearly off the edge of the plate.
These results allowed the present inventors to conclude that by controlling the placement of the cutout and RFID tag, one could create a sign including RFID functionality that was tailored for its intended placement and use. In other words, by controlling the spacing between the edge of the metal plate and the major side/surface of the cutout, the radiation pattern could be controlled. For example, a sign could be created that was best read from a location at an off-angle by placing the cutout and RFID tag toward the edge of the metal plate, e.g., at the cutout I location. Alternatively, a sign could be created that was best read from a location normal to the sign by placing the cutout and RFID tag toward the middle of the metal plate, e.g., at the cutout A/1 location.
FIG. 10 shows the effective radiation pattern of cutouts 1 through 5. All of these cutouts resulted in a maximum radiation that is normal to the plate at about 90 degrees. Thus, controlling the location between the minor side of the cutout and the plate edge did not appear to be an effective method of controlling the effective radiation pattern.
As was described above, the performance results shown in FIGS. 9 and 10 are based on a metal sign in which the RFID tag is centered in the cutout (centered along the x-axis and the y-axis and the z-axis of the cutout). Based on the fact that the metal plate was ⅛ inch (0.317 cm) thick, this meant that the RFID tag was positioned at approximately 1/16 inch (0.15 cm) from each major surface (the front and back surfaces) of the metal plate.
FIG. 11 shows the effect of having the RFID tag centered along the x-axis and y-axis of the cutout (at position A/1) but at different locations along the z-axis of the cutout. In other words, the RFID tag was placed at different thicknesses within cutout A/1. The results shown in FIG. 11 allowed the present inventors to conclude that when the tag is centered within the thickness of cutout A/1 (or along the z-axis), the tag performs about 6 dB better from the front of the plate than if the tag is flush with the back of the metal plate. This effect can be used to control the radiation pattern. For example, if the tag is centered within the cutout (along the z-axis), then the tag will radiate fairly well normal to both the front and the back of the metal plate (or sign). If the tag is flush with the front of the metal plate (or sign), the tag will radiate better off of the front of the plate than off of the back of the plate. If the tag is flush with the back of the metal plate (or sign), the tag will radiate better off of the back of the plate than off of the front of the plate.

Example

EXAMPLE 3
The following example was modeled to determine the effect of changing the y dimension of the cutout with the tag centered in the x and y dimensions with respect to the metal plate and located flush with the front of the plate (along the z dimension). A 4.5 inches (11.43 cm) long and 3.5 inches (8.89 cm) high cutout in position A (as described above) was modeled in a metal plate measuring 12 inches (30.48 cm) by 12 inches (30.48 cm) and made of ⅛ inch (0.137 cm) aluminum stock. The cutout used for this model was identical to cutout A except that the y dimension was made to be 3.5 inches (8.89 cm) by moving the upper edge of the cutout upward. The results are shown in FIG. 12. FIG. 12 shows that when the y dimension of the cutout is enlarged, the radiation pattern changes with a reduction in directivity. Thus the size of the cutout can be used to change or optimize the radiation pattern.

PUM

PropertyMeasurementUnit
Thickness1.27E-5m
Thickness
Electrical conductivity

Description & Claims & Application Information

We can also present the details of the Description, Claims and Application information to help users get a comprehensive understanding of the technical details of the patent, such as background art, summary of invention, brief description of drawings, description of embodiments, and other original content. On the other hand, users can also determine the specific scope of protection of the technology through the list of claims; as well as understand the changes in the life cycle of the technology with the presentation of the patent timeline. Login to view more.
Why Eureka
Try Eureka