Methods and apparatus for automated predictive design space estimation

a technology of design space and method, applied in adaptive control, process and machine control, instruments, etc., can solve the problems of inability to automatically provide for acceptable regions, increased complexity of manufacturing processes, and increased difficulty in meeting process and material specifications

Active Publication Date: 2011-12-27
SARTORIUS STEDIM DATA ANALYTICS AB
View PDF7 Cites 1 Cited by
  • Summary
  • Abstract
  • Description
  • Claims
  • Application Information

AI Technical Summary

Benefits of technology

[0015]In another embodiment, calculating the modified range of input values for each of the one or more input factors further includes the following steps: determining each of the one or more input factors are associated with a completion flag, reducing a step size used to select the second range of input values by a predetermined percentage, and for each of the one or more input factors of the one or more input factors: selecting a third range of input values by expanding the second range of input values by the step size, predicting values of the one or more output responses based on the third range of input values to determine a third performance metric for each of the one or more output responses, and creating the modified range of input values for the input factor by adjusting the third range of input values based on a comparison of the third performance metric and the predetermined performance metric.
[0021]The techniques, which include both methods and apparatuses, described herein can provide the advantages of automating a process for defining a largest region of variability for each input factor, and predicting a distribution of output response values for each output response with a given level of probability. The largest regions of variability and the distributions of output response values can be presented in a way to incorporate all the different criteria under consideration in an efficient and correct way. The principles described herein can handle many output responses simultaneously with different prediction models for design space estimates, which can be handled in combination with expansion criteria. Additionally, constraints for the input factors and / or the output responses can be incorporated into the prediction models.

Problems solved by technology

However, as device geometries shrink to the nanometer scale, complexity in manufacturing processes increases, and process and material specifications become more difficult to meet.
There is no way to automatically provide for acceptable regions of variability of each input factor, or to predict result regions.
The analysis process is further complicated when several demands on the output responses have to be met at the same time with different types of constraints.

Method used


Image

  • Methods and apparatus for automated predictive design space estimation
  • Methods and apparatus for automated predictive design space estimation
  • Methods and apparatus for automated predictive design space estimation

Examples


Embodiment Construction

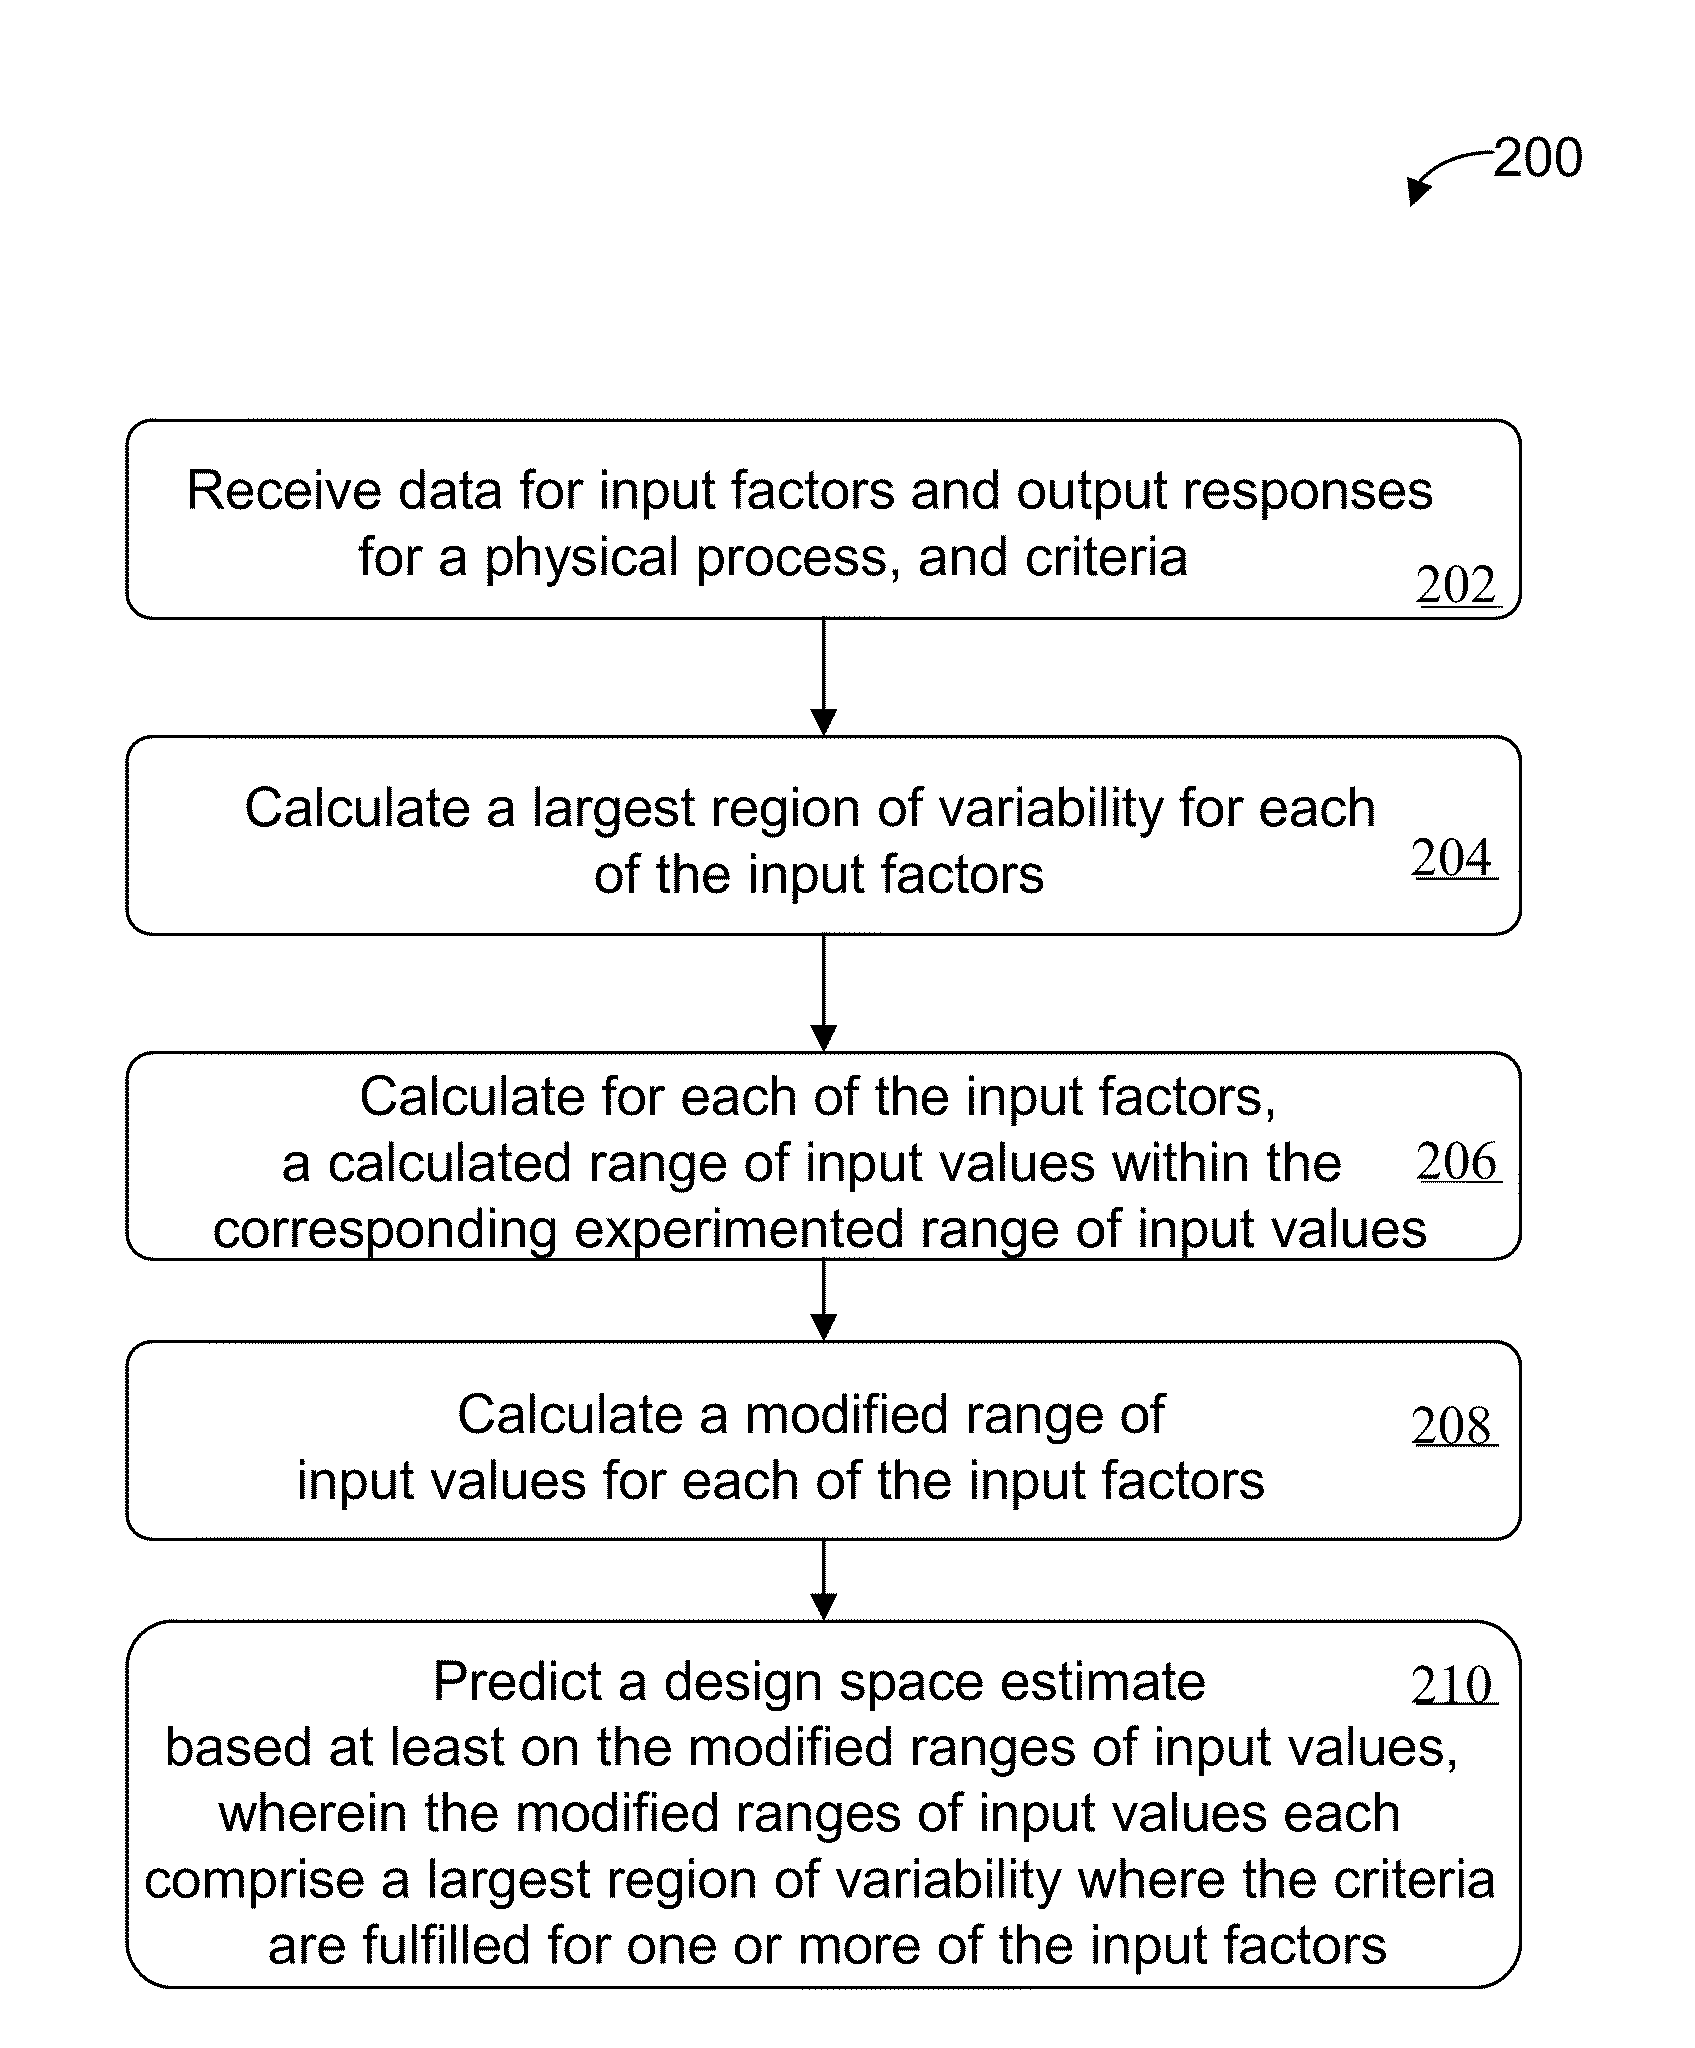
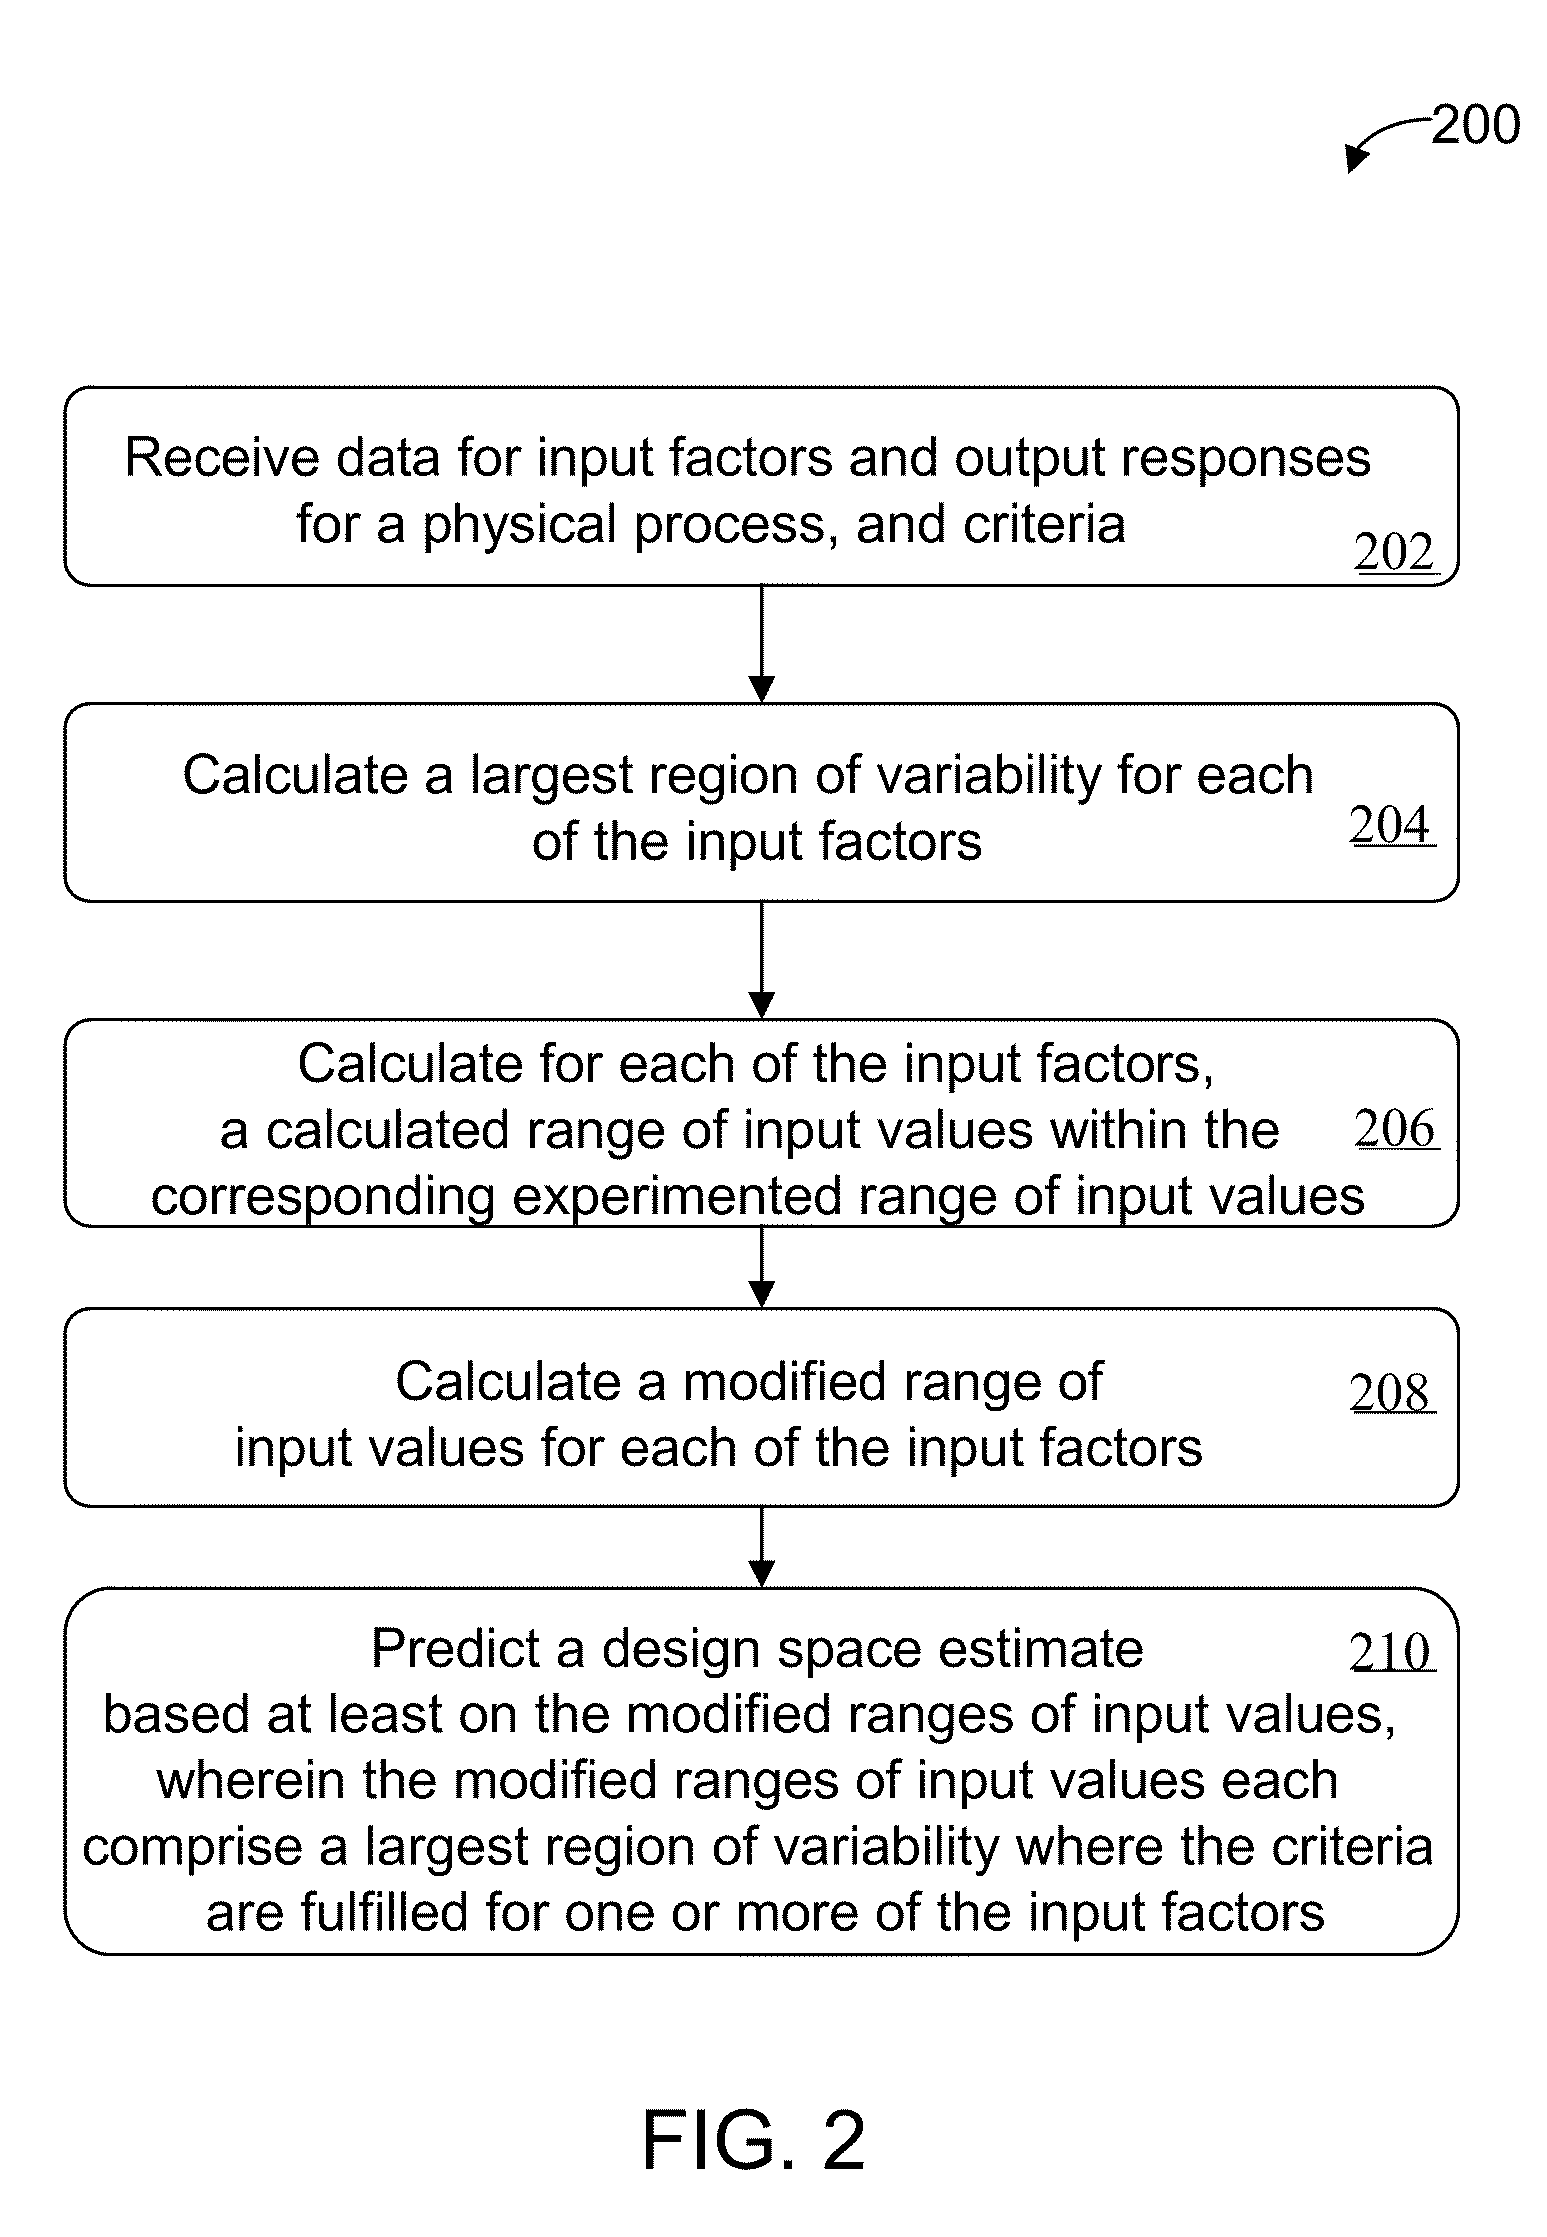
[0036]In some exemplary embodiments of the invention, a predictive design space estimate (PDSE) is determined for a physical process (e.g., a manufacturing process, industrial process, or a design project) based on input factors, output responses, and various criteria associated with the input factors and / or the output responses. The PDSE includes a distribution of output response values for each of the one or more output responses. The PDSE also includes one or more largest regions of variability for each input factor. In some embodiments, the PDSE includes an individual largest region of variability and a combined largest region of variability for each input factor, both of which are calculated based on the distribution of output response values to satisfy the criteria associated with the input factors and / or the output responses.

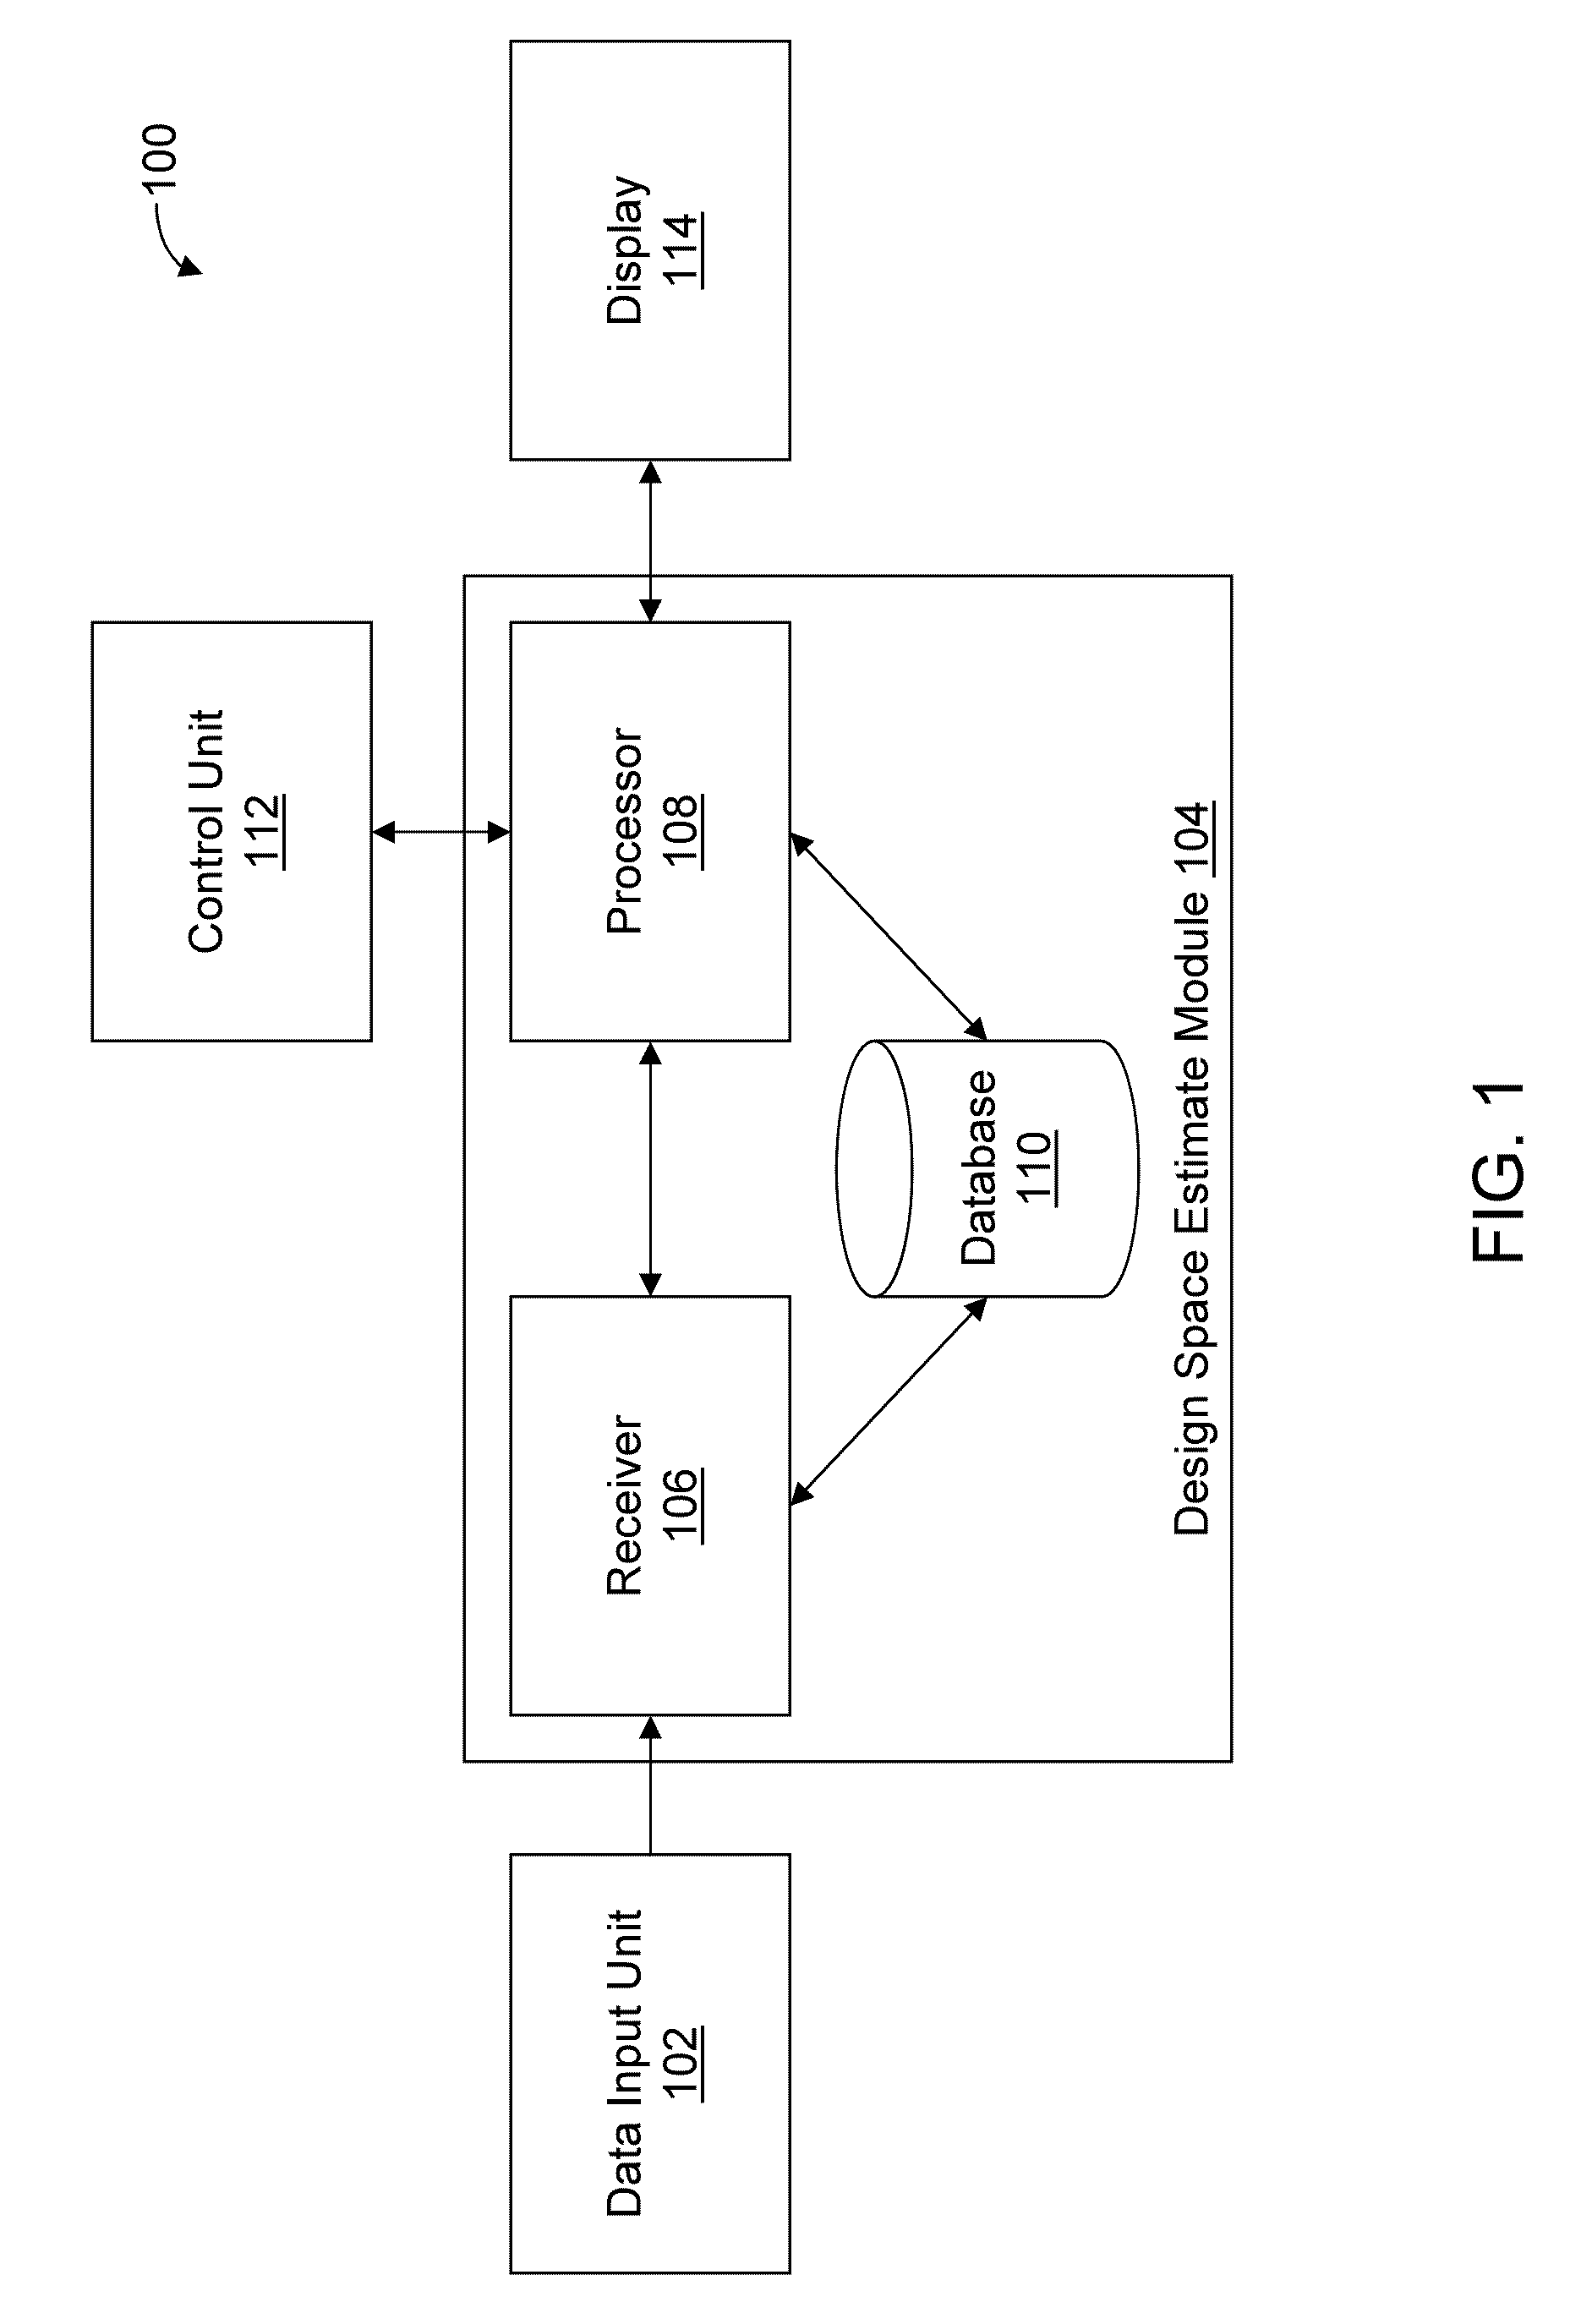
[0037]FIG. 1 is a schematic illustration of a system 100 for performing automated predictive design space estimate, according to an illustrative embodime...


PUM


Abstract

Described are computer-based methods and apparatuses, including computer program products, for automated predictive design space estimation. A design space of input factors and output responses is estimated for a physical process. Data is received for one or more input factors for a physical process, one or more output responses for the process, and criteria. For each of the one or more input factors, a calculated range of input values within the corresponding experimented range of input values is calculated. A modified range of input values is calculated for each of the one or more input factors. A design space estimate is predicted based at least on the modified ranges of input values, wherein the modified ranges of input values each comprise a largest region of variability for one or more of the input factors where the criteria are fulfilled.

Description

FIELD OF THE INVENTION[0001]The present invention relates generally to computer-based methods and apparatuses, including computer program products, for automated predictive design space estimation.BACKGROUND[0002]In the pharmaceutical industry, the adoption of quality by design (QbD) has been an evolving process. QbD refers to a systematic process to build quality into a product from the inception to the final output. Specifically, QbD refers to the level of effectiveness of a design function in determining a product's operational requirements (and their incorporation into design requirements) that can be converted into a finished product in a production process. This is often referred to as a design space, which is the multidimensional combination and interaction of input factors (e.g., material attributes) that have been demonstrated to provide assurance of quality. For example, for a manufacturing process a design space is the set of possible designs and design parameters (input ...

Claims


Application Information

Patent Timeline
Patent Type & Authority Patents(United States)
IPC IPC(8): G05B13/02G06G7/48G06F19/00
CPCG06F17/50G06F30/00
Inventor WIKSTROM, ERNST CONNYSUNDSTROM, HANS GEORG JOAKIMNORDAHL, TORD .ANG.KE BORJE
Owner SARTORIUS STEDIM DATA ANALYTICS AB
Why Eureka
Try Eureka