Graphical risk-based performance measurement and benchmarking system and method

a risk-based performance and benchmarking technology, applied in the field ofgraphical risk-based performance measurement and benchmarking system and method, can solve the problems of difficult to determine the effects of non-applicable external and internal factors, complicated measurement of quantitative change in industrial processes, etc., and achieve the effect of easy identification of movement and subsequent changes and easy understanding

Inactive Publication Date: 2012-07-17
HSB SOLOMON ASSOCS
View PDF5 Cites 1 Cited by
  • Summary
  • Abstract
  • Description
  • Claims
  • Application Information

AI Technical Summary

Benefits of technology

[0007]The concept of risk is applied to address the problem of measuring performance. Risk, defined as future's uncertainty, can be modeled in industrial performance settings as the product of process or equipment incident frequency and incident severity. An incident is a loss event that may be a failure event, such as a breakdown, or a non-failure event, such as a planned shutdown. Risk is an abstract quantity in the sense it is subjectively interpreted and valued differently between individuals or groups. A graphical depiction of the mathematical calculation of risk as a function of its two components (incident frequency and incident severity) enables the communication of the basic information in a visual framework that is more easily understood by a wide range of constituents. The visual framework enables readers to easily identify movement and subsequent changes in frequency, severity, and risk from visual inspection of the graphs. Even though the same information can be obtained from numerical tables, for most people, reviewing a visual plot is easier than studying process changes reflected in columns of numbers.

Problems solved by technology

However, a problem in the art exists, since no systems or methods are known prior to the invention disclosed herein, which effectively quantifies performance improvements, such as reliability and production.
In practice, measuring quantitative change in industrial processes is complicated by the concomitant effects of external and internal factors that are simply part of what is occurring at the facility or facilities undergoing the performance improvement activities.
Since no general method exists to censor non-relevant factors, determining the effects of non-applicable external and internal factors is a challenge.

Method used


Image

  • Graphical risk-based performance measurement and benchmarking system and method
  • Graphical risk-based performance measurement and benchmarking system and method
  • Graphical risk-based performance measurement and benchmarking system and method

Examples


Embodiment Construction

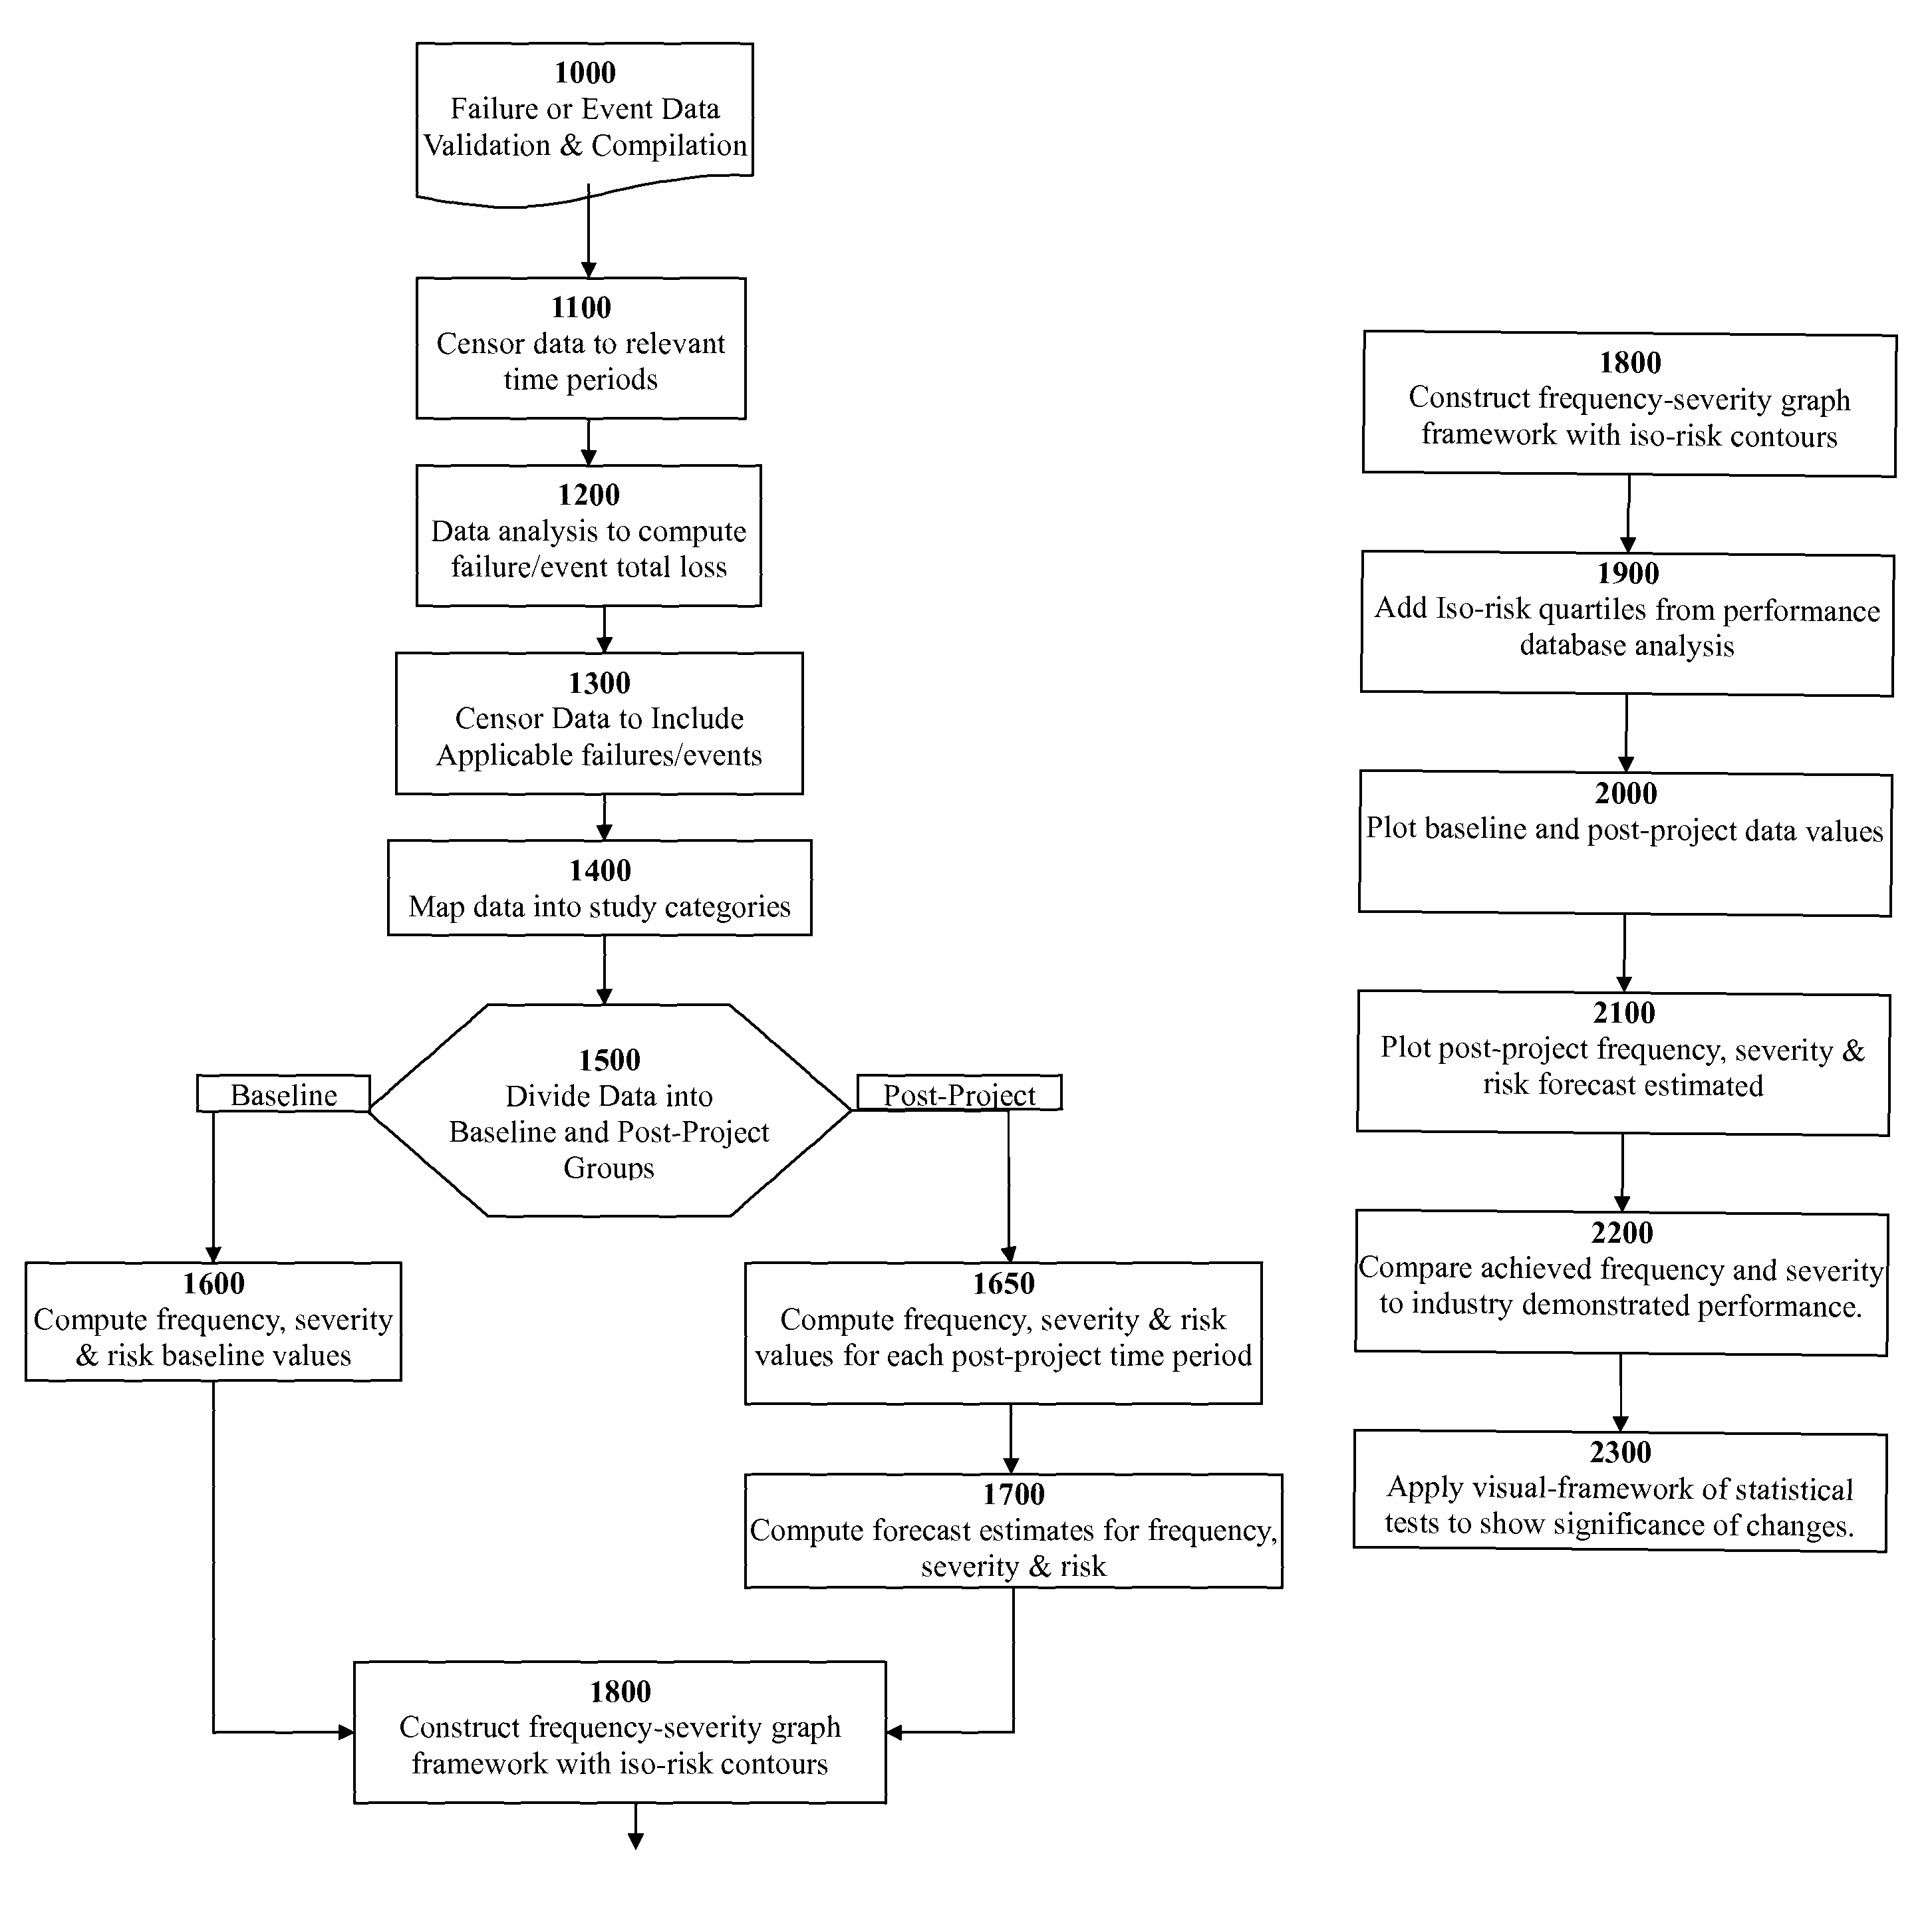
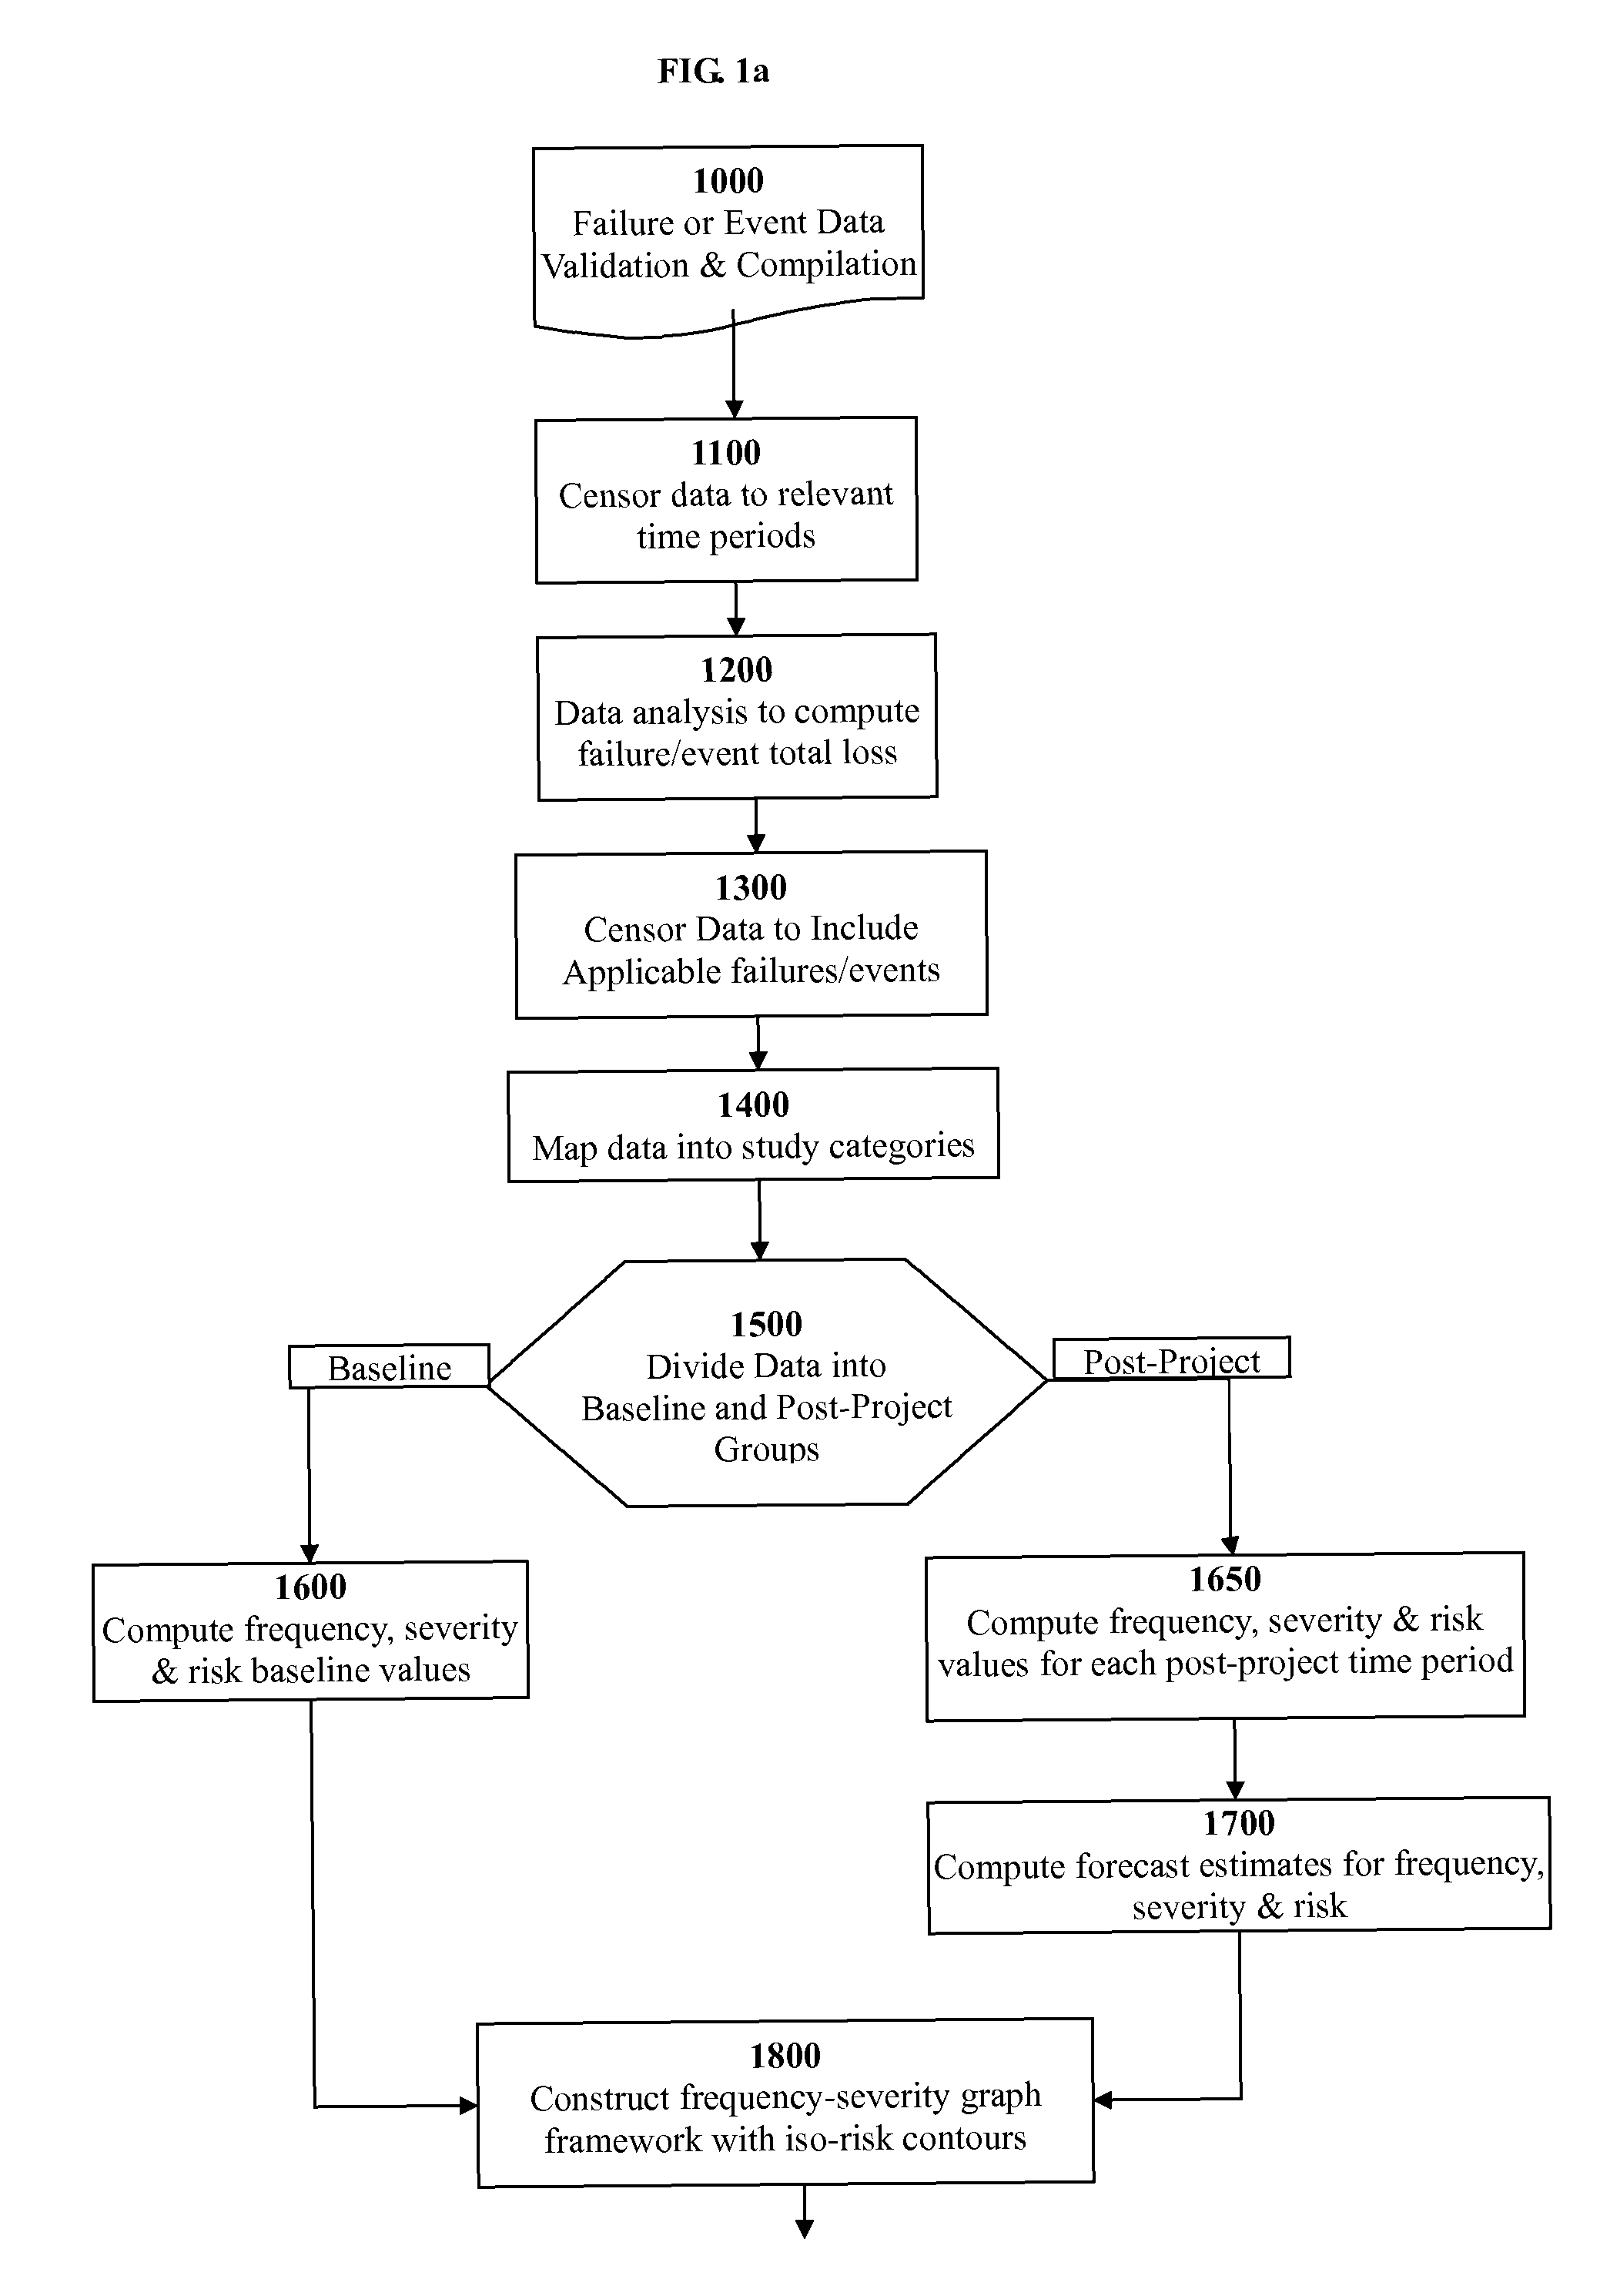
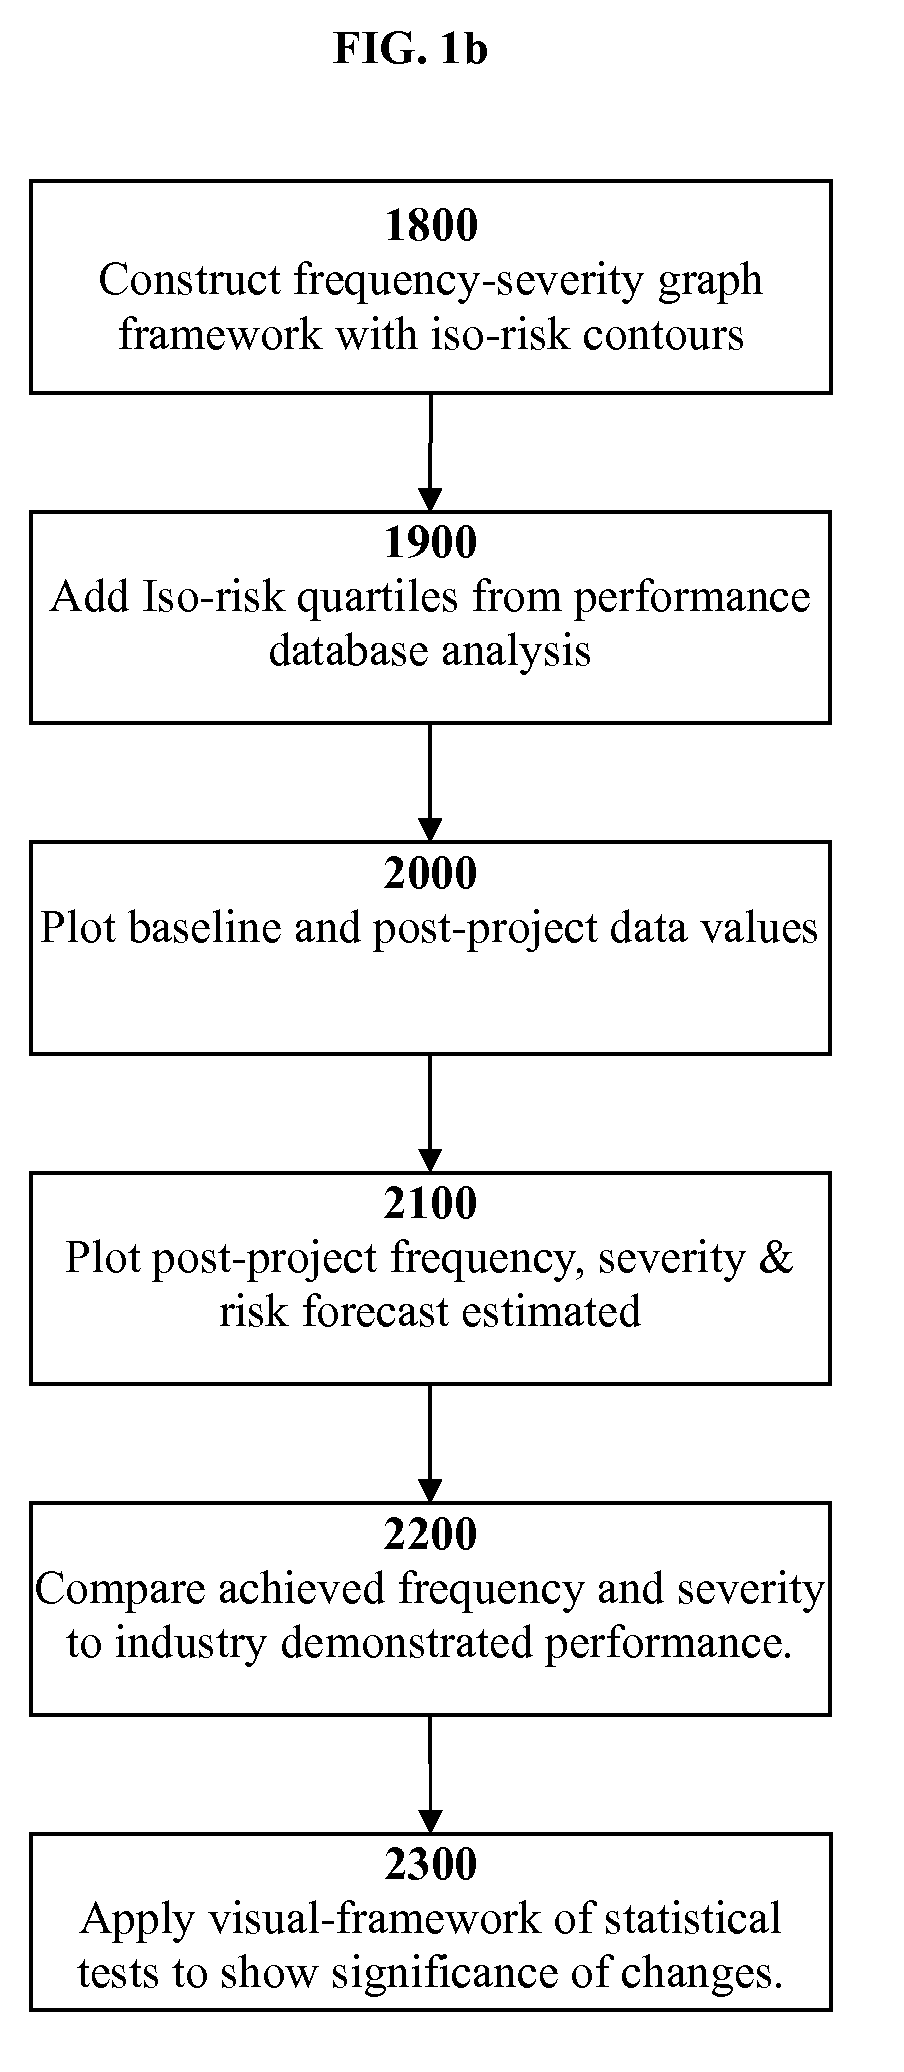
[0026]In FIGS. 1a and 1b, the Graphical Risk-Based Performance Measurement and Benchmarking System according to a preferred embodiment are shown. Incident data 1000 that contains information on the data or time of loss, the type of loss, and the amount of loss measured in dollars or other units (such as equivalent distillation capacity in the refining industry, or as percent of capacity in any manufacturing facility) is compiled into a pre-analysis file. This compilation then undergoes a data validation process that ensures accurate information is being entered into the System.

[0027]The dataset is then censored 1100 to only include incidents that occur during specific, pre-determined time periods. The first time period is called the “baseline” or “pre-installation” time interval. This refers the interval of time that performance will be measured a priori automation improvements as a benchmark to measure changes. The subsequent time period is called “post-project” or “post-installati...


PUM


Abstract

A system and method provides analysis of pre- and post-project effects on frequency and severity of operational loss. The method includes the computation of the frequency of incidents and the severity of incidents for equipment based on recorded incident data. Risk, a function of frequency and severity, is calculated before and after a project to determine if the project has changed the risk of an incident in a piece of equipment or facility and if the project has changed the nature of risk (i.e. increasing severity while decreasing frequency). The method may be used to compute forecast estimates of future operational losses, assess goals for improving current performance relative to demonstrated industry performance, and determine statistical confidence intervals of forecast such that risk, and changes in risk, may be visually quantified and communicated.

Description

CROSS-REFERENCE TO RELATED APPLICATIONS[0001]This application claims the benefit of U.S. Provisional Application Ser. No. 60 / 961,179, filed Jul. 19, 2007, which is incorporated by reference in its entirety.BACKGROUND OF THE INVENTION[0002]1. Field of the Invention[0003]The invention relates to a system and method for comparative operational performance analysis and benchmarking and in a preferred embodiment to the analysis and benchmarking of the operational effects of automation utilizing a two-dimensional graphical depiction of risk that visualizes changes in performance frequency, severity, and risk.[0004]2. Background Summary[0005]In the fields of automation and advanced process controls, technological advances often result in the commercialization of new products that will presumably provide reliability and production savings. In addition, certain changes in operational procedures, training, and maintenance practices implemented at industrial facilities can have similar perform...

Claims


Application Information

Patent Timeline
Patent Type & Authority Patents(United States)
IPC IPC(8): G06Q10/00
CPCG06Q10/00G06Q10/06313G06Q10/0635G06Q10/0639G06Q10/06393G06Q30/0203Y02P90/80
Inventor JONES, RICHARD B.HAVENER, JOHN P.
Owner HSB SOLOMON ASSOCS
Why Eureka
Try Eureka