Graphical risk-based performance measurement and benchmarking system and method
- Summary
- Abstract
- Description
- Claims
- Application Information
AI Technical Summary
Benefits of technology
Problems solved by technology
Method used
Image
Examples
Embodiment Construction
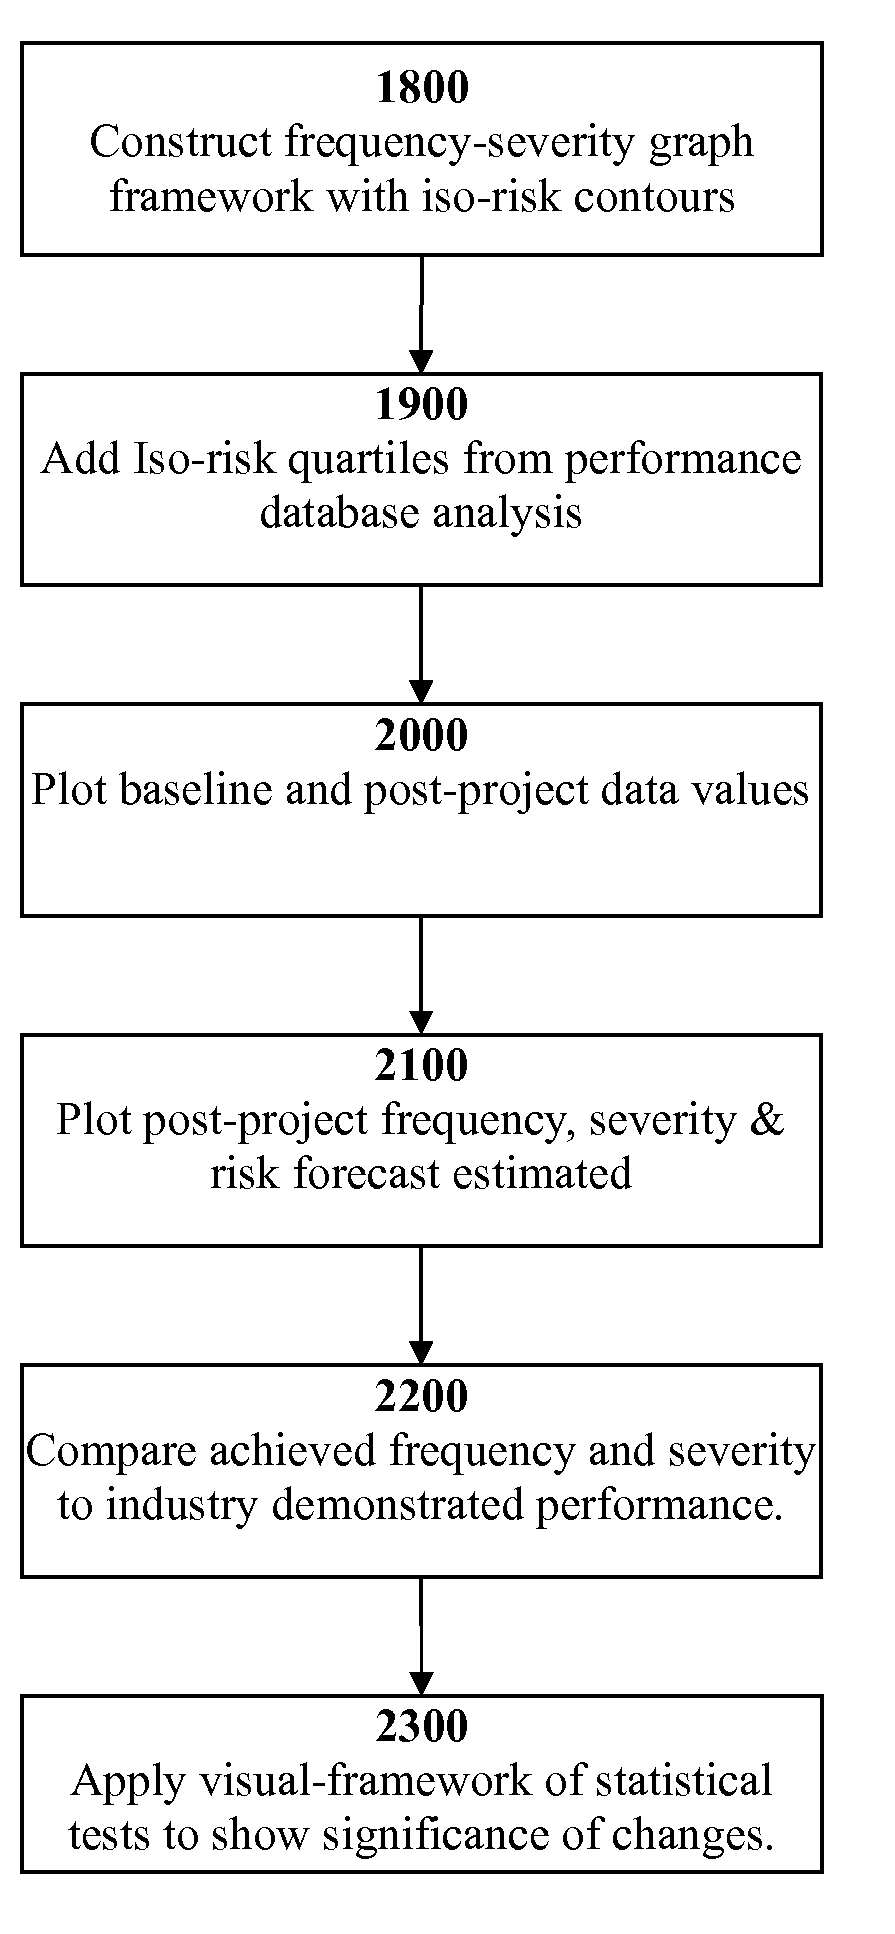
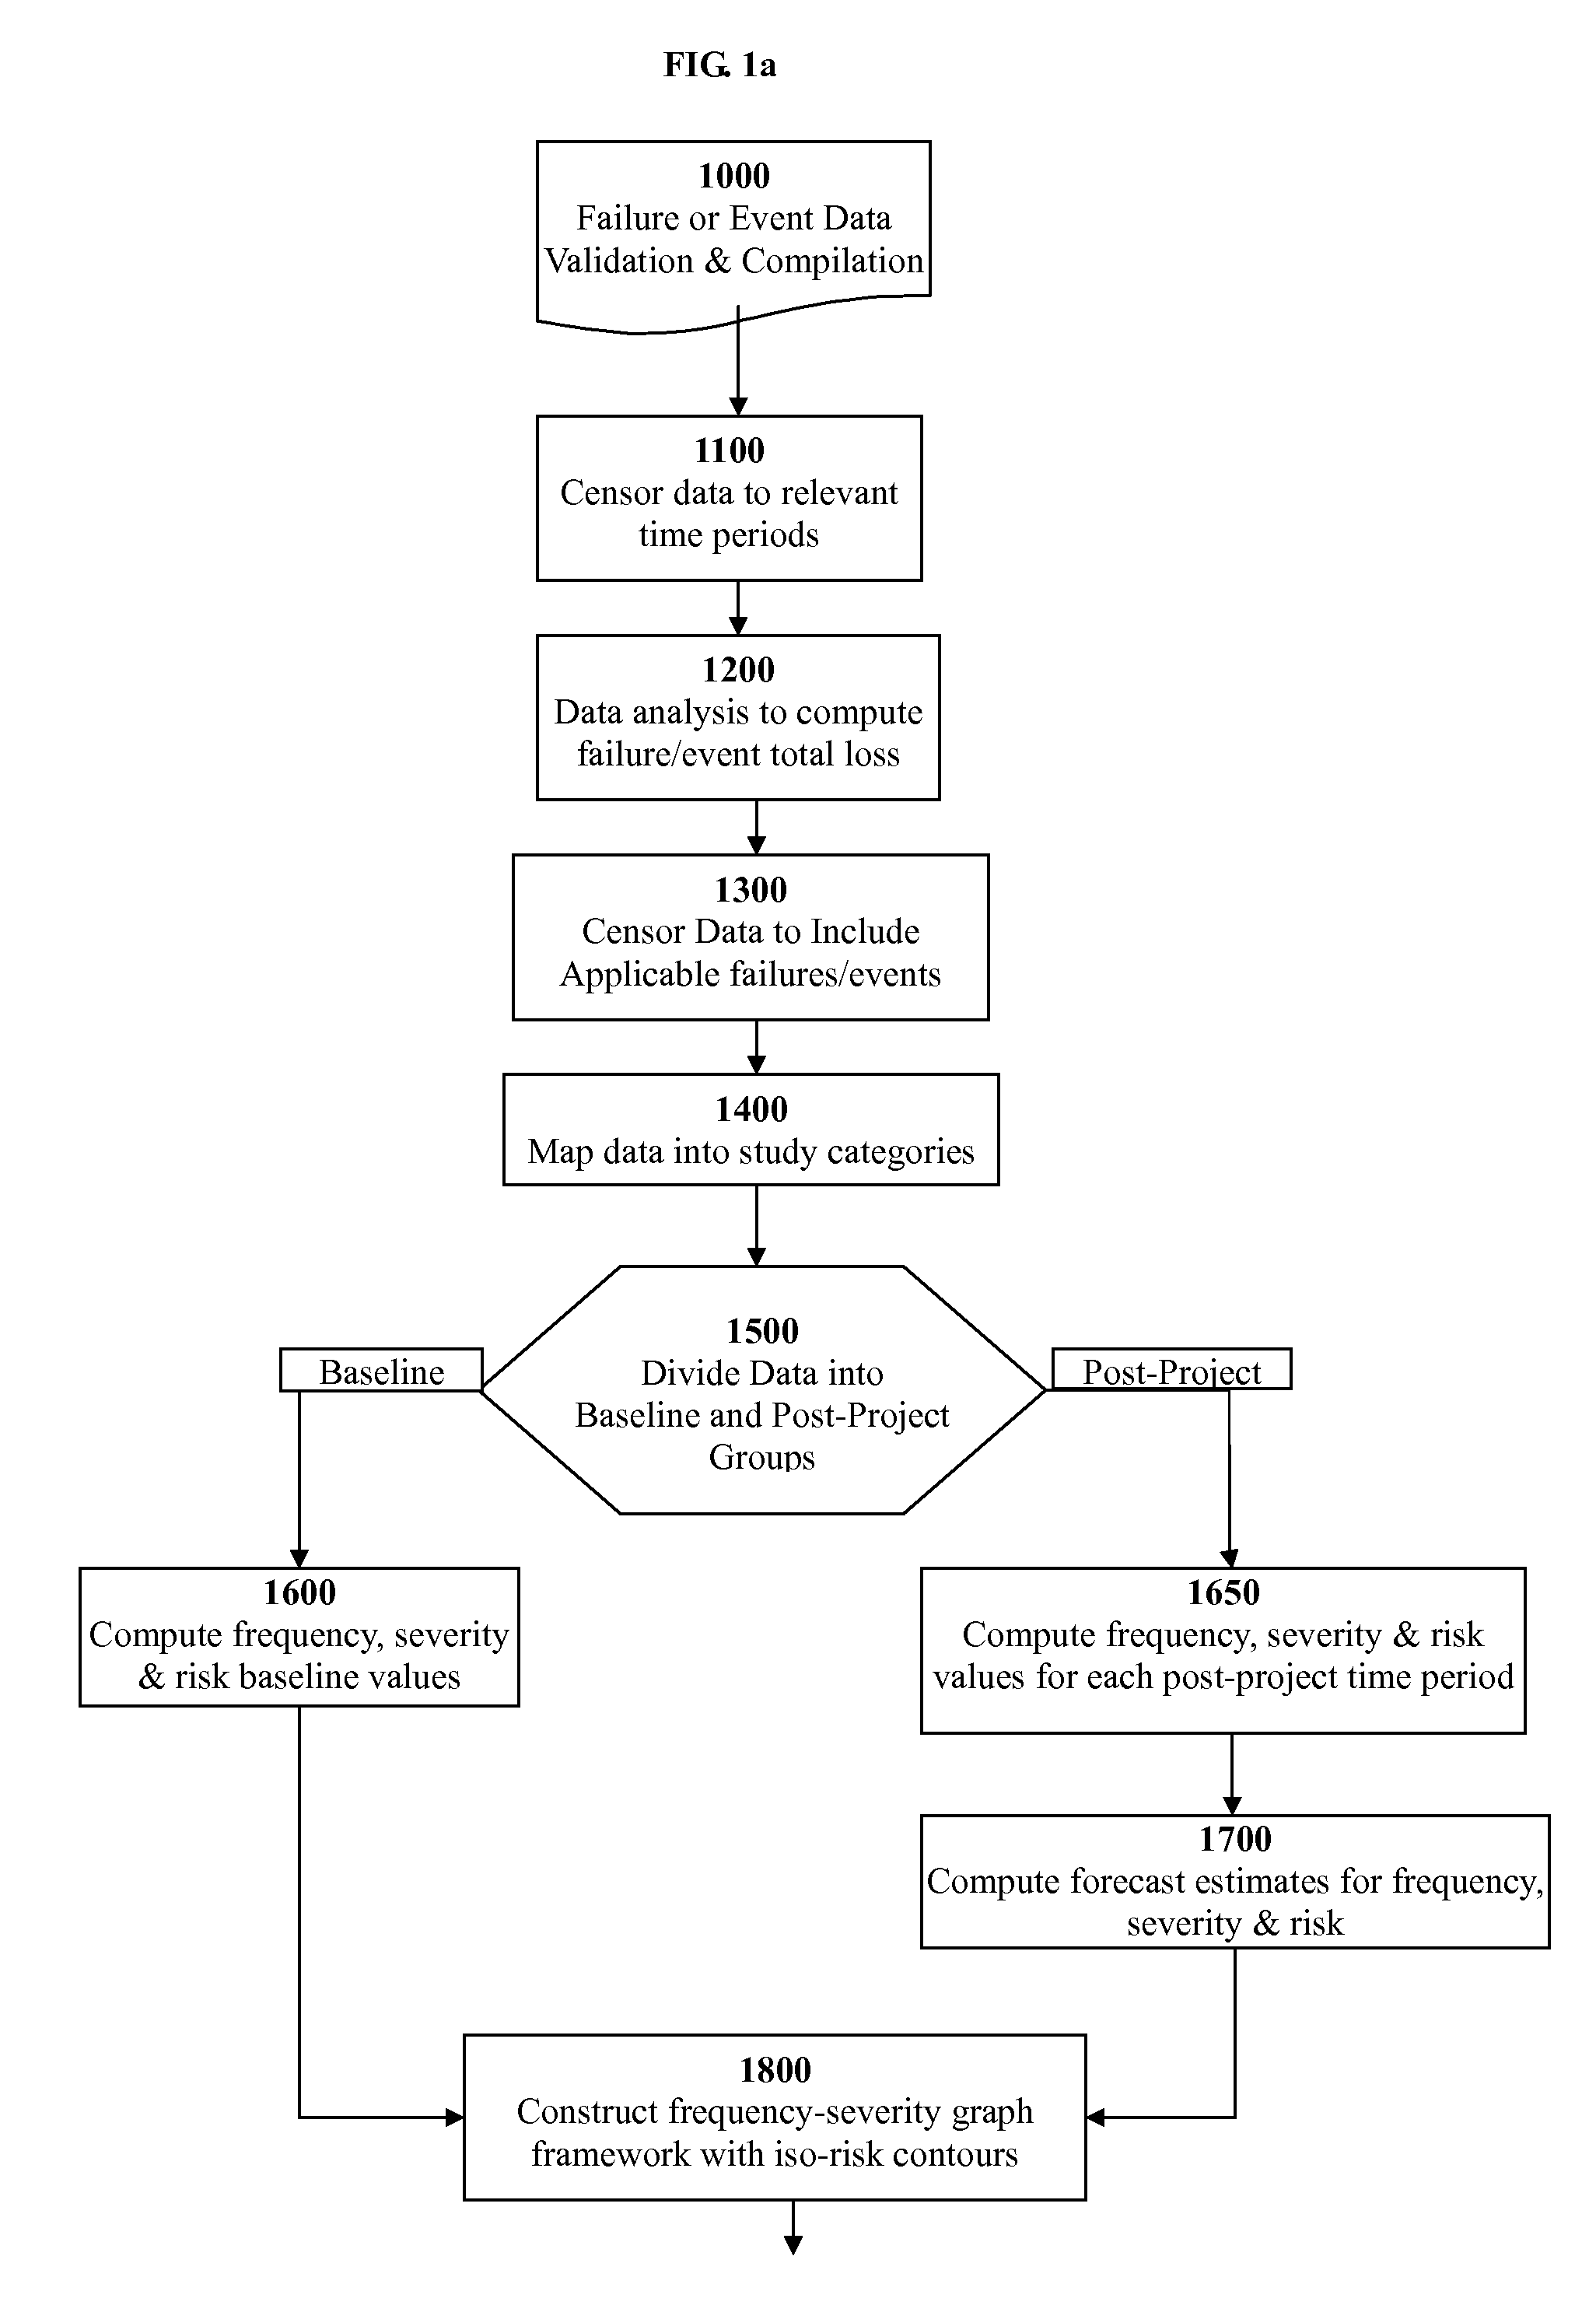
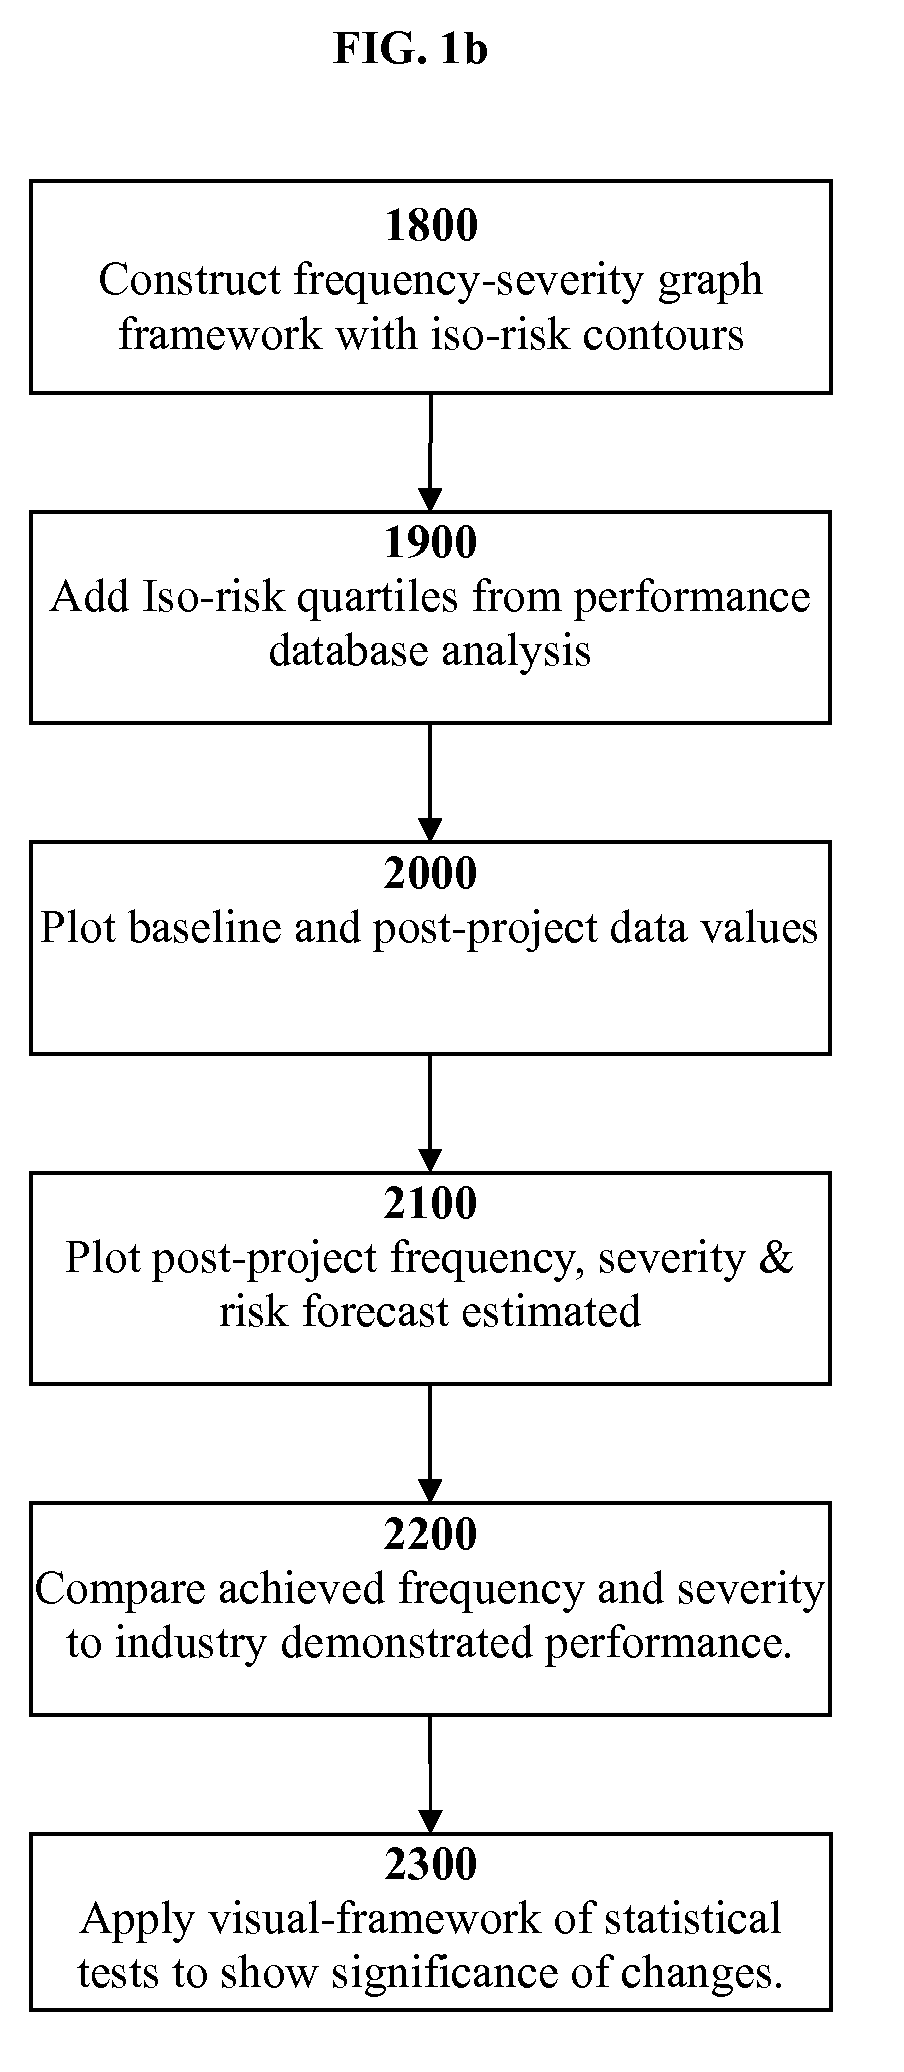
[0026]In FIGS. 1a and 1b, the Graphical Risk-Based Performance Measurement and Benchmarking System according to a preferred embodiment are shown. Incident data 1000 that contains information on the data or time of loss, the type of loss, and the amount of loss measured in dollars or other units (such as equivalent distillation capacity in the refining industry, or as percent of capacity in any manufacturing facility) is compiled into a pre-analysis file. This compilation then undergoes a data validation process that ensures accurate information is being entered into the System.
[0027]The dataset is then censored 1100 to only include incidents that occur during specific, pre-determined time periods. The first time period is called the “baseline” or “pre-installation” time interval. This refers the interval of time that performance will be measured a priori automation improvements as a benchmark to measure changes. The subsequent time period is called “post-project” or “post-installati...
PUM
 Abstract
Description
Claims
Application Information
 - R&D
- Intellectual Property
- Life Sciences
- Materials
- Tech Scout
- Unparalleled Data Quality
- Higher Quality Content
- 60% Fewer Hallucinations
Browse by: Latest US Patents, China's latest patents, Technical Efficacy Thesaurus, Application Domain, Technology Topic, Popular Technical Reports.
© 2025 PatSnap. All rights reserved.Legal|Privacy policy|Modern Slavery Act Transparency Statement|Sitemap|About US| Contact US: help@patsnap.com


