Device and method for controlling the conversion of biomass to biofuel
a technology of biomass and biofuel, which is applied in the direction of spectrometry/spectrophotometry/monochromators, drying machines with progressive movements, optical radiation measurement, etc., can solve the problems of low energy density, high transportation costs, and hindered widespread use of these devices
- Summary
- Abstract
- Description
- Claims
- Application Information
AI Technical Summary
Problems solved by technology
Method used
Image
Examples
example 1
Indication of Fuel Energy Content by Visible Light Colorimetry
[0124]It has been observed that the color of fuel obtained by apparatus 200 is qualitatively indicative of the energy content of the product. The following procedure was followed to obtain a quantitative measure of the energy content of the biofuel from visible light spectroscopy.
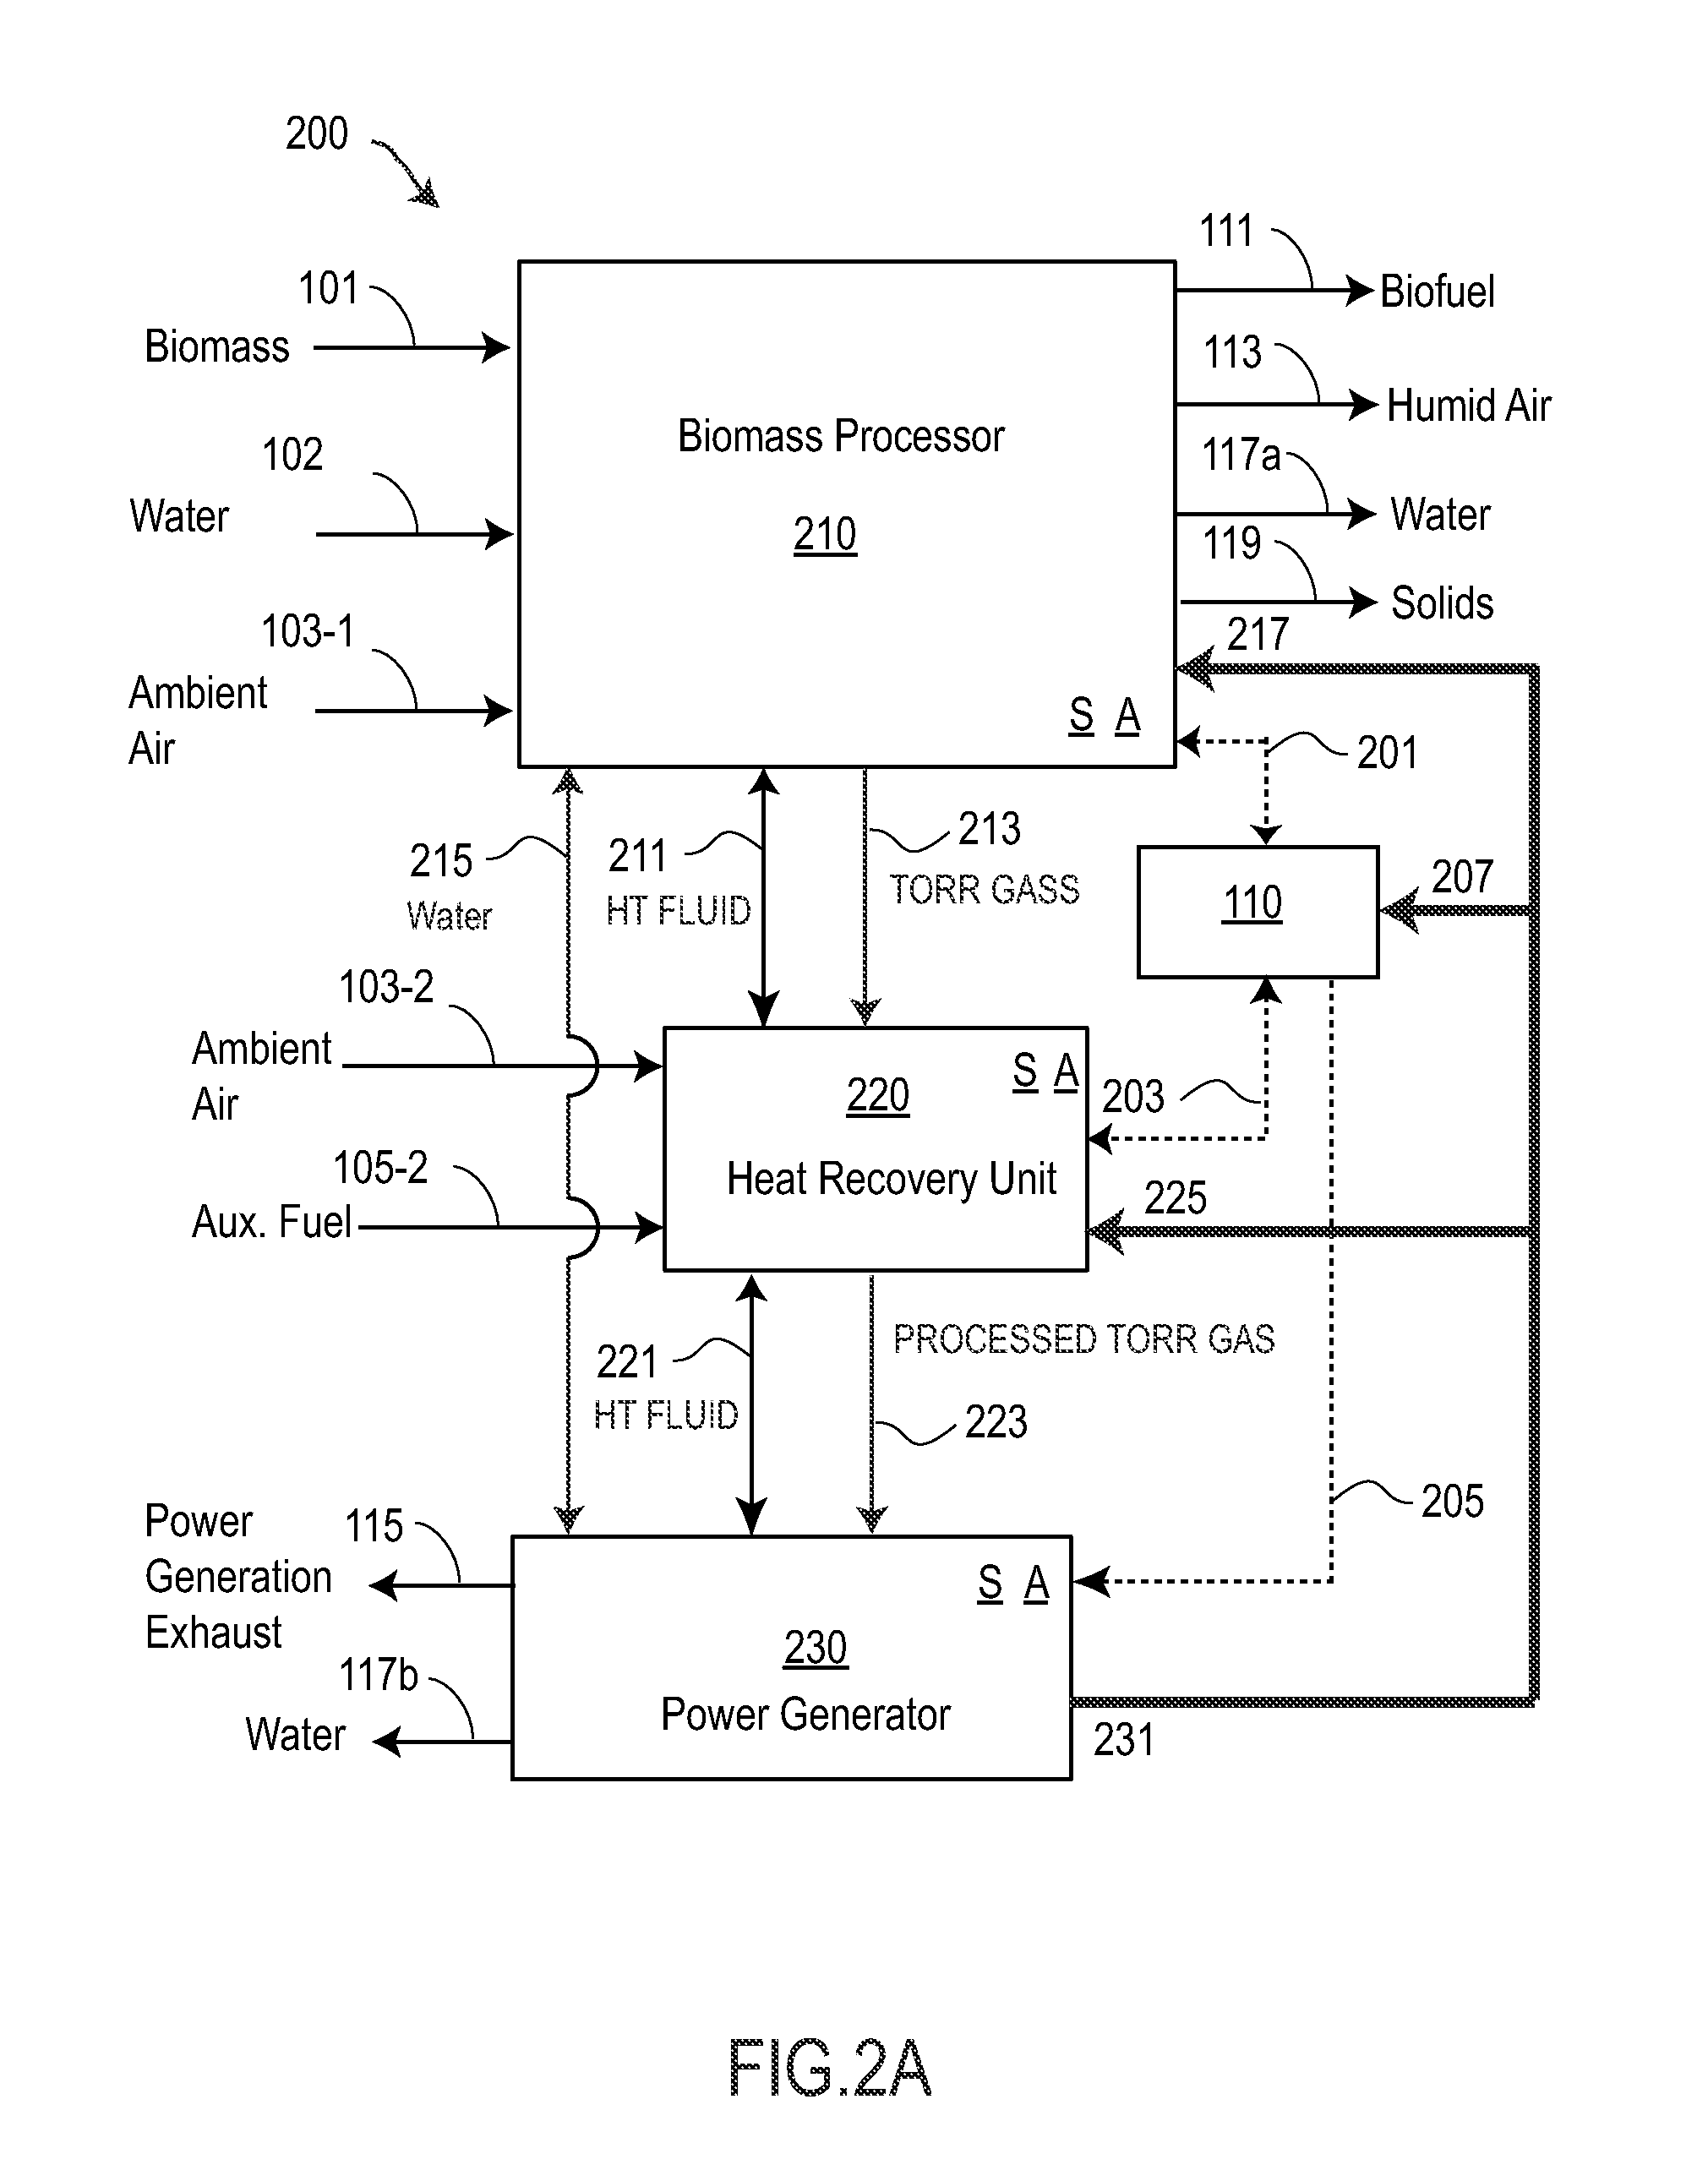
[0125]Four samples of mixed woods were obtained, and three of the samples were torrified at varying the torrefaction temperature: 270, 285 and 300° C. Representative samples were measured at a commercial laboratory (HAZEN Laboratories, Golden, Colo.) to determine the BTU / lb Caloric Value (Cv). Samples were also measured by visible light spectroscopy and, as shown subsequently, a high degree of correlation was obtained between spectral and laboratory measurements. It may thus be possible to estimate the energy content of material within apparatus 200 by a simple and rapid visible light spectroscopic analysis.
[0126]A reflectance technique was used ...
example 2
Estimation of the Molar Ratio of C, H, and O by Spectroscopy
[0131]One common metric of the quality of a solid fuel is by elemental composition ratios, such as the elemental ratio of oxygen to carbon (O / C) and the elemental ratio of hydrogen to carbon (H / C).
[0132]FIG. 7A is a graph of the ratio of oxygen atoms to carbon atoms (O / C) and hydrogen atoms to carbon atoms (H / C) for several types of fuel. This type of graph is often referred to as a “van Krevelen diagram.” See, for example, “Graphical-statistical method for the study of structure and reaction processes of coal”, Fuel, 29, 269-84 (1950).
[0133]Different types of fuel appear in different areas of a van Krevelen diagram. As shown in FIG. 7A, raw biomass appears in the upper right corner, natural coal is near the lower left corner and the shown samples of torrefied wood are between the two. The action of torrefaction of biomass changes the chemical structure of the biomass, causing the O / C and H / C ratios to move from the upper r...
example 3
Indication of Fuel Energy Content by Mid-IR Spectroscopy
[0143]The FTIR spectral measurements of Example 2 were also regressed against the energy content of each sample, similar to what was described with visible light colorimetry in Example 1. It was found that the following regression parameters provided a very good indication of the energy content of the samples, on par with the accuracy of the Example 1: BTU / pound=(−18447*R1)+13767.
[0144]Thus either visible light or mid-IR spectroscopy may be used to rapidly estimate the energy content of biomass for a range of levels of torrefaction.
[0145]Since the data samples used to obtain the BTU correlation is with a limited number of samples, it not yet know if these results are “universal” or if different correlation constants must be stored in control system 110 to control the processing of different materials.
PUM
| Property | Measurement | Unit |
|---|---|---|
| temperatures | aaaaa | aaaaa |
| temperatures | aaaaa | aaaaa |
| density | aaaaa | aaaaa |
Abstract
Description
Claims
Application Information
 - R&D
- Intellectual Property
- Life Sciences
- Materials
- Tech Scout
- Unparalleled Data Quality
- Higher Quality Content
- 60% Fewer Hallucinations
Browse by: Latest US Patents, China's latest patents, Technical Efficacy Thesaurus, Application Domain, Technology Topic, Popular Technical Reports.
© 2025 PatSnap. All rights reserved.Legal|Privacy policy|Modern Slavery Act Transparency Statement|Sitemap|About US| Contact US: help@patsnap.com


