
Method for amplifying cDNA derived from trace amount of sample

a trace amount and cdna technology, applied in the field of analysis of trace amount of nucleic acid components, can solve the problems of insufficient true expression analysis, insufficient conventional analysis method, and inability to analyze expression based on the average expression of a cell population, etc., to achieve gene expression analysis at a single cell level, and widen the range of application.

Active Publication Date: 2017-07-18
HITACHI LTD
View PDF6 Cites 0 Cited by
  • Summary
  • Abstract
  • Description
  • Claims
  • Application Information

AI Technical Summary

Benefits of technology

[0069]According to the method and kit of the present invention, it is possible to amplify a sufficient amount of sample for a large-scale DNA sequencing with less bias from one or a few cells. According to the present invention, gene expression analysis at a single cell level can be attained. Providing new life information to bioscience and the field of medicine in this manner is a great contribution. If behavior of cells as a population is understood not based on understanding of the properties in average as ever but based on understanding of properties of individual cells, and if responsiveness of cells to drugs and properties of cells are evaluated, the technique provided herein will find an extremely wider range of application than ever.
[0070]The present specification incorporates the contents described in the specification and / or the drawings of the Japanese Patent Application No. 2012-078675 based on which the present application claims priority.
[0071]The problems, constitutions and effects other than those described above will be apparently understood from the description of the following embodiments.

Problems solved by technology

In the studies dealing with cells whose characteristics differ from each other, a conventional method which analyzes an expression based on the average expression of a cell population is no longer sufficient.
There is a possibility that true expression analysis could not be made unless genes of individual cells are analyzed at the single-cell level.
However, the amount of mRNA contained in a single cell is extremely small.
It is difficult to analyze expression of a trace amount of mRNA by a conventional method.
In this method, however, since the number of genes simultaneously measured is limited to several, it was difficult to make comprehensive expression analysis.
However, the micro-array method may be inferior in quantitative performance, since the intensity of expression is measured based on hybridization of a gene-sequence specific probe compartmentally arranged on a chip, with a sample nucleic acid.
The real-time PCR method and the micro-array method have a following common problem: a sample the nucleotide sequence of which has not been determined, cannot be analyzed.
As described above, RNA-Seq by a large-scale DNA sequencer is an extremely excellent analysis method; however, assuming that expression of a single cell is analyzed by the sequencer, there is a large problem that is to be overcome.
Because of this, it is very difficult to actually amplify DNA up to several hundreds of ng so as to satisfy the specifications defined by a large-scale sequencer based on a trace amount of mRNA derived from a single cell.
As a result, there is a high possibility that the obtained sample fails to reflect the expression amount ratio of mRNA molecules in a single cell.
Kits for preparing a sample for RNA-Seq so as to satisfy the specifications defined by individual sequencers are available from various manufacturers; however, none of the kits fail to prepare a sample from a single cell-level mRNA of 2 pg or less.
Generally, if such a method is used, a serious problem, unequal amplification, may be accompanied.
In other words, this is referred to as an amplification bias, which is going to be a significant problem in quantitatively comparing gene expression amounts.
In such a case, it is difficult to distinguish such small difference in expression amount between the genes by the expression analysis method giving a several-fold amplification bias.

Method used


Image

  • Method for amplifying cDNA derived from trace amount of sample
  • Method for amplifying cDNA derived from trace amount of sample
  • Method for amplifying cDNA derived from trace amount of sample

Examples


example 1

Preparation of a Sample for Large-Scale Sequencing from a Single Cell

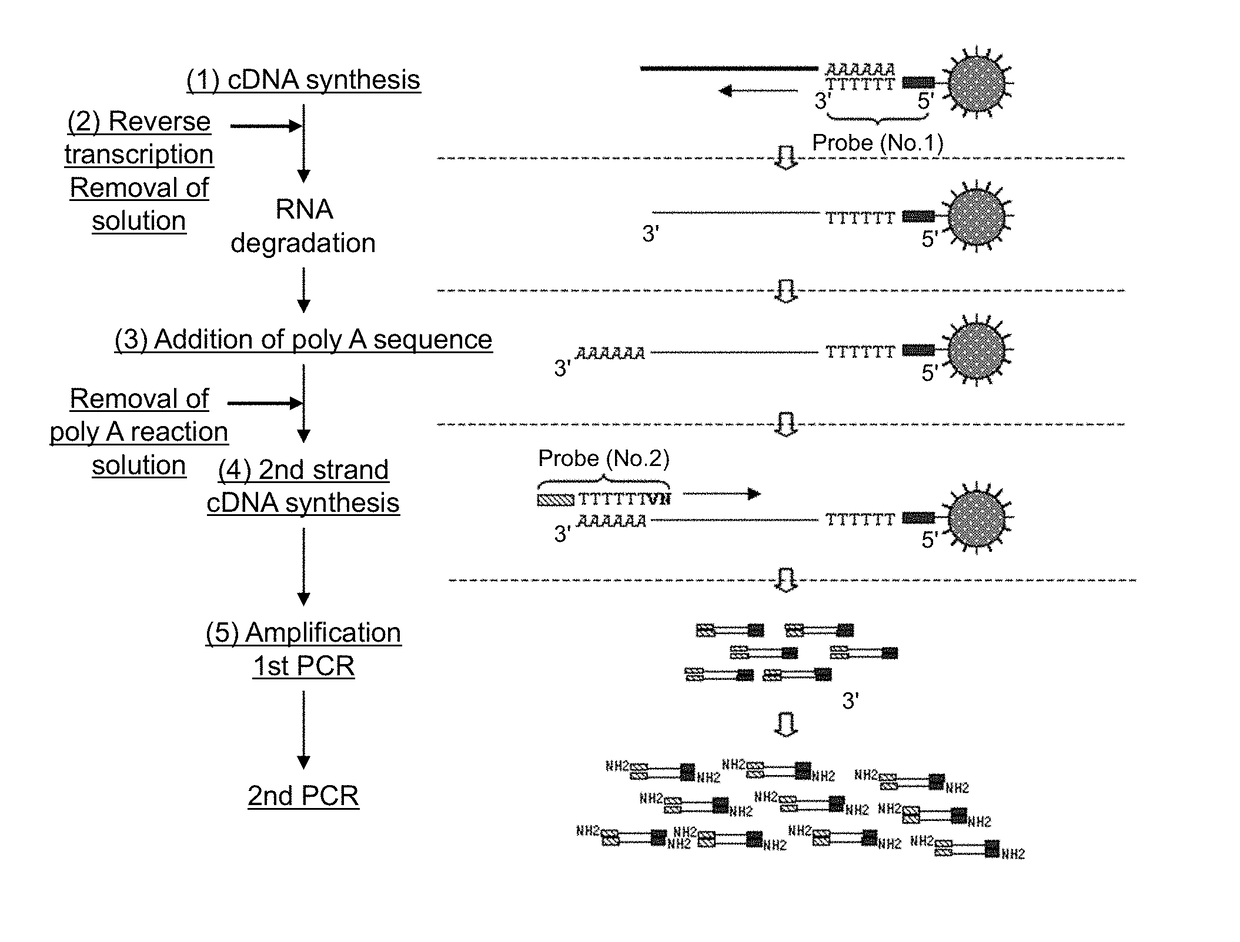
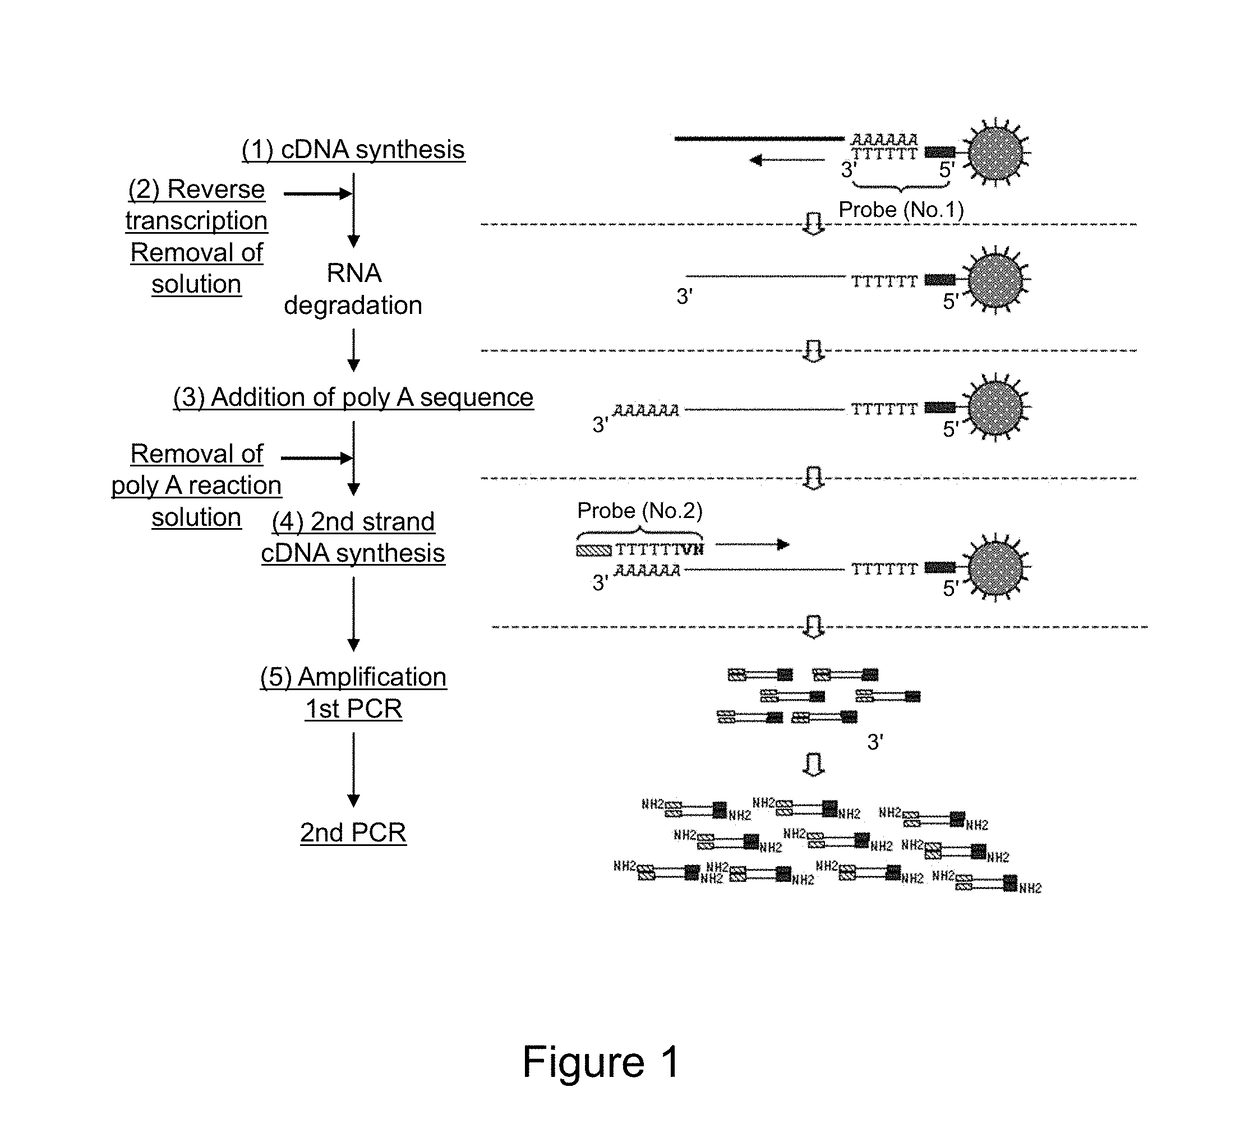
[0143]In this example, an example of the protocol of the present invention will be described.

[0144]

[0145]UP1 probe (SEQ ID NO: 1) prepared by adding biotin (2 molecules) to the 5′ terminal was immobilized to magnetic beads (Dynabeads MyOne Streptavidin C1; Dynal). First, 120 μL of magnetic beads (about 1.2×10⁹ beads) was transferred to a 2 mL-tube (Eppendorf). To the tube, 120 μL of 1× B&W buffer (1M NaCl, 0.5 mM EDTA, 10 mM Tris-HCl pH8.0, 0.1% Tween20) was added and mixed. Subsequently, the tube was set on a magnet to separate magnetic beads toward the wall surface of the tube. After that, the supernatant was removed. To the tube, 120 μL of 1× B&W buffer was added to resuspend the magnetic beads. This operation was repeated further twice to wash magnetic beads, and a 120 magnetic beads solution was prepared.

[0146]Subsequently, 2 μL (about 4.8×10¹² molecules) of 4 μM UP1 probe (IDT) was added to 118 μL of 1× B&W b...

example 2

Evaluation of Amplification Efficiency and Amplification Bias

[0182]To evaluate amplification efficiency of DNA and amplification bias in each step of the protocol shown in Example 1, the amount of each gene was measured by a quantitative PCR method. Quantitative measurement was performed by use of 7900HT Fast Real-Time PCR system apparatus manufactured by Applied Biosystems. First, cDNA library was prepared from a single cell of HCT116 in accordance with the protocol of Example 1 and the amounts of cDNA of five types of genes (EEF1G, B2M, SDHA, TBP, and GUSB) were measured. As the quantitative PCR of these five types of genes, a TaqMan Probe method using an MGB fluorescent probe was employed. MGB fluorescent probes and PCR primers for individual genes are shown in the following SEQ ID NOs: 6 to 20. As a reaction reagent of the quantitative PCR, Premix Ex Taq (Takara Bio Inc.) was used. The reaction reagent was prepared in accordance with the manual attached. The amount of each cDNA ...

example 3

Optimization of the Amount of Probe to be Immobilized to Magnetic Beads

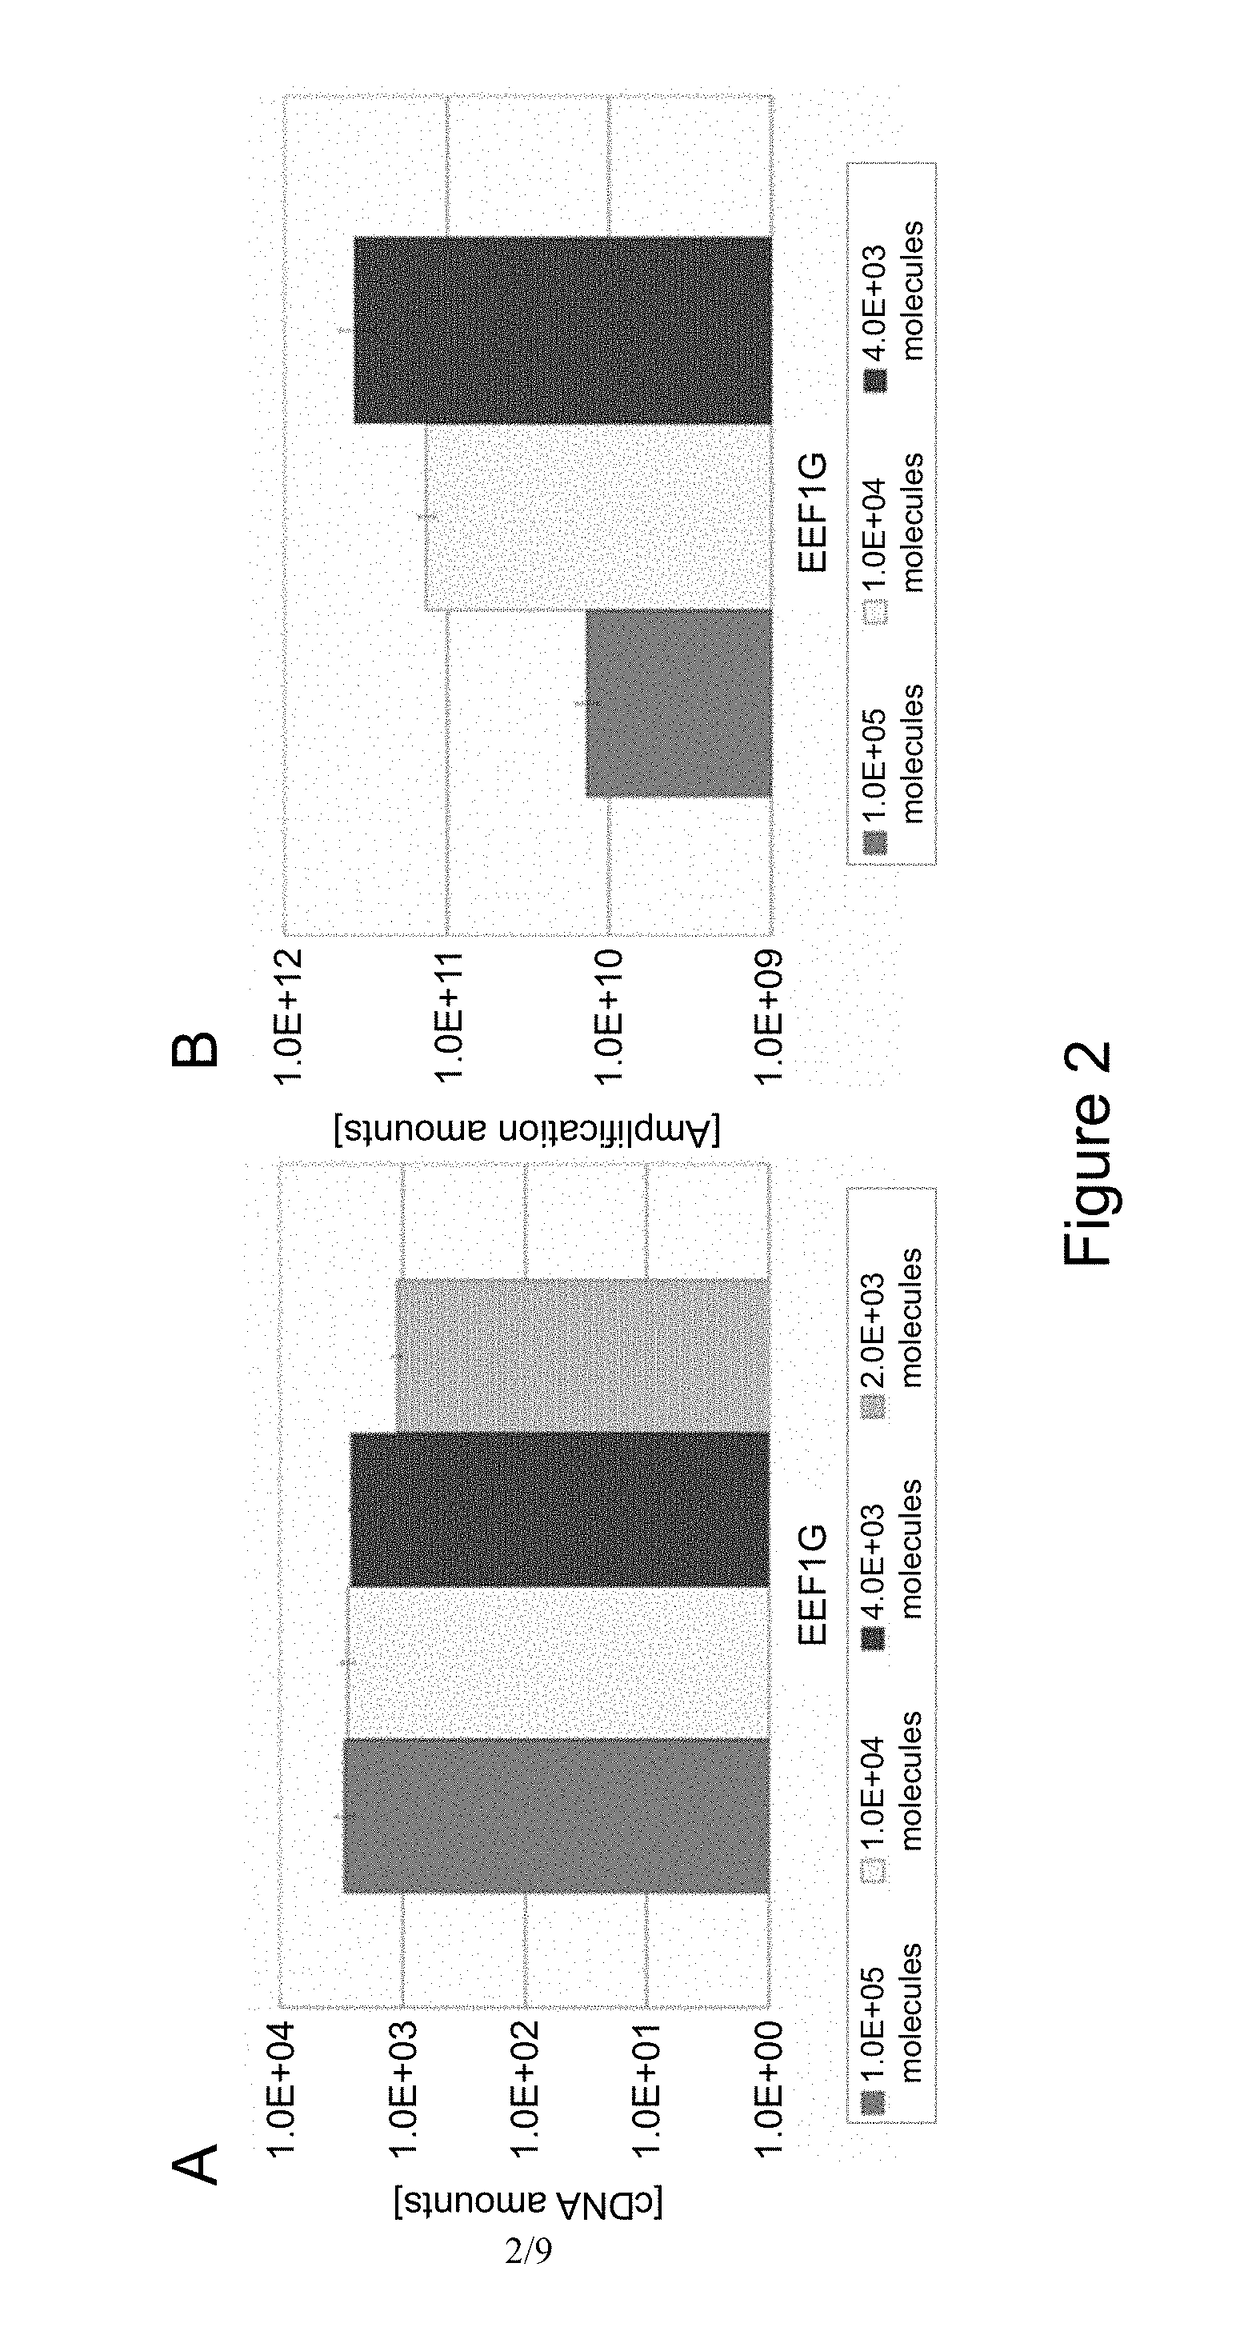
[0188]To optimize the amount of UP1 probe to be bound onto magnetic beads for capturing mRNA, magnetic beads were prepared by varying the amount of UP1 probe to be immobilized, and reverse transcription efficiency and cDNA amplification efficiency were determined.

[0189]According to the method described in Example 1, UP1 probe was immobilized to magnetic beads via a biotin-avidin bond. At this time, as the amount of UP1 probe to be reacted with the magnetic beads, four different amounts: 200 pmol (about 1.2×10¹⁴ molecules), 20 pmol, 8 pmol and 4 pmol, were used. If the UP1 probe is subjected to the reaction in these amounts, it is calculated that UP1 probe of 1×10⁵, 1×10⁴, 4×10³, and 2×10³ molecules are to be immobilized per magnetic bead, respectively. Then, mRNA (2 pg) was captured by use of these four samples of UP1 probes immobilized magnetic beads (107 beads) and subjected to a reverse transcription reaction....


PUM

PropertyMeasurementUnit
temperatureaaaaaaaaaa
volumesaaaaaaaaaa

Abstract

The problem to be solved by the present invention is to provide a method for preparing a sample for comprehensively and accurately analyzing gene expression in a single cell or a few cells, for example, by a large-scale DNA sequencer. The present invention relates to a method for amplifying cDNA from mRNA in a cell, comprising: (1) capturing mRNA derived from the cell by a first DNA probe containing a first tag sequence and a poly T sequence and being immobilized to a solid carrier in a single reaction vessel, and synthesizing a first strand cDNA from the mRNA by a reverse transcription reaction; (2) removing a reaction reagent from the reaction vessel while keeping the first strand cDNA synthesized onto the solid carrier in the reaction vessel; (3) adding a polynucleotide sequence consisting of one type of nucleotides to 3′ terminal of the first strand cDNA on the solid carrier; (4) hybridizing a second DNA probe containing a second tag sequence and a complementary sequence to the polynucleotide sequence with the cDNA to which the polynucleotide sequence is added, and synthesizing a second strand cDNA; and (5) performing a DNA amplification reaction using the second strand cDNA synthesized on the solid carrier as a template.

Description

BACKGROUND OF THE INVENTION[0001]Field of the Invention[0002]The present invention relates to analysis of a trace amount of nucleic acid component such as RNA or DNA contained in one or a few cells, and particularly relates to a method of producing cDNA from mRNA and equally amplifying cDNA.[0003]Background Art[0004]Gene expression analysis has been widely used as a means for accurately elucidating the state of a living body. As a typical expression analysis method, a real-time PCR method and a micro-array method have been known. For the analysis, mRNA is extracted from various samples and put in use. For example, mRNA extracted from cultured and proliferated cells or mRNA extracted from a tissue piece containing a plurality of cells has been frequently used. An amount of each mRNA measured is regarded as an average amount of mRNA molecules collected from a plurality of cells and to be subjected to analysis.[0005]In the meantime, a significant development has been recently made in t...

Claims


Application Information

Patent Timeline
Patent Type & Authority Patents(United States)
IPC IPC(8): C12N15/10C12Q1/68
CPCC12N15/1096C12N15/1065C12Q1/686C12Q1/6844C12Q2521/107C12Q2525/173C12Q2563/149
Inventor TSUNODA, HIROYUKIHUANG, HUANOHTA, MARIKAMBARA, HIDEKI
Owner HITACHI LTD
Learn More