Methods, apparatus and systems for data visualization and related applications

a data visualization and data technology, applied in image data processing, office automation, marketing, etc., can solve the problems of less meaningful charts, less data, and well established and often poorly implemented data representation methods in traditional charts

Active Publication Date: 2018-01-16
NEW BIS SAFE LUXCO S A R L
View PDF30 Cites 143 Cited by
  • Summary
  • Abstract
  • Description
  • Claims
  • Application Information

AI Technical Summary

Problems solved by technology

Traditional charts use well established and often poorly implemented ways of representing data.
Many tools exist to help the user construct very sophisticated representations of data but that sophistication typically results in less meaningful charts.
However, as the amount of data increases, so does the complexity of the visual representations created by the analysis of the data.
These complex representations can end up swamping parts of the visual representation that is most required and relevant to an end user.
This can result in the user mismatching the data being represented with the chosen visual representation so that the resultant representation does not clearly, accurately and succinctly identify any issues with, or convey information about, the data.
This can result in the user missing particularly important features of the data due to those features not being represented in the most appropriate manner.
Also, although there are many sophisticated visualization algorithms that do exist and are being developed for specific functions, these algorithms are not provided to a user in a manner that guides the user to easily pick the data to be represented, pick the correct summaries of the data, pick the right dimensions to be represented, pick the right forms of visual representation, or choose unique visual designs to create a collection of visualizations that help someone run their business.
This is very limiting to a user who may want to show various different aspects of the data in a single document.
However, these business measures merely represent a single dimension of the data, or even only a single number, and so are particularly limiting in respect of the data that they represent.
Further, the business measures merely represent data and do not include any further functional capabilities.
However, self organizing maps can be very difficult and arduous to interpret.
Classification algorithms, such as fast clustering genetic algorithms or dimension reduction algorithms, can result in highly complicated structures.

Method used


Image

  • Methods, apparatus and systems for data visualization and related applications
  • Methods, apparatus and systems for data visualization and related applications
  • Methods, apparatus and systems for data visualization and related applications

Examples


first embodiment

[0662]According to this embodiment there is shown in FIG. 11Q a conceptual system diagram of a data visualization system 11Q01 which includes a data retrieval module 11Q03 configured to enable the retrieval of data from a data storage module, which is in communication with the data visualization system.

[0663]The system further includes a smoothing module 11Q05 and an interpolation module 11Q07 which are arranged to receive the data obtained by the retrieval module. Each of the smoothing module and interpolation modules are controlled using specific algorithms to create, from the input data, a smoothed surface and an interpolated surface respectively. The smoothed and interpolated surfaces are then combined by a surface combining module 11Q11. The output of the surface combining module is provided to a rendering module 11Q13, which is arranged and controlled to create the appropriate signals for the output device 11Q15, which in this embodiment is a display module, which is used to v...

effect example

Radius Effect Example

[0692]As an alternative to the IDW example described above, a further IDW example is provided that incorporates a radius effect to calculate the weight factor as described below.

[0693]According to this example, the radius effect may be used to calculate the weight factor Wi. The radius value R is calculated based on the direct radial distance to the furthest point. That is, it is calculated by determining the distance for all points by taking the square root of the sum of the squares of the x and y difference values, and using the largest of these distance values. For example, the radius value between points x,y (5,5) and x8,y8 (7,10) is the square root of (5-7)2+(5-10)2=5.385165, as shown in the table below.

[0694]The weight factor is calculated as follows using the calculated R value:

[0695]Wi=(R-diRdi)2∑j=1n⁢(R-djRdj)2

where R=max(di)=distance between (X, Y) and the farthest point (Xi, Yi)

[0696]Therefore, the weight given to the furthest point is 0, whereas the ...

third embodiment

[0766]In a third embodiment, the system generates the surface using a three step process wherein a first step includes generating a surface that has primary smoothing, a second step includes secondary smoothing adjustments in order to get a smoother surface, and a third step includes a final interpolation adjustment that makes the surface pass exactly through the data points

[0767]The first smoothing step may be calculated with a very large radius, for example (more smoothing is applied), whereas subsequent smoothing may use a smaller radius in order to show finer smoothed details. Using this process may on some datasets reduce the visual anomalies caused by varying densities in data points.

[0768]The system modules as described, above and in FIG. 11Q may be used to implement the following steps.

Step 1

[0769]The smoothing module is used to apply a primary smoothing step to the input data to create a surface that is near to the source points. A function, such as a weighting function, ma...


PUM


Abstract

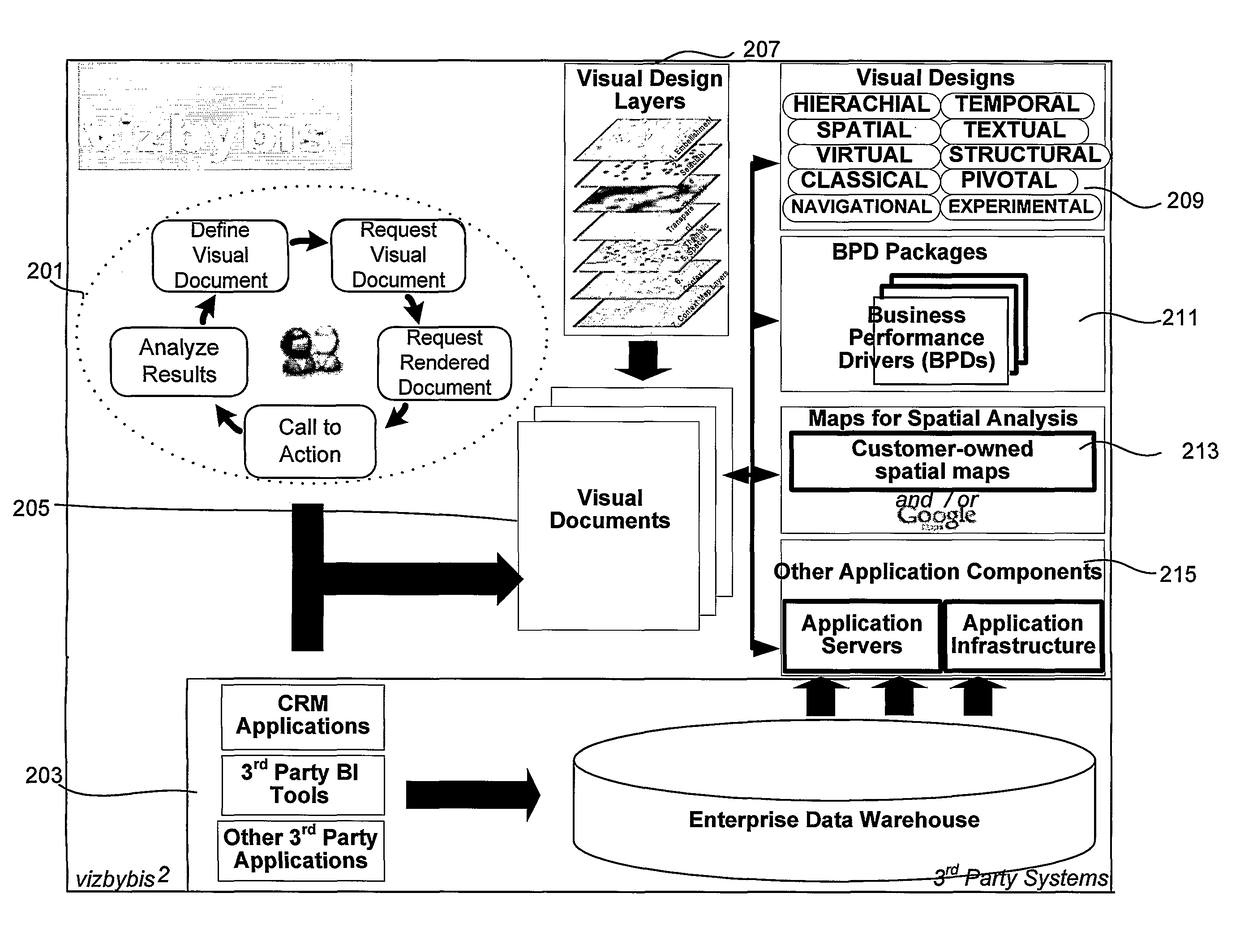
In a data visualization system, a method of creating a visual representation of data, the method including the steps of providing instructions to an end user to assist the end user in: constructing multiple graphical representations of data, where each graphical representation is one of a predefined type and includes multiple layers of elements that contribute to the end user's understanding of the data; arranging multiple graphical representations of different types within the visual representation in a manner that enables the end user to understand and focus on the data being represented; and displaying the visual representation.

Description

[0001]This application is a National Stage Application of PCT / NZ2009 / 000114, filed 19 Jun. 2009, which claims benefit of U.S. Ser. No. 61 / 074,347, filed 20 Jun. 2008, U.S. Ser. No. 61 / 093,428, filed 1 Sep. 2008, U.S. Ser. No. 61 / 101,670, filed 30 Sep. 2008; U.S. Ser. No. 61 / 101,672, filed 30 Sep. 2008, U.S. Ser. No. 61 / 107,665, filed 22 Oct. 2008, U.S. Ser. No. 61 / 115,036, filed 15 Nov. 2008, U.S. Ser. No. 61 / 118,211, filed 26 Nov. 2008, U.S. Ser. No. 61 / 140,556, filed 23 Dec. 2008, U.S. Ser. No. 61 / 145,775, filed 20 Jan. 2009, U.S. Ser. No. 61 / 145,133, filed 21 Jan. 2009, U.S. Ser. No. 61 / 146,525 filed 22 Jan. 2009, U.S. Ser. No. 61 / 146,430, filed 22 Jan. 2009 and U.S. Ser. No. 61 / 161,472 filed 19 Mar. 2009 and which applications are incorporated herein by reference. To the extent appropriate, a claim of priority is made to each of the above disclosed applications.FIELD OF THE INVENTION[0002]The present invention relates to methods, apparatus and systems for data visualization and ...

Claims


Application Information

Patent Timeline
Patent Type & Authority Patents(United States)
IPC IPC(8): G06F17/30G06Q30/02G06Q10/10G06T11/20G06Q40/04
CPCG06T11/206G06Q40/04G06Q30/02G06Q10/10
Inventor CARDNO, ANDREW JOHNINGHAM, PETER STEWARTLEWIN, BART ANDREWSINGH, ASHOK KUMAR
Owner NEW BIS SAFE LUXCO S A R L
Why Eureka
Try Eureka