

Systems, methods for hyperglycemia and hypoglycemia, glucose variability, and ineffective self-monitoring
A hyperglycemia, time-period technology applied in the field of glucose monitoring
- Summary
- Abstract
- Description
- Claims
- Application Information
AI Technical Summary
Problems solved by technology
Method used
Image

Examples
example
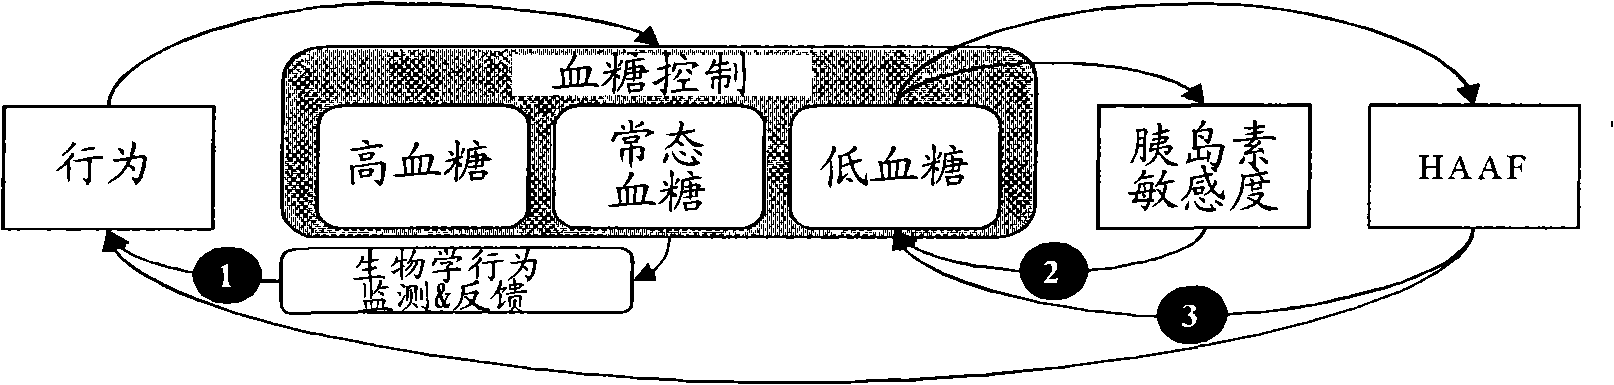
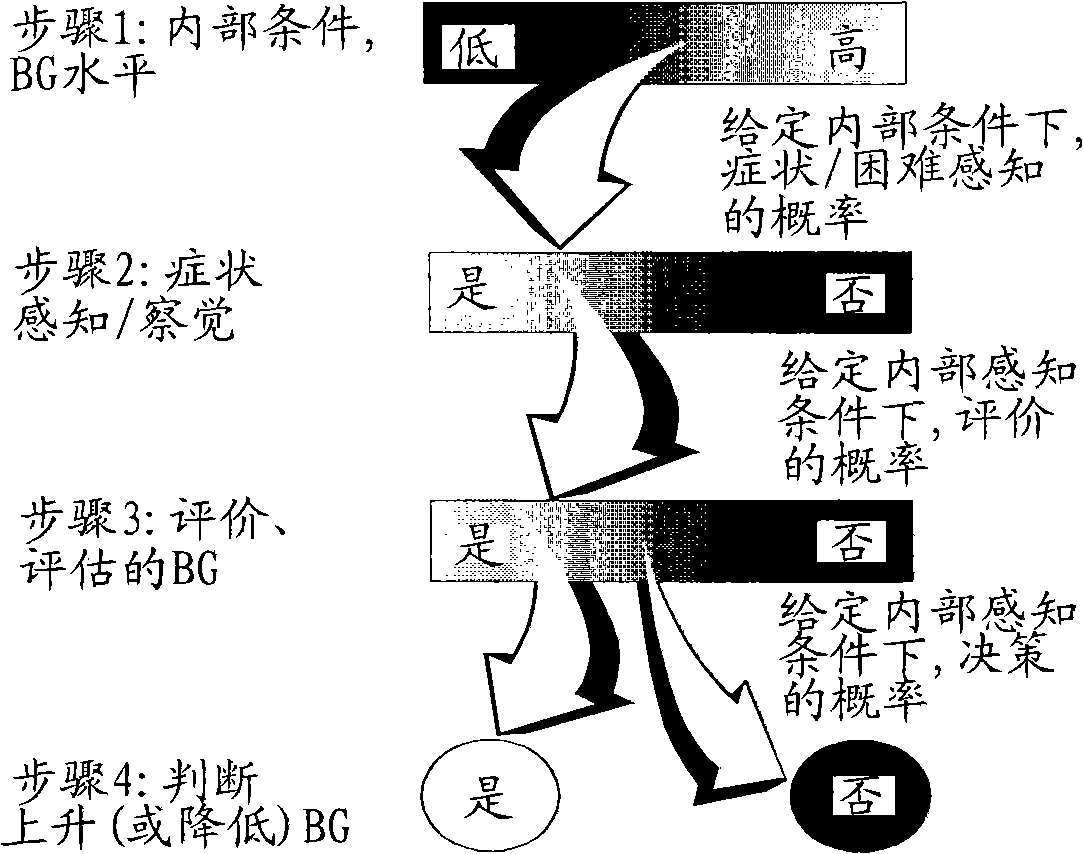
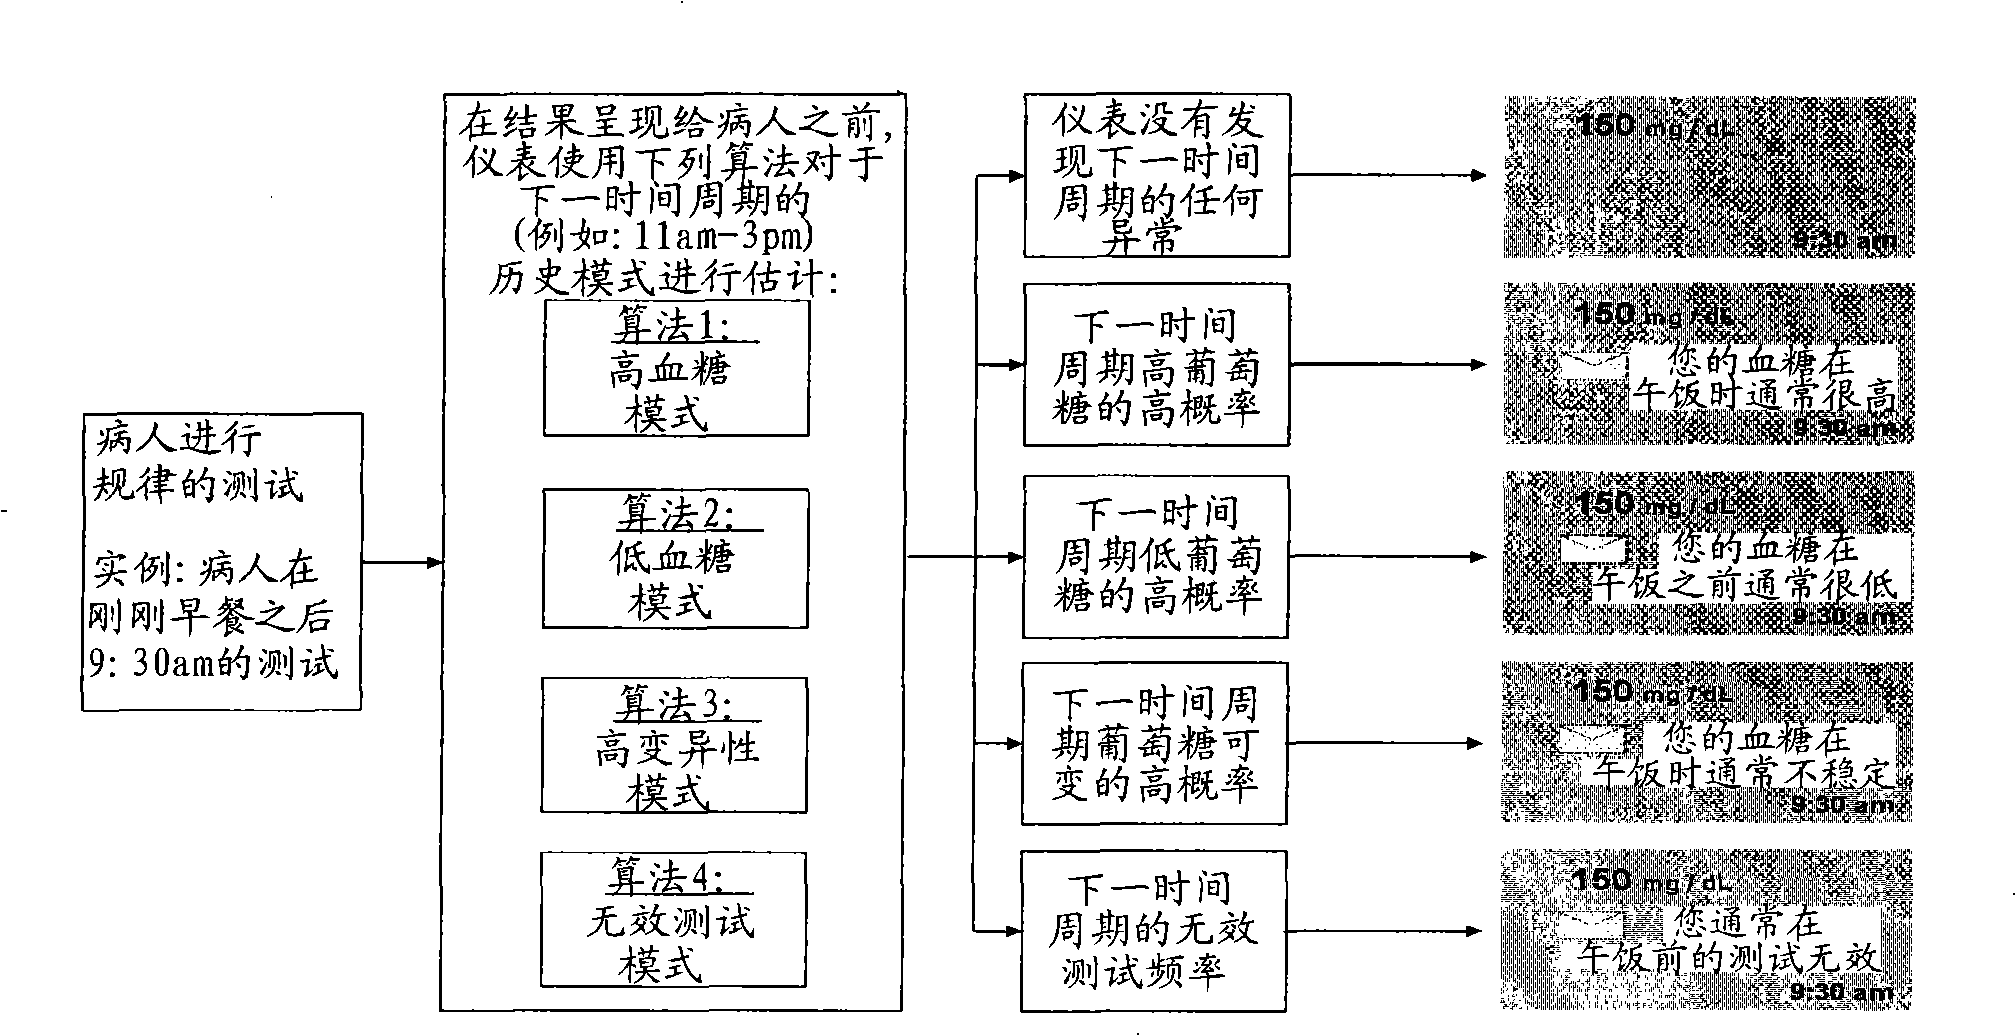
[0133] Figure 4-6 Calculations to identify temporal patterns of hyperglycemia are shown. exist Figure 4 In , the overnight period was identified as a high-risk period for hyperglycemia. exist Figure 5 , two time periods, 3-7PM and 7-11PM, were identified as high-risk periods for hyperglycemia. exist Image 6 In , the time period from 11PM to 11AM was identified as a high risk period for hypoglycemia.
[0134] 2. Algorithms to identify patterns of increased glucose variability from SMBG data
[0135] The logic of the algorithm to identify patterns of increased glucose variability is similar to the logic of the algorithm to identify patterns of hyperglycemia. However, instead of measuring mean BG, the test included a measure of variability within each time period. For example, such a measure could be the standard deviation (SD) of the BG, or the risk standard deviation (RSD) of these values converted into a risk space (28). In this implementation, we use RSD becau...
PUM
 Abstract
Description
Claims
Application Information