Apparatus and method for monitoring blood glucose levels including convenient display of blood glucose value average and constituent values

a technology of blood glucose and display device, which is applied in the field of blood glucose meters and glucose monitoring, can solve the problems of inability to safely increase the breakfast dose of a short acting insulin, and inability to provide patients with immediate and convenient access to the average blood glucose level

Active Publication Date: 2009-08-04
EMBECTA CORP
View PDF33 Cites 71 Cited by
  • Summary
  • Abstract
  • Description
  • Claims
  • Application Information

AI Technical Summary

Problems solved by technology

These blood glucose meters, however, are disadvantageous because the length of the period of time over which the averages are calculated is too long when a patient is using the averaging to adjust his insulin dosage, and particularly when the current average blood glucose values are too low.
No existing blood glucose meter, however, provides an average blood glucose value over a selected bin or period of time, as well as convenient access to the constituent values used to derive the average value and optionally an indication of variability among the constituent values.
These systems, however, also do not provide a patient with immediate and convenient access to averages of blood glucose levels at a mealtime or during another specified time period and to the constituent levels used to generate these averages.
This is disadvantageous when a patient is determining whether an adjustment is needed in his insulin dosage.
If, however, the constituent values varied significantly (e.g., were 75 mg / dl, 297 mg / dl and 168 mg / dl), the patient could not safely increase the breakfast dose of a short acting insulin, not even by a small amount.

Method used


Image

  • Apparatus and method for monitoring blood glucose levels including convenient display of blood glucose value average and constituent values
  • Apparatus and method for monitoring blood glucose levels including convenient display of blood glucose value average and constituent values
  • Apparatus and method for monitoring blood glucose levels including convenient display of blood glucose value average and constituent values

Examples


example 1

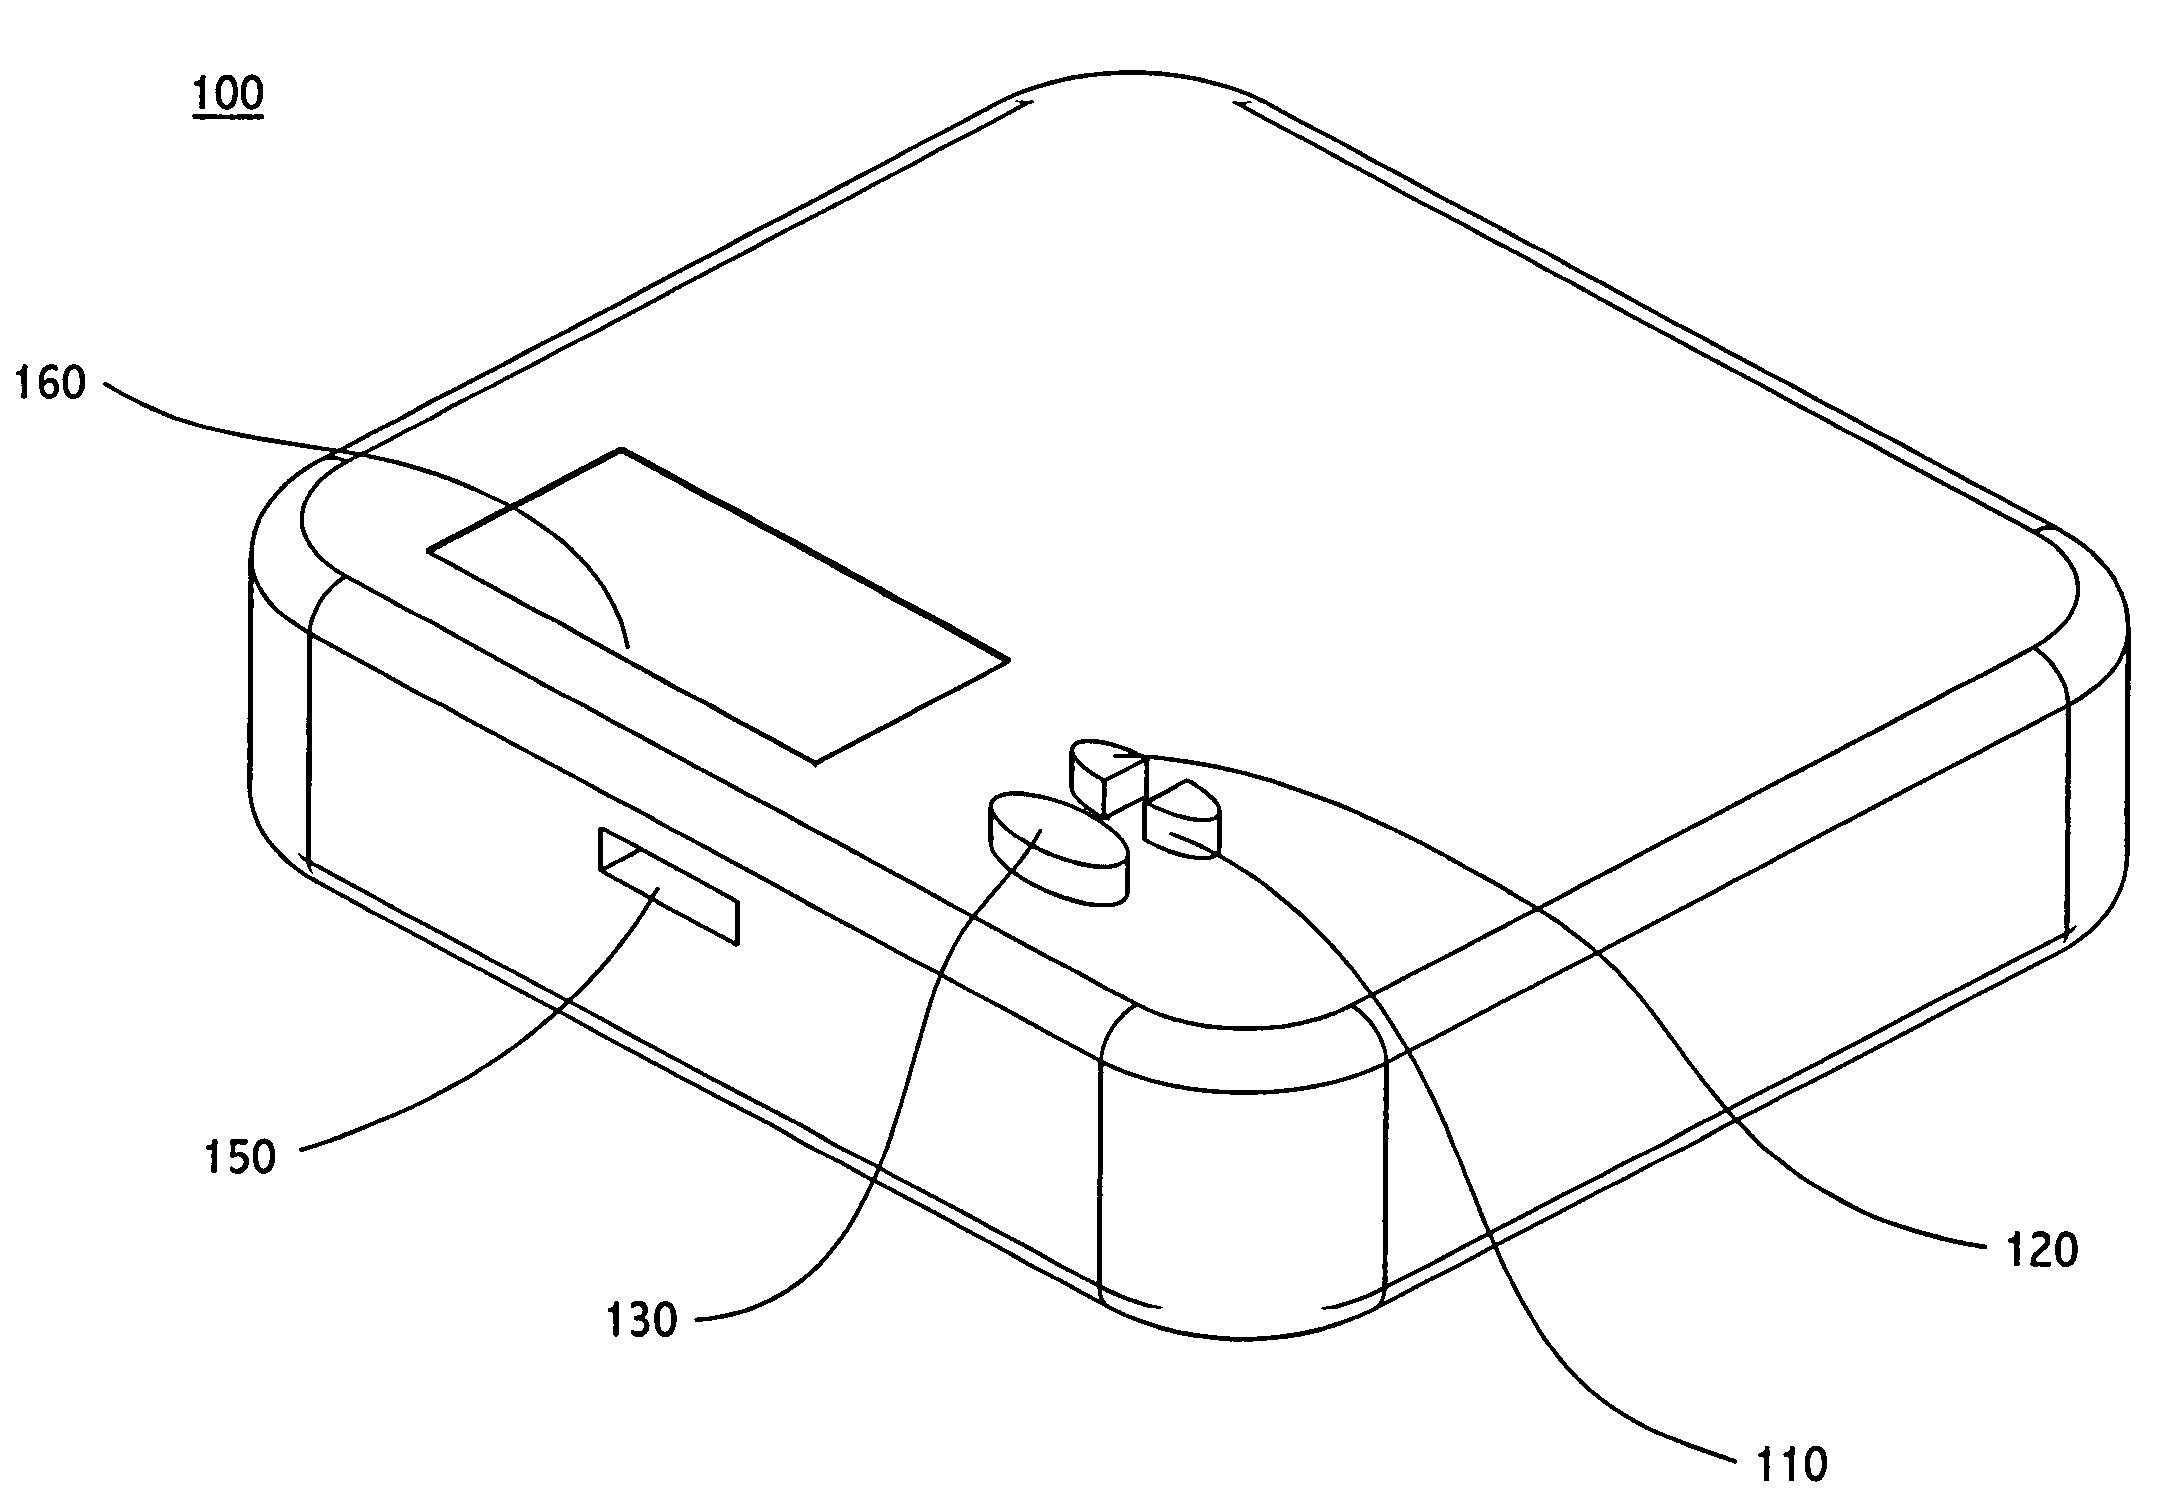
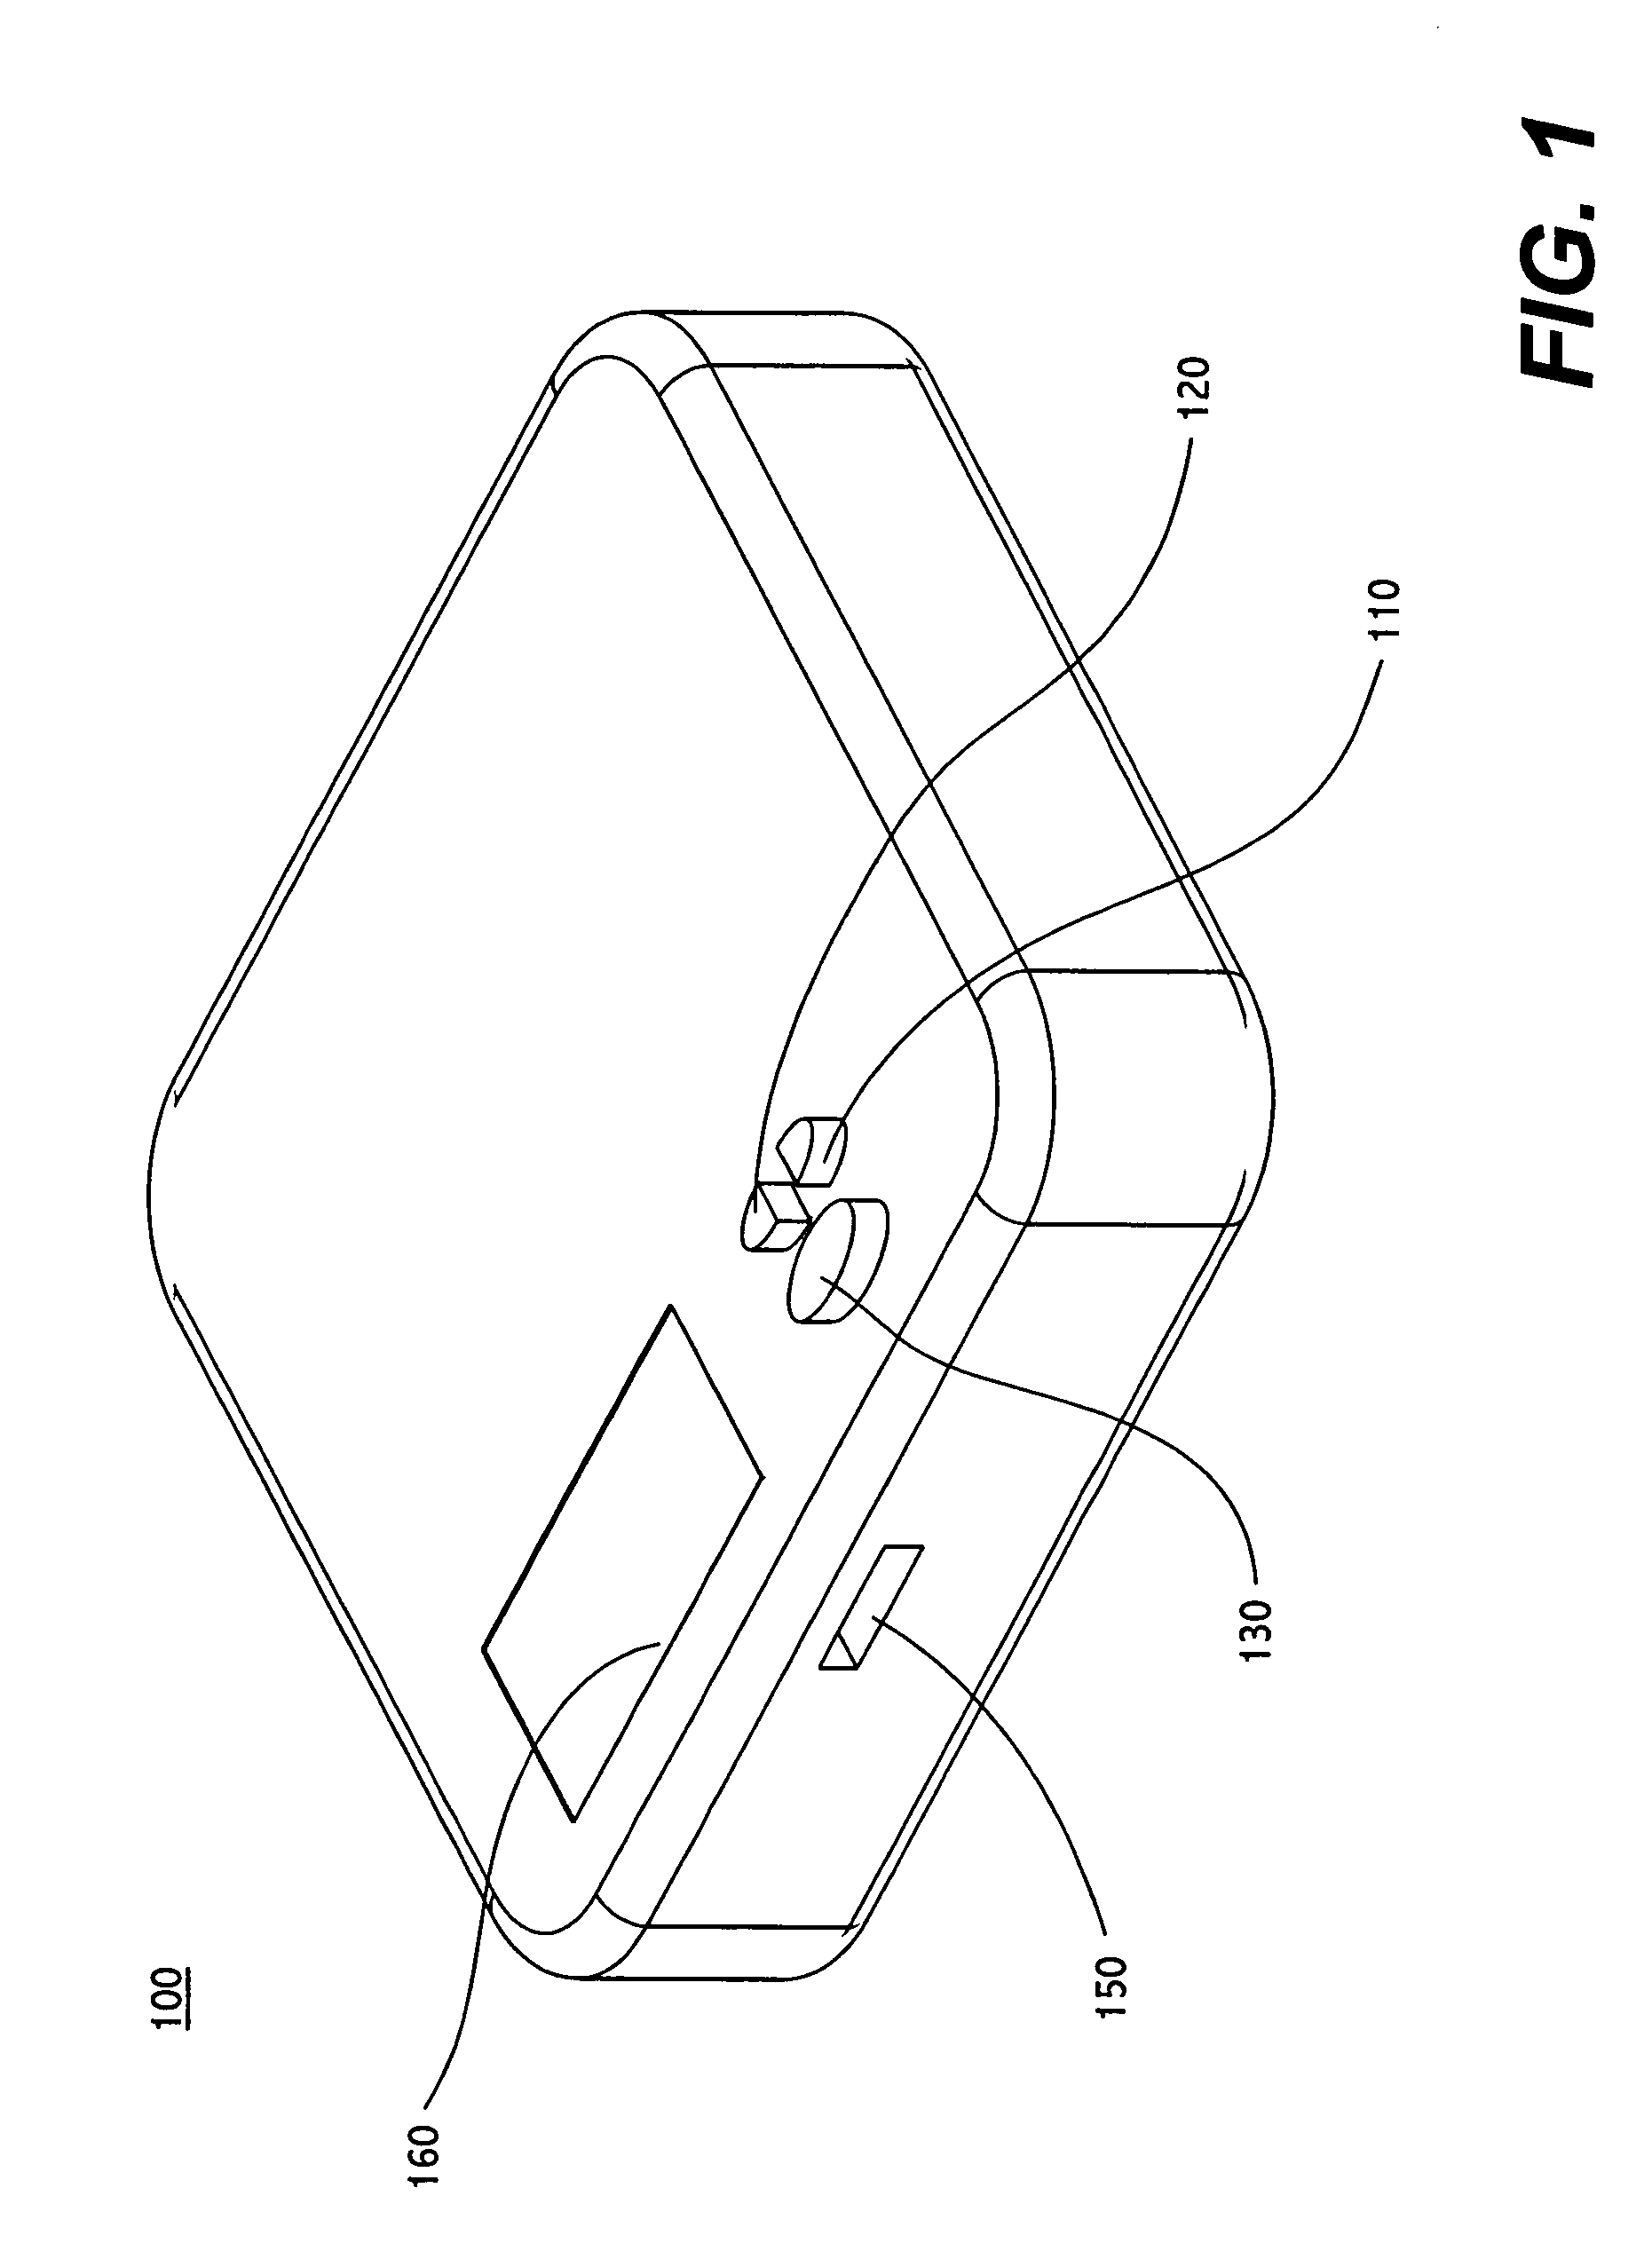
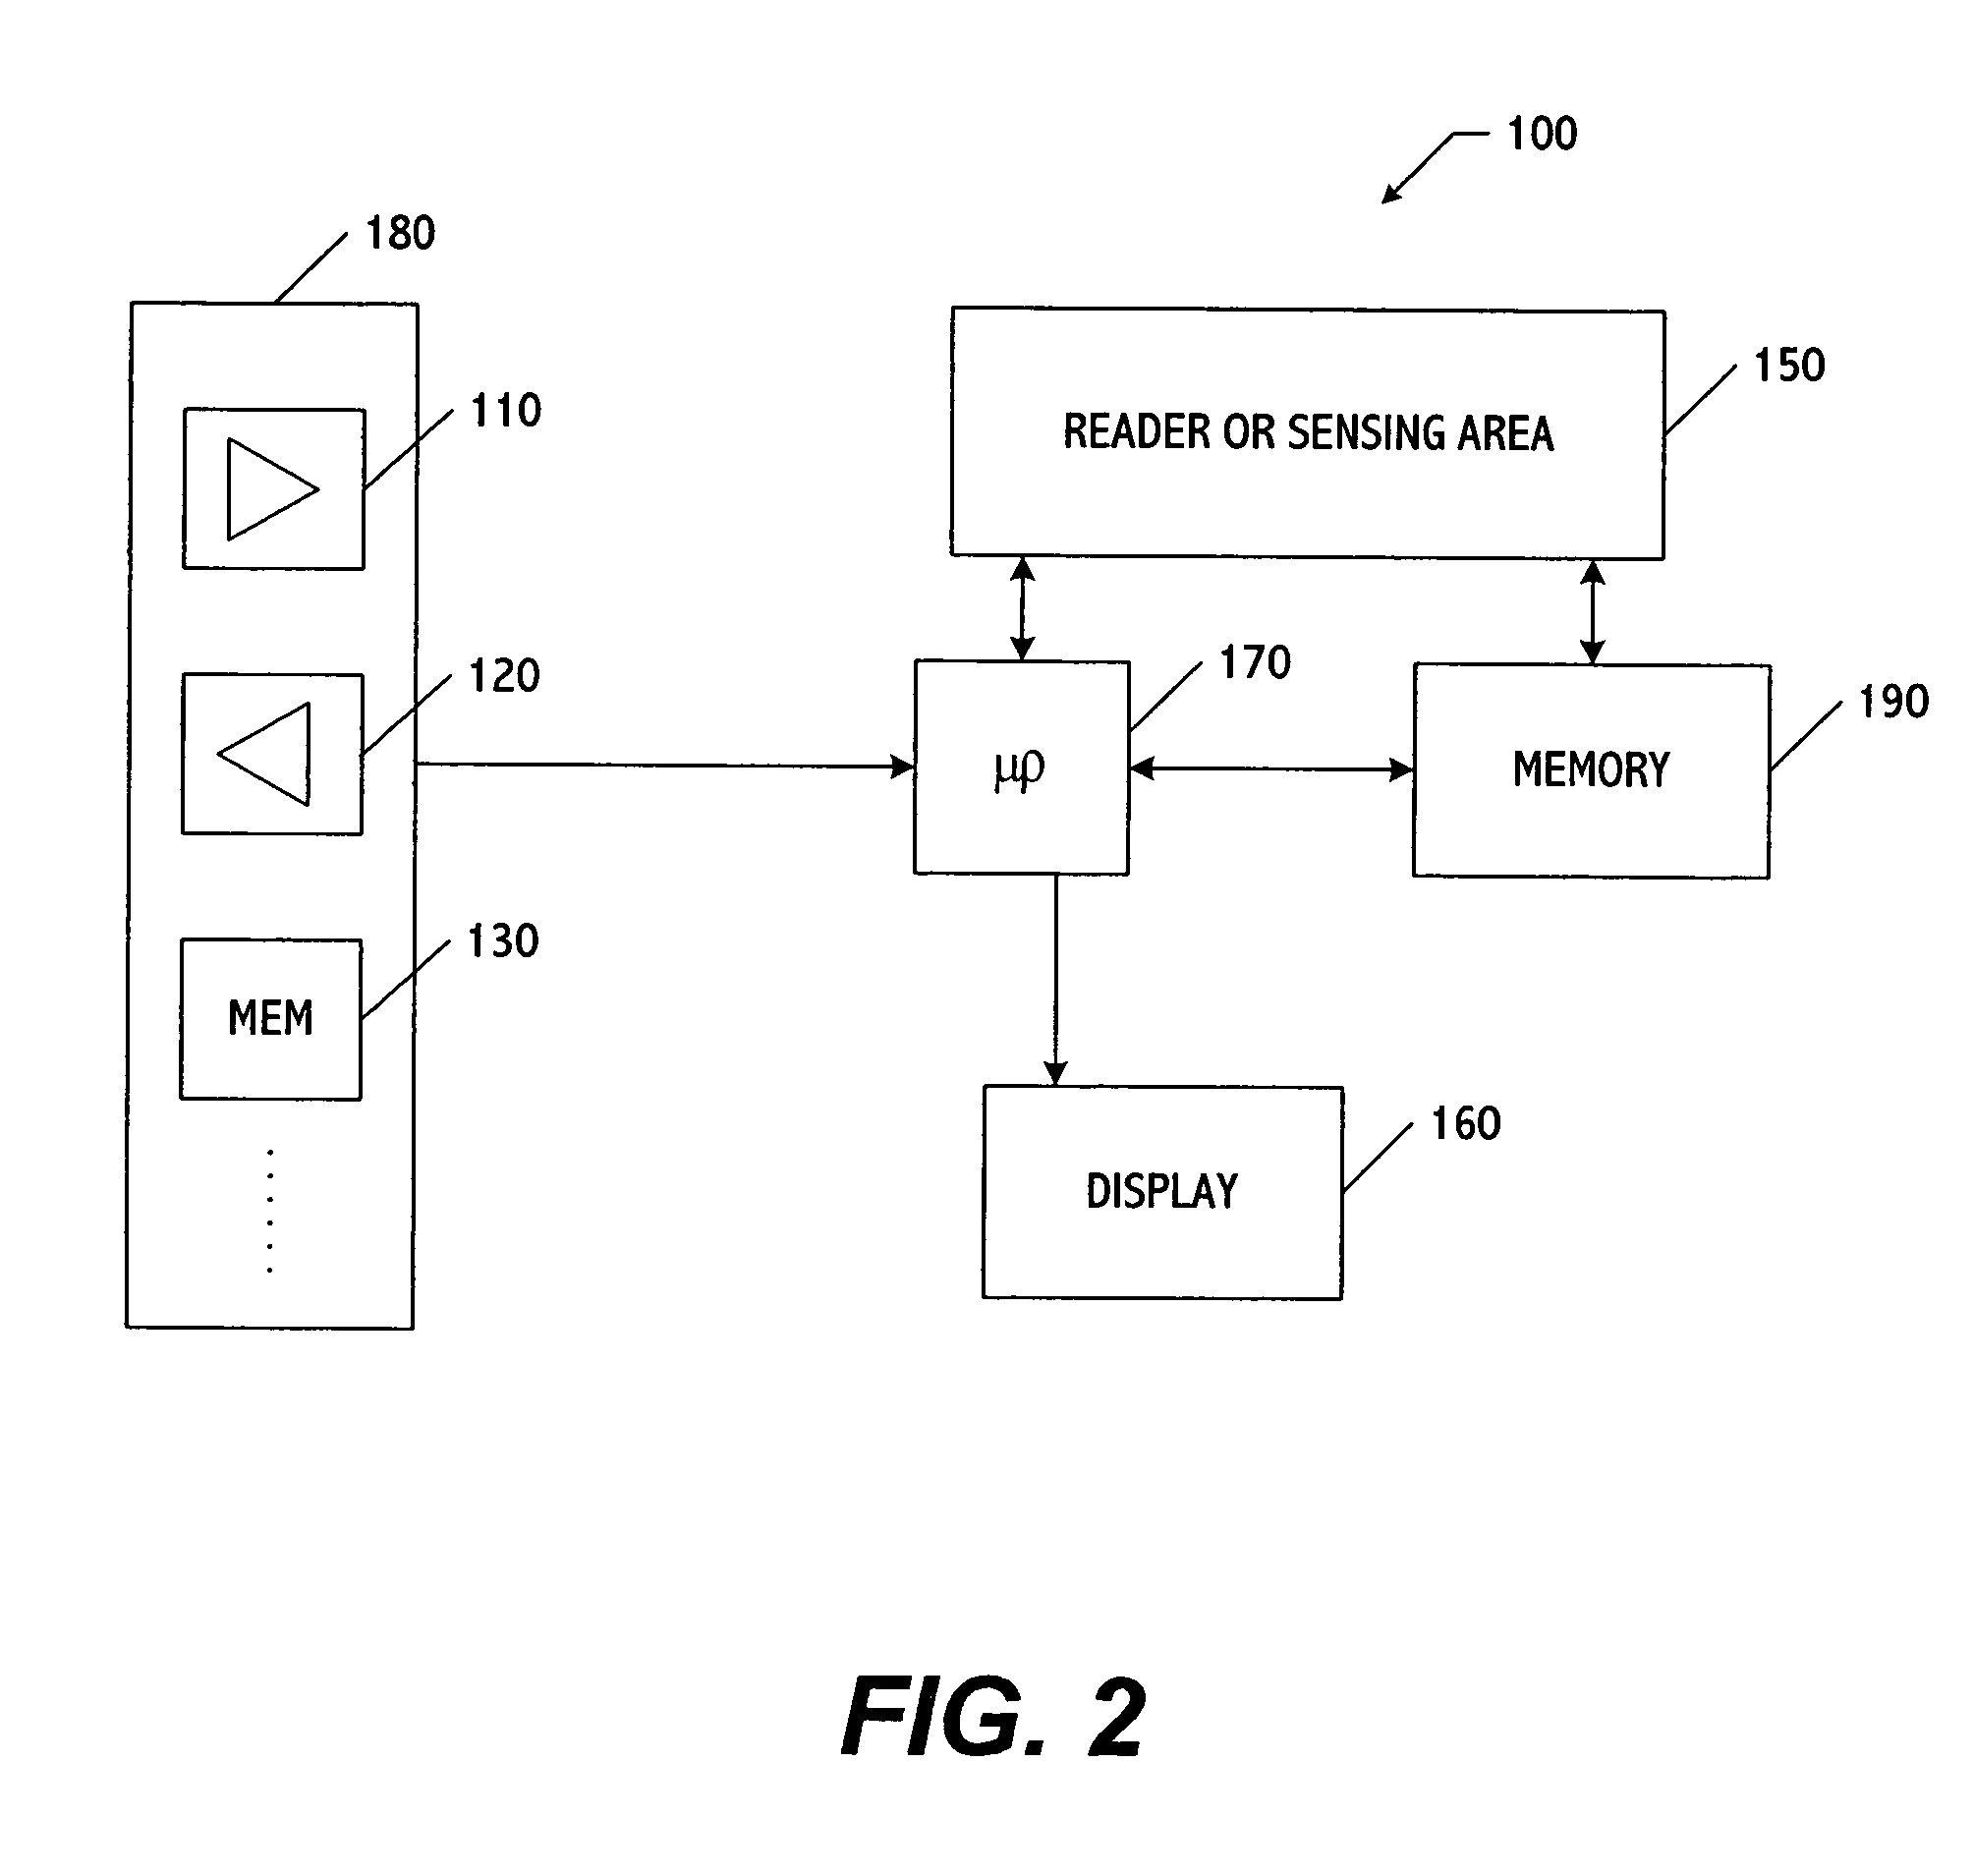
[0031]A Lunchtime EMA is calculated at 180 mg / dl and displayed on the LCD 160. The constituent values of the EMA are 162 mg / dl, 204 mg / dl and 174 mg / dl, which are displayed to the patient on the LCD 160 of the blood glucose meter 100. The EMA and the constituent values are preferably displayed via a series screens, each with a respective one of the values, as will be described below in connection with FIGS. 6 and 7. It is to be understood that displays can be generated with different groupings of the EMA and its constituent values and remain within the scope of the present invention. Since the EMA is 180 and the individual values have little variation, at 162, 204 and 174, a patient could safely increase the breakfast dose of a short acting insulin by a small amount, for example, 1 unit.

example 2

[0032]A Lunchtime EMA is calculated at 180 mg / dl. The constituent values of the EMA are 75 mg / dl, 297 mg / dl and 168 mg / dl which are displayed to the patient on the LCD 160 of the blood glucose meter 100 preferably via a series of screens. Since the EMA is 180 and the individual values have significant variation, at 75, 297 and 168, a patient could not safely increase the breakfast dose of a short acting insulin, even by a small amount such as 1 unit. A patient could then decide why there is so much variation, whether it be changes in diet, exercise or stress level.

example 3

[0033]A Lunchtime EMA is calculated at 180 mg / dl. The constituent values of the EMA are 162 mg / dl, 204 mg / dl and 174 mg / dl which are displayed to the patient on the LCD 160 of the blood glucose meter 100, along with an EMA indicator (e.g., a standard deviation). Since the EMA is 180 and the individual values have little variation, at 162, 204 and 174, as indicated by the EMA indicator, a patient could safely increase the breakfast dose of a short acting insulin by a small amount, for example, 1 unit.


PUM

PropertyMeasurementUnit
timeaaaaaaaaaa
timeaaaaaaaaaa
timeaaaaaaaaaa

Abstract

A method of presenting glucose data to a person with diabetes from a blood glucose meter is provided in which an effective meal average (EMA) value is presented, followed by two or more of the individual values that make up the EMA, to provide improved feedback data for clinical decisions by patients who need to alter their dose of insulin. The EMA can also comprise a measure of the variability of its constituent values. The EMA encompasses those values that occur at specified times such as 1 hour before and 1 hour after a specified meal time. The EMA is calculated over a limited number of days previous to the calculation (e.g., 3 days) and has a minimum number of values that must be obtained within the time and date ranges. An algorithm allows for exclusion of any given reading from the average (e.g., post-prandial or control solution readings). Patients can use 1 to 8 EMA on any given date range (e.g., preferably 4, that is, breakfast, lunch, supper and bedtime snack).

Description

[0001]This application claims priority from U.S. Provisional Application Ser. No. 60 / 409,965 filed Sep. 11, 2002, the contents of which are expressly incorporated herein by reference in their entirety.CROSS-REFERENCE TO RELATED APPLICATIONS[0002]Related subject matter is disclosed in a copending U.S. patent application of Gordon et al, entitled “A System and Method for Integrating Data with Guidelines to Generate Displays Containing the Guidelines and Data”, Ser. No. 09 / 985,173, filed Nov. 1, 2001; and in a copending U.S. patent application of Gordon, entitled “System and Method for Assessment and Corrective Action Based on Guidelines”, Ser. No. 10 / 153,883, filed May 24, 2002; the entire contents of both applications being incorporated herein by reference.FIELD OF THE INVENTION[0003]The invention relates generally to blood glucose meters and glucose monitoring for managing diabetes and, more particularly, to presentation of glucose data to a user in a convenient format, including an...

Claims


Application Information

Patent Timeline
Patent Type & Authority Patents(United States)
IPC IPC(8): A61B5/00A61B5/145G01N33/66G06F19/00
CPCA61B5/14532A61B5/7445G06F19/3406A61B5/7475A61B2562/0295G16H40/63G16H10/60A61B5/7271A61B5/7405A61B5/742A61B2560/0475A61B5/6801A61B5/746
Inventor GINSBERG, BARRY H.
Owner EMBECTA CORP
Why Eureka
Try Eureka