Automatic analysis device

An automatic analysis device, technology of noise components, applied in the direction of analysis of materials, measurement devices, biological material analysis, etc.

Active Publication Date: 2011-10-12
HITACHI HIGH-TECH CORP
View PDF9 Cites 17 Cited by
  • Summary
  • Abstract
  • Description
  • Claims
  • Application Information

AI Technical Summary

Problems solved by technology

Therefore, even if the absorbance of the subject cannot be measured, it is possible to perform high-precision measurement

Method used


Image

  • Automatic analysis device
  • Automatic analysis device
  • Automatic analysis device

Examples


Embodiment approach 1

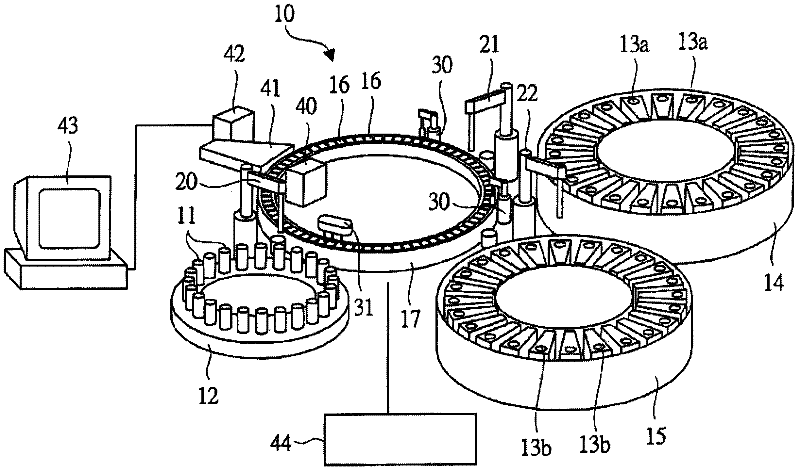
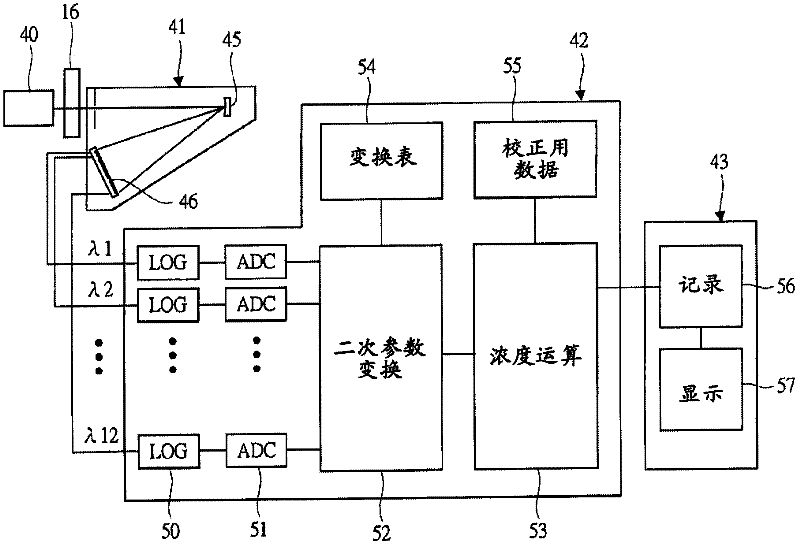
[0053] figure 1 It is a schematic perspective view showing the outline of one embodiment of the automatic analyzer of the present invention. figure 2 is description figure 1 The structure explanatory diagram of the structure of the signal processing part of the automatic analysis device.

[0054] Such as figure 1 As shown, the automatic analysis device 10 has a sample disk 12 that can be loaded with a plurality of sample containers 11 that hold samples; a first sample that can be loaded with a plurality of reagent containers 13a, 13b that respectively hold a first reagent or a second reagent. The drug disk 14 and the second reagent disk 15; and the reaction disk 17 in which a plurality of reaction containers 16 are arranged along the circumferential direction.

[0055] A sample probe (sample probe) 20 for dispensing (discharging) the sample sucked from the sample container 11 into the reaction container 16 is provided between the reaction disk 17 and the sample disk 12 . ...

Embodiment approach 2

[0089] Embodiment 2 of the present invention is the same as Embodiment 1 except for the calculation method in the variable conversion unit 52 , so description of the same matters will be omitted as much as possible.

[0090] In Embodiment 2, the variable conversion unit 52 uses a function D(λ, λ12) defined by the difference between the absorbance ABS(λ) at each wavelength λ and the absorbance ABS(λ12) at the longest wavelength λ12, and a weighting function W(λ), gain function G(λ), and the quadratic parameter Pa2 are calculated as follows.

[0091] Pa2=W(λ1)G(λ1)D(λ1,λ12)+W(λ2)G(λ2)D(λ2,λ12)+...+W(λ11)G(λ11)D(λ11,λ12)

[0092] In the formula, let

[0093] D(λi, λj)=ABS(λi)-ABS(λj)

[0094] W(λ1)+W(λ2)+...+W(λ11)=1

[0095] G(λ1)=C·exp(kλ). C is a constant.

[0096] The value of W(λ) also depends on the absorbance, and changes such that the absorbance decreases at relatively large wavelengths and small wavelengths, and becomes large at wavelengths between the large and sma...

Embodiment

[0111] The present invention will be further described below based on the examples. In addition, these Examples do not limit this invention.

[0112] Figure 6 It is a graph plotting the analysis results of the conventional method and the method of Embodiment 1 by using Nanopia CRP of Sekisui Pharmaceutical Co., Ltd. as a reagent and administering a low concentration of CRP to the sample for control serum. The horizontal axis is the concentration of the sample, and the vertical axis is the analysis result. In the existing method, as the difference between the two wavelengths of the main wavelength of 570nm and the secondary wavelength of 800nm, the difference between the two measurements at 45 seconds and 300 seconds after the start of the reaction is used, and the known reagents with concentrations of 0mg / dL and 0.05mg / dL are used. The calibrated value of the sample was converted to the concentration.

[0113] In Embodiment 1, it is necessary to determine the value of k an...


PUM


Abstract

Provided are highly precise automatic analysis devices capable of both measurement over a wide concentration range and increased sensitivity at low concentrations. Signals of multiple wavelengths Lambda1-Lambda12 from a light source (40) and that are highly susceptible to light absorption by microparticles are converted to absorbances in a spectrophotometric system (detector 41). The absorbances are converted using a previously defined conversion table (54) to secondary parameters wherein the noise component has been cancelled. Based on said secondary parameters, the concentration of the measured substance (prescribed component) is calculated by a calculating unit (computing means 53). Analysis up to high concentrations and that is resistant to noise even at low concentrations is thereby made possible.

Description

technical field [0001] The present invention relates to an automatic analyzer for automatically analyzing components such as blood. Background technique [0002] Absorptiometry is known as one of methods widely used in automatic analysis of blood. In this absorptiometry, a biological sample and a reagent are mixed in a reaction container, light is irradiated to the prepared reaction solution, absorbance, which is the attenuation of light of a specific wavelength, is measured, and the analysis target is calculated from the relationship between absorbance and concentration. concentration of the ingredients. The concentration and absorbance of this component establish a linear proportional relationship in many cases. [0003] In absorptiometry, as a technique to reduce the influence of noise caused by air bubbles in the reaction vessel on the analysis results, it is known to measure the absorbance at a sub-wavelength other than the absorbance at a specific wavelength, and use...

Claims


Application Information

Patent Timeline
Patent Type & Authority Applications(China)
IPC IPC(8): G01N35/00G01N21/27
CPCG01N21/274G01N21/17G01N21/27G01N21/62G01N21/82G01N35/025G01N2201/129G01N2201/1293Y10T436/111666
Inventor 山崎功夫石泽宏明足立作一郎
Owner HITACHI HIGH-TECH CORP
Why Eureka
Try Eureka