Supercharge Your Innovation With Domain-Expert AI Agents!

Unstructured data visualization method based on stereographic mapping

An unstructured data and layout algorithm technology, applied in electrical digital data processing, special data processing applications, instruments, etc., can solve problems such as inability to present metadata items, inability to intuitively reflect node data details, etc., and achieve good interaction intent. Effect

Active Publication Date: 2014-11-26
INST OF SOFTWARE - CHINESE ACAD OF SCI
View PDF1 Cites 0 Cited by
  • Summary
  • Abstract
  • Description
  • Claims
  • Application Information

AI Technical Summary

Problems solved by technology

However, these existing hierarchical information visualization technologies are not suitable for unstructured data such as images, as follows: 1) These methods use dots or rectangles with simple label information and the same size to represent nodes, which cannot directly reflect the nodes themselves. data details
2) Unstructured data contains metadata items that are interdependent and have internal hierarchical associations. The existing hierarchical information visualization technology cannot present these metadata items and their interrelationships

Method used


Image

  • Unstructured data visualization method based on stereographic mapping
  • Unstructured data visualization method based on stereographic mapping
  • Unstructured data visualization method based on stereographic mapping

Examples


Embodiment Construction

[0027] In order to make the purpose, features and advantages of the present invention more comprehensible, the present invention will be described in detail below through specific embodiments and accompanying drawings.

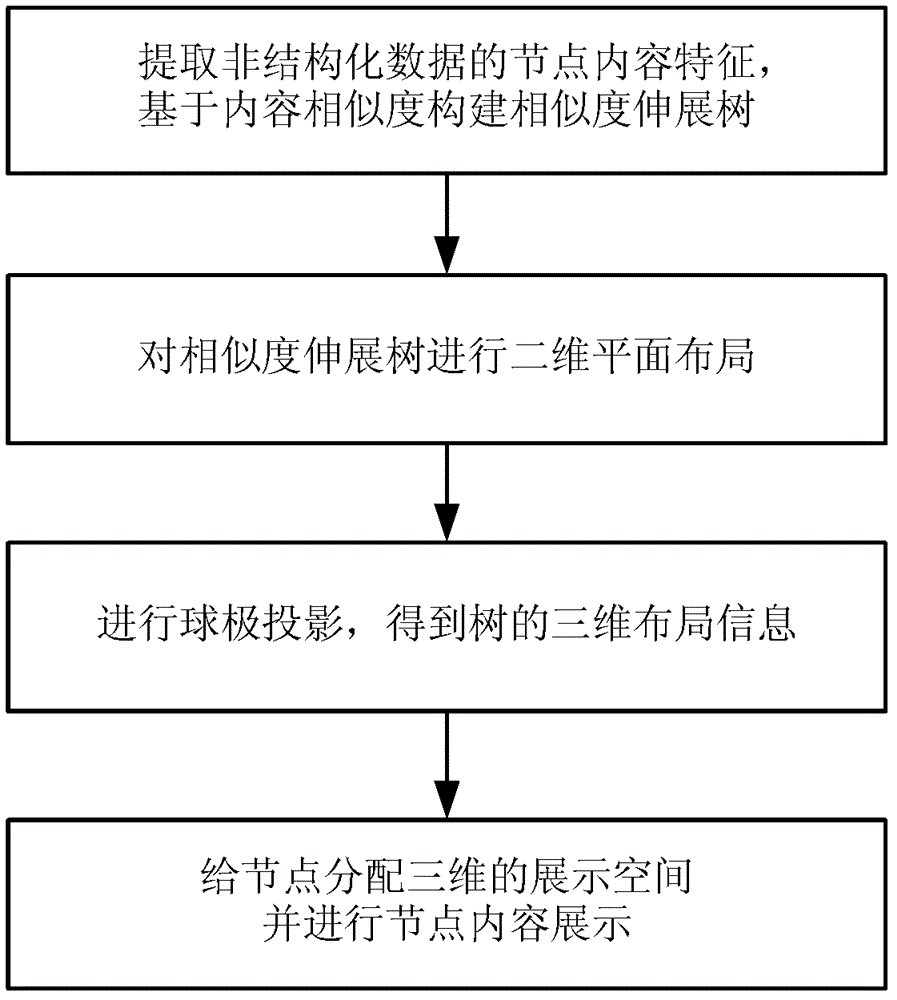
[0028] The flow of the unstructured data visualization method based on spherical mapping in this embodiment is as follows figure 1 As shown, the specific description of each step is as follows:

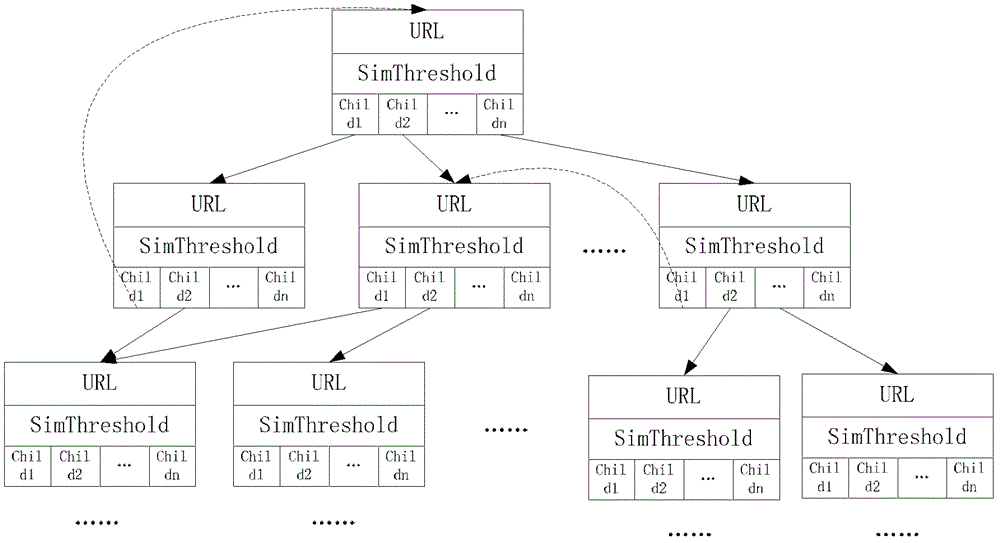
[0029] 1) Extract the node content features of unstructured data, physically organize and store unstructured data based on content similarity, and build a similarity extension tree.

[0030] The method of the present invention is mainly suitable for unstructured data, but it can also be used for structured data, and the advantages and positive effects are more obvious when applied to unstructured data. Unstructured data includes data types such as text, images, and videos, as well as generalized unstructured data such as 3D modeling. Data content is reflected in dat...


PUM


Abstract

The invention provides an unstructured data visualization method based on stereographic mapping. The method comprises the following steps: at first, extracting a node content characteristic of unstructured data, carrying out physical organization and storage on the unstructured data based on content similarity, and constructing a similarity stretch tree; secondly, carrying out planar configuration on the similarity stretch tree; thirdly, carrying out complex spherical projection on the similarity stretch tree based on stereographic projection to obtain three-dimensional layout information of the similarity stretch tree; at last, distributing a three-dimensional exhibition space for the unstructured data according to the three-dimensional layout information so as to show a visualization content. The invention provides multiple interactive technologies to help the user to gather nodes, compare and analyze, in comparison with the conventional organization and visualization method, the method is more efficient and natural.

Description

technical field [0001] The invention belongs to the technical field of computer information processing and visualization, and in particular relates to a non-structured data visualization method based on spherical mapping. Background technique [0002] Information visualization was first proposed in a seminar organized by the National Visualization and Analysis Center established by the US Security Agency in 2005. It mainly studies how to assist users in analytical reasoning through interactive visual interfaces, and provides tools and technologies to assist users in analysis and decision-making. It enables users to comprehensively analyze information from massive, dynamic, and fuzzy data and gain insights into hidden laws and patterns. At present, with the development of computer technology, storage technology and network technology, organizing and visualizing data in a hierarchical structure (also known as a tree structure) is the best way to present massive information in ...

Claims


Application Information

Patent Timeline
Patent Type & Authority Patents(China)
IPC IPC(8): G06F17/30
Inventor 滕东兴闫奎名樊银亭王宏安
Owner INST OF SOFTWARE - CHINESE ACAD OF SCI
Features
  • R&D
  • Intellectual Property
  • Life Sciences
  • Materials
  • Tech Scout
  • Unparalleled Data Quality
  • Higher Quality Content
  • 60% Fewer Hallucinations
Learn More