

Drawing method for trend curve of large dataset
A curve drawing and large data volume technology, applied in the direction of electrical digital data processing, special data processing applications, instruments, etc., can solve the problems of limited accuracy of curve expression, failure to consider multiple eigenvalues, poor approximation, etc., to achieve saving System overhead, small amount of calculation, good approximation effect
Inactive Publication Date: 2014-11-26
BEIHANG UNIV
View PDF5 Cites 0 Cited by
- Summary
- Abstract
- Description
- Claims
- Application Information
AI Technical Summary
Problems solved by technology
[0007] The technical problem to be solved by the present invention is: for large amount of data, the approximation degree of using uniform sampling is poor, and the calculation amount of using non-uniform sampling is relatively large, and the situation of multiple characteristic values in an interval segment is not considered in the realized curve display query The accuracy of the curve expression is limited; for these problems, the present invention proposes a method for drawing a trend curve with a large amount of data
Method used
View moreImage
Smart ImageViewing Examples

Examples
Embodiment
[0055] In the embodiment of the present invention, the time interval is 1s, and a total of 2,500 simulation data of 2,500s are collected, and 150s of them are taken as an example below, and the method of the present invention is illustrated by taking the drawing of a section of the curve as an example.
[0056]
[0057] ……
[0058]
[0059] ……
[0060]
[0061] Step 1: Divide 50s of data into one segment and divide it into 50 time segments, each of which has 50 data segments. In the embodiment of the present invention, three segments are taken as an example, a total of 150 data segments are divided into 3 segments, N=3 .
[0062] [T 0 , T 1 ]
[0063]
[0064]
Login to View More PUM
 Abstract
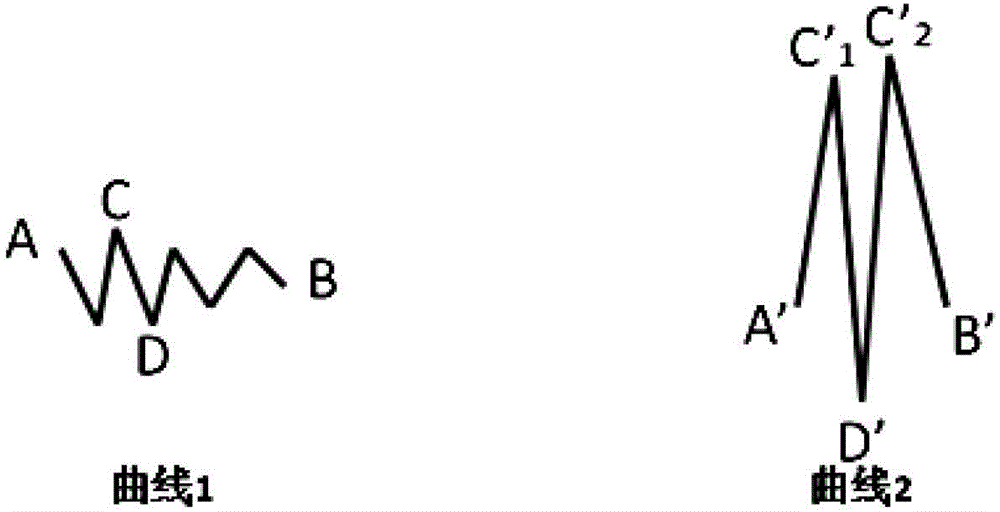
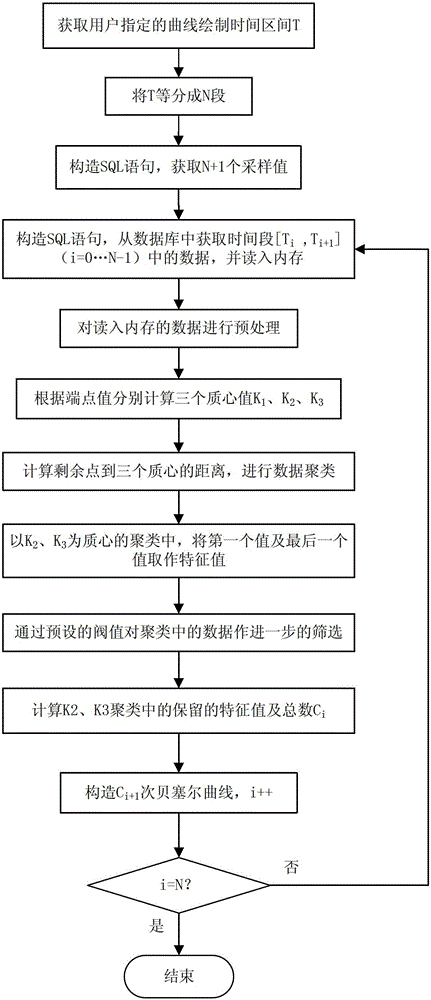
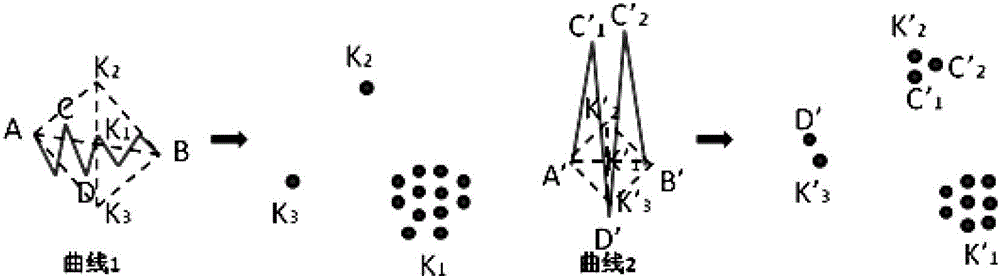
The invention brings forward a drawing method for a trend curve of large dataset used for computer data statistics analysis. According to the method, sample interval is firstly determined, time quantum is equally divided, and characteristic value is determined. Firstly, pretreatment is carried out to sampled value of the time quantum, and some values are ignored; then three centroids K1, K2 and K3 are selected from the time quantum, clustering is carried out on the kept values, each value is classified to the clustering represented by the nearest centroid to the value; after clustering, the first value and the last value of the K2 and K3 clustering are taken as characteristic constants, screening is carried out to the kept values of K2 and K3 to obtain the characteristic value; lastly, the number of characteristic value is determined, and curve is drawn by utilizing a Bessel curve approximation algorithm. According to the invention, minimum sample values are adopted to draw the most approximate curve, independent of querying all data at a time and reading all data into memory at a time. The method provided in the invention greatly saves system overhead and realizes rapid drawing of large dataset.
Description
technical field [0001] The invention belongs to the field of statistical analysis of computer data, in particular to a method for drawing a trend curve of a large amount of data. Background technique [0002] A trend graph is a graph that uses the continuous change of the curve to reflect the dynamic changes of things by statistical data at a certain time interval. The trend graph reflects the dynamic change process of things by means of the ups and downs of the continuous curve. [0003] With the rapid development of information technology, the volume of industry data has increased dramatically. Statistical analysis of data can aid in industry decision making. For example, for industries that are dominated by transactional data, such as finance and retail, it is the demand of such users to analyze the data and quickly extract information with commercial value. For industries such as medicine and meteorology that need to store a large amount of monitoring information, the...
Claims
Login to View More Application Information
Patent Timeline
 Patent Type & AuthorityPatents(China)
IPC IPC(8): G06F19/00G06F17/30
Inventor李睿吕江花马世龙
OwnerBEIHANG UNIV