
Microclimate and thermal environment data information graph and display method

A technology of data information and microclimate, applied in the field of data information graphs, can solve problems such as gaps, less consideration of influence, and lack of research on the interaction between buildings and microclimate

Active Publication Date: 2012-11-07
WUHAN UNIV OF TECH
View PDF3 Cites 13 Cited by
  • Summary
  • Abstract
  • Description
  • Claims
  • Application Information

AI Technical Summary

Problems solved by technology

However, the current achievements and patents on building energy conservation at home and abroad are mainly reflected in the research on the thermal environment or energy-saving design of a given project based on the overall external climate, and less consideration is given to the influence of the urban regional environment on the microclimate and building energy consumption. , the systematic research on regional microclimate and its influencing factors is still blank; at the same time, the research on the interaction between buildings and microclimate in cities is also relatively scarce
In addition, domestic and foreign research results on building energy consumption and regional microclimate are mostly displayed in the form of reports, charts, and data. It is rare to achieve dynamic query and display by combining computer database technology to create data information graphs

Method used


Image

  • Microclimate and thermal environment data information graph and display method
  • Microclimate and thermal environment data information graph and display method
  • Microclimate and thermal environment data information graph and display method

Examples


Embodiment Construction

[0029] The present invention will be further described below in conjunction with the accompanying drawings and specific embodiments.

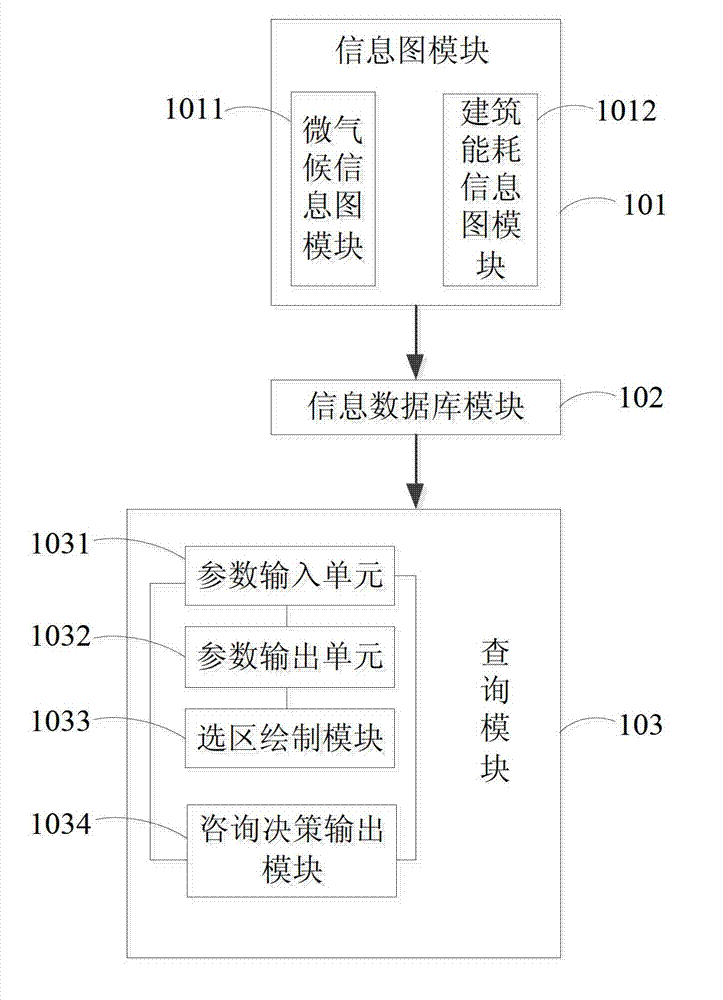
[0030] Such as figure 1 As shown, the microclimate and thermal environment data information system includes: an information map module 101, an information database module 102 and a query module 103, and the information map module 101, the information database module 102 and the query module 103 are connected in sequence.

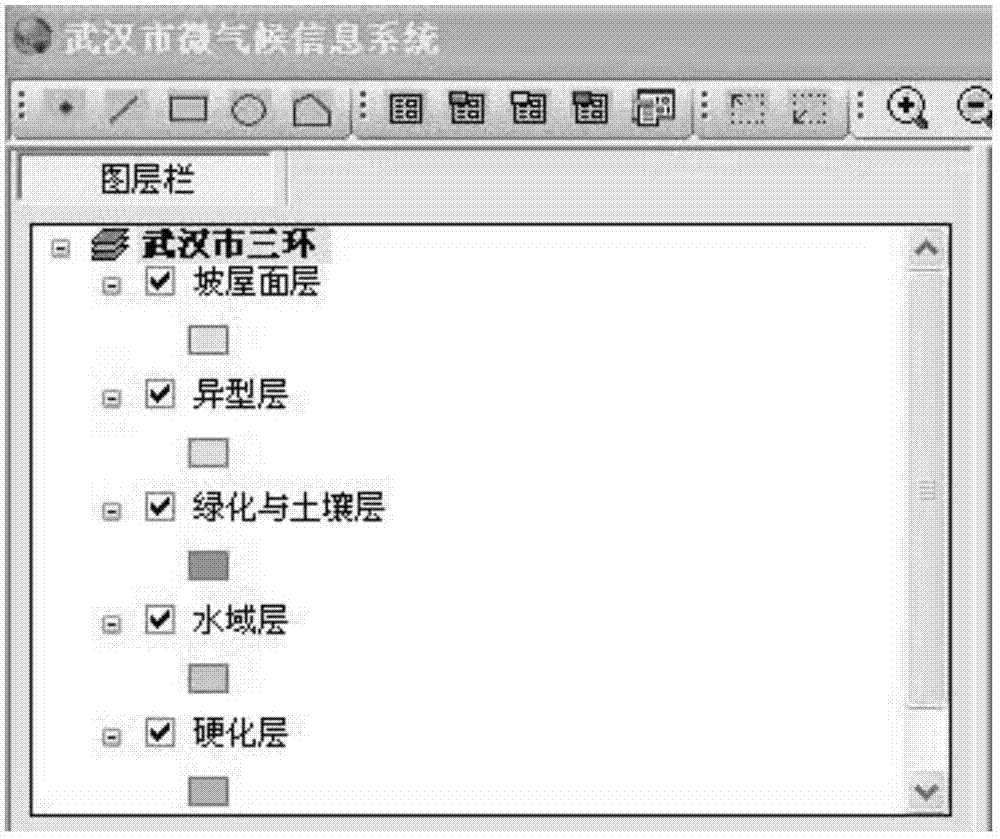
[0031] Among them, the information map module 101 proposes and establishes different layers for different objects, and it includes a microclimate information map module 1011 and a building energy consumption information map module 1012 . The calculation framework of the information map module 101 is completed based on the layer data attributes of the classification method, wherein the layer data attributes of the microclimate information map are material types, including five types of sloping roofs, water areas, greening and ...


PUM


Abstract

The invention discloses a microclimate and thermal environment data information graph and a display method. The microclimate and thermal environment data information graph comprises information graph modules of different graph layers, an information database module and a query module, wherein the information graph modules are put forward and established according to different objects; the information database module is used for establishing a microclimate and thermal environment database; and the query module is connected with the information graph modules and the information database module respectively, and used for outputting the corresponding data information according to the selected information. The microclimate and thermal environment information is combined with a computer database, so that the required data is dynamically displayed by a computer through query selection, the required information can be acquired intuitively and quickly, and energy-saving research on the urban thermal environment and buildings are contributed.

Description

technical field [0001] The invention relates to a data information map, in particular to a microclimate and thermal environment data information map and a display method, which are used for energy-saving research on urban thermal environment and buildings. Background technique [0002] With the rapid development of my country's economic construction, the shortage of resources and energy has become a major problem, and the situation of energy conservation and emission reduction is becoming more and more severe. How to reduce building energy consumption has become an issue of increasing concern to people. However, the current achievements and patents on building energy conservation at home and abroad are mainly reflected in the research on the thermal environment or energy-saving design of a given project based on the overall external climate, and less consideration is given to the influence of the urban regional environment on the microclimate and building energy consumption. ...

Claims


Application Information

Patent Timeline
Patent Type & Authority Applications(China)
IPC IPC(8): G06F17/30
CPCY02D10/00
Inventor 邹源刘小泾李翠华
Owner WUHAN UNIV OF TECH
Learn More