
A data display method in distribution network automation system

A distribution network automation and data display technology, applied in the direction of electrical digital data processing, special data processing applications, instruments, etc., can solve the problem that the data display method cannot meet the real-time requirements of distribution network data

Active Publication Date: 2017-03-15
STATE GRID CORP OF CHINA +2
View PDF3 Cites 0 Cited by
  • Summary
  • Abstract
  • Description
  • Claims
  • Application Information

AI Technical Summary

Problems solved by technology

[0010] The above is the traditional data display method. The data display method of this method cannot meet the real-time requirements of the current distribution network data.

Method used


Image

  • A data display method in distribution network automation system
  • A data display method in distribution network automation system

Examples


Embodiment Construction

[0038] The present invention will be described in further detail below in conjunction with the accompanying drawings.

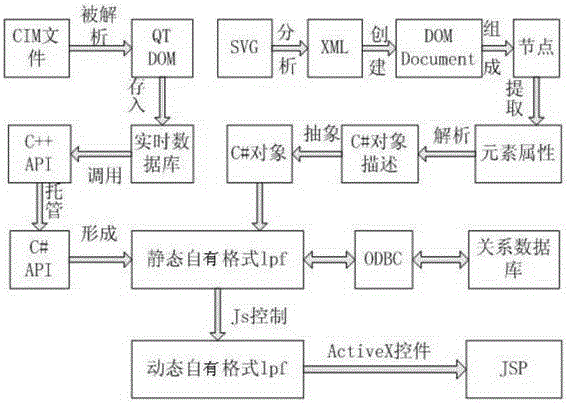
[0039] The invention is a data display method in the distribution network strictly following the function specification of the distribution network automation system. The technical scheme of the invention is mainly aimed at the method for displaying data of real-time database and relational database in the distribution network automation system.

[0040] Most manufacturers display standard SVG images on the page, but they also use custom-format image display, because they can customize image formats that are more in line with business characteristics according to unique business characteristics and editing tools. For example, the vector diagram in the format of lpf (proprietary format for describing two-dimensional vector graphics) is a vector diagram in its own format, which is generated by a specially customized configuration tool, which is mainly written i...


PUM


Abstract

The invention discloses a data display method in a power distribution network automated system. The method includes the steps that an SVG standard vector diagram is converted into a C# object; a CIM file, namely a common information model file, is analyzed and mapped to elements of a lpf vector diagram; the lpf vector diagram obtains a measurement point topological relation from a relation database; a dynamic lpf is embedded into a JSP through an ActiveX control, and a configuration graph is displayed in a WEB page. The data display method solves the real-time display problem of data in a real-time database and data in the relation database in power distribution network automated system environment; on the premise that an existing power distribution network system is not changed, common information model analysis is finished, the SVG vector diagram is converted into a lpf diagram with an owned format, the information is displayed in the lpf diagram, and then javascript and the ActiveX control are embedded into the lpf diagram, so that the data in the real-time database and the data in the relation database are displayed in real time on the JSP.

Description

technical field [0001] The invention belongs to the technical field of distribution network automation systems, in particular to a data display method in the distribution network automation system. Background technique [0002] Scalable Vector Graphics (Scalable Vector Graphics, SVG) is a graphic format based on Extensible Markup Language (XML) for describing two-dimensional vector graphics. SVG is developed by W3C and is an open standard. [0003] The Document Object Model (DOM for short) is a standard programming interface recommended by the W3C organization for processing Extensible Markup Language. [0004] ActiveX is Microsoft's name for a series of strategic object-oriented programming technologies and tools, the main technology of which is Component Object Model (COM). In networks with directory and other support, COM becomes Distributed COM (DCOM). When creating a program that includes ActiveX, the main job is the component, a program that can be self-sufficient t...

Claims


Application Information

Patent Timeline
Patent Type & Authority Patents(China)
IPC IPC(8): G06F9/44G06F17/30
Inventor 张军六熊莉娟王凤萍宋宏艳王春龙张惠敏尚海燕原军
Owner STATE GRID CORP OF CHINA
Learn More