
Layered network topology visualizing method and system

A technology of network topology and topology data, applied in the IT field, can solve problems such as inability to support mobile devices, long loading time, affecting user experience, etc.

Active Publication Date: 2014-06-18
INST OF ACOUSTICS CHINESE ACAD OF SCI +1
View PDF8 Cites 44 Cited by
  • Summary
  • Abstract
  • Description
  • Claims
  • Application Information

AI Technical Summary

Problems solved by technology

[0005] Through the analysis of existing technologies and patents, the existing public technologies either use DOM-based methods such as SVG and VML to achieve Web-based topology map rendering, which is relatively poor in dynamic performance and performance, or are based on Flash plug-ins. Implementation, long loading time, affecting user experience
Also, none of the above methods work well with mobile devices

Method used


Image

  • Layered network topology visualizing method and system
  • Layered network topology visualizing method and system
  • Layered network topology visualizing method and system

Examples


Embodiment Construction

[0080] The implementation method of the topology map based on HTML5 will be described in detail below in conjunction with the accompanying drawings.

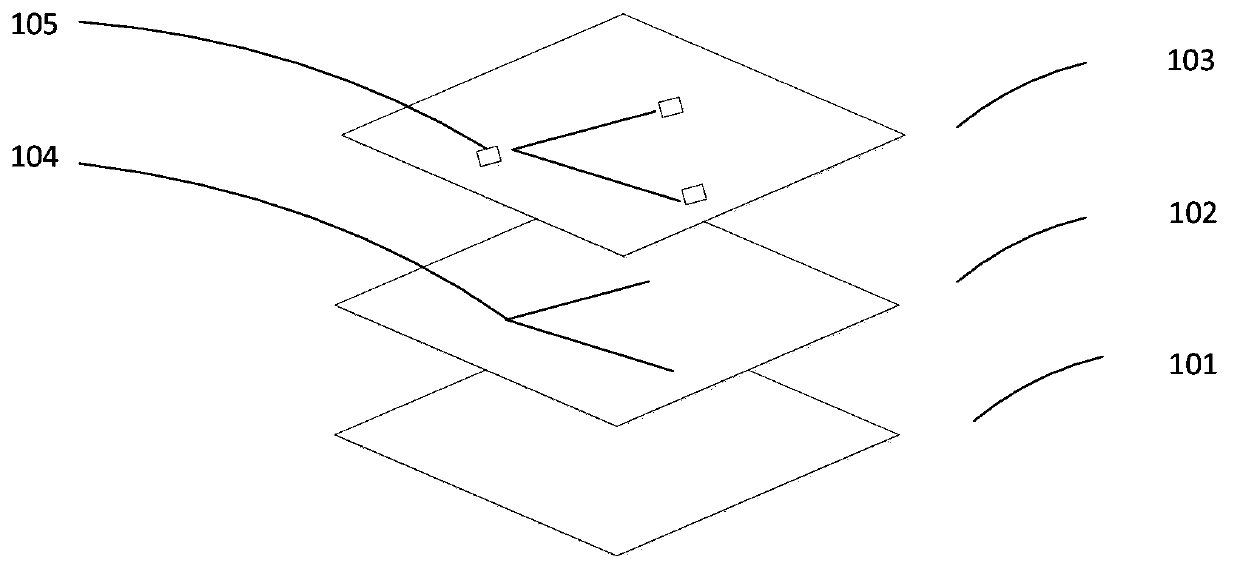
[0081] The layered network topology visualization method provided by the present invention divides the browser canvas into a background layer, a link layer, a node layer, a drag layer and a text layer, and renders in the corresponding layer according to the topology data type;

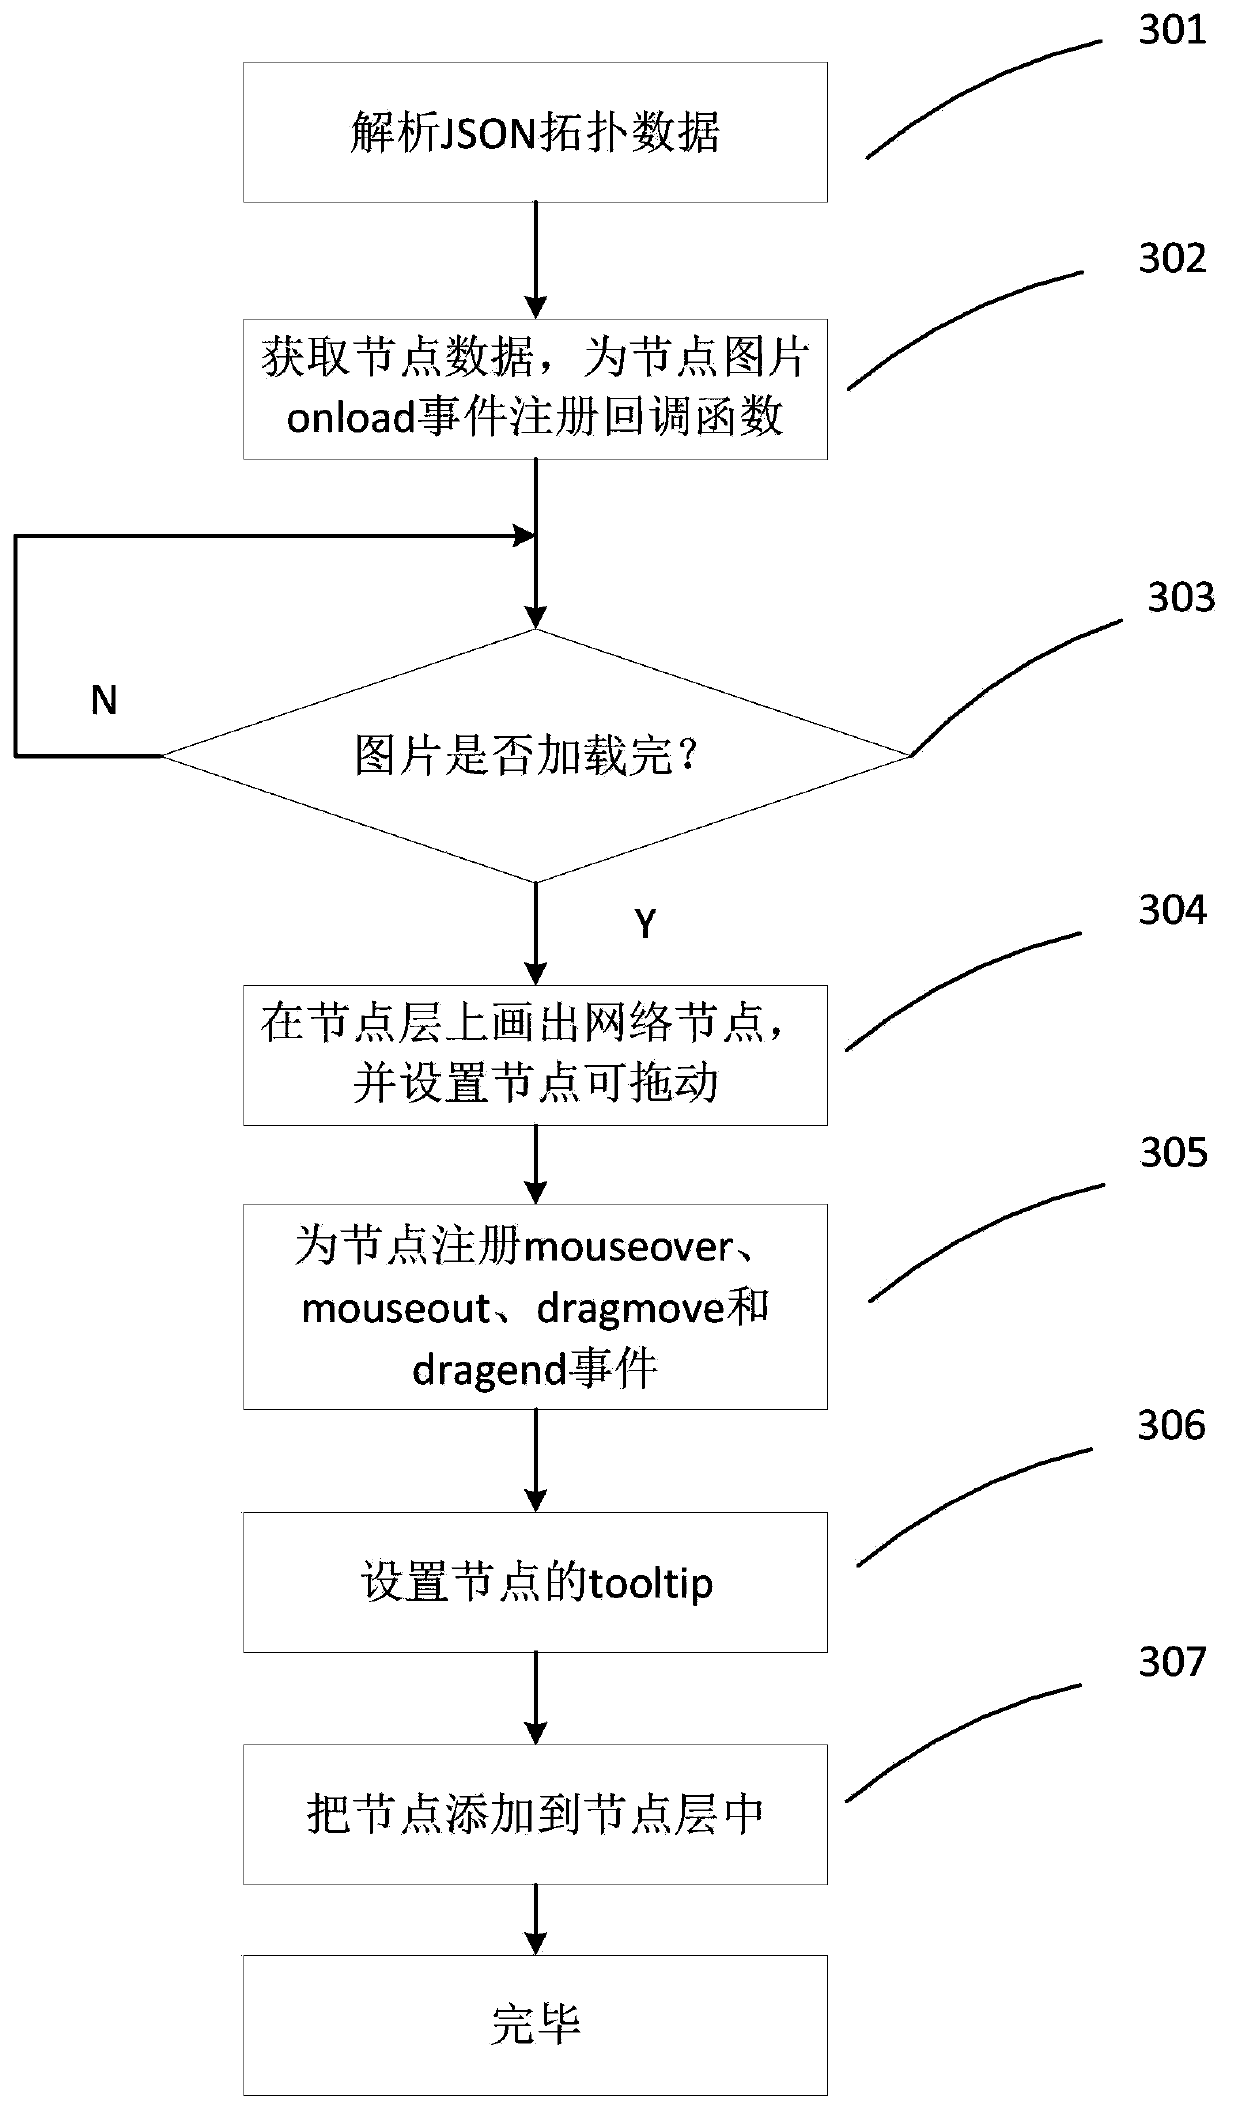
[0082] When rendering at each layer, map the background, links, nodes and text descriptions in the topology data to the graphical elements of the browser, and register interactive events for the graphical elements through JavaScript to realize the interaction with the topology map;

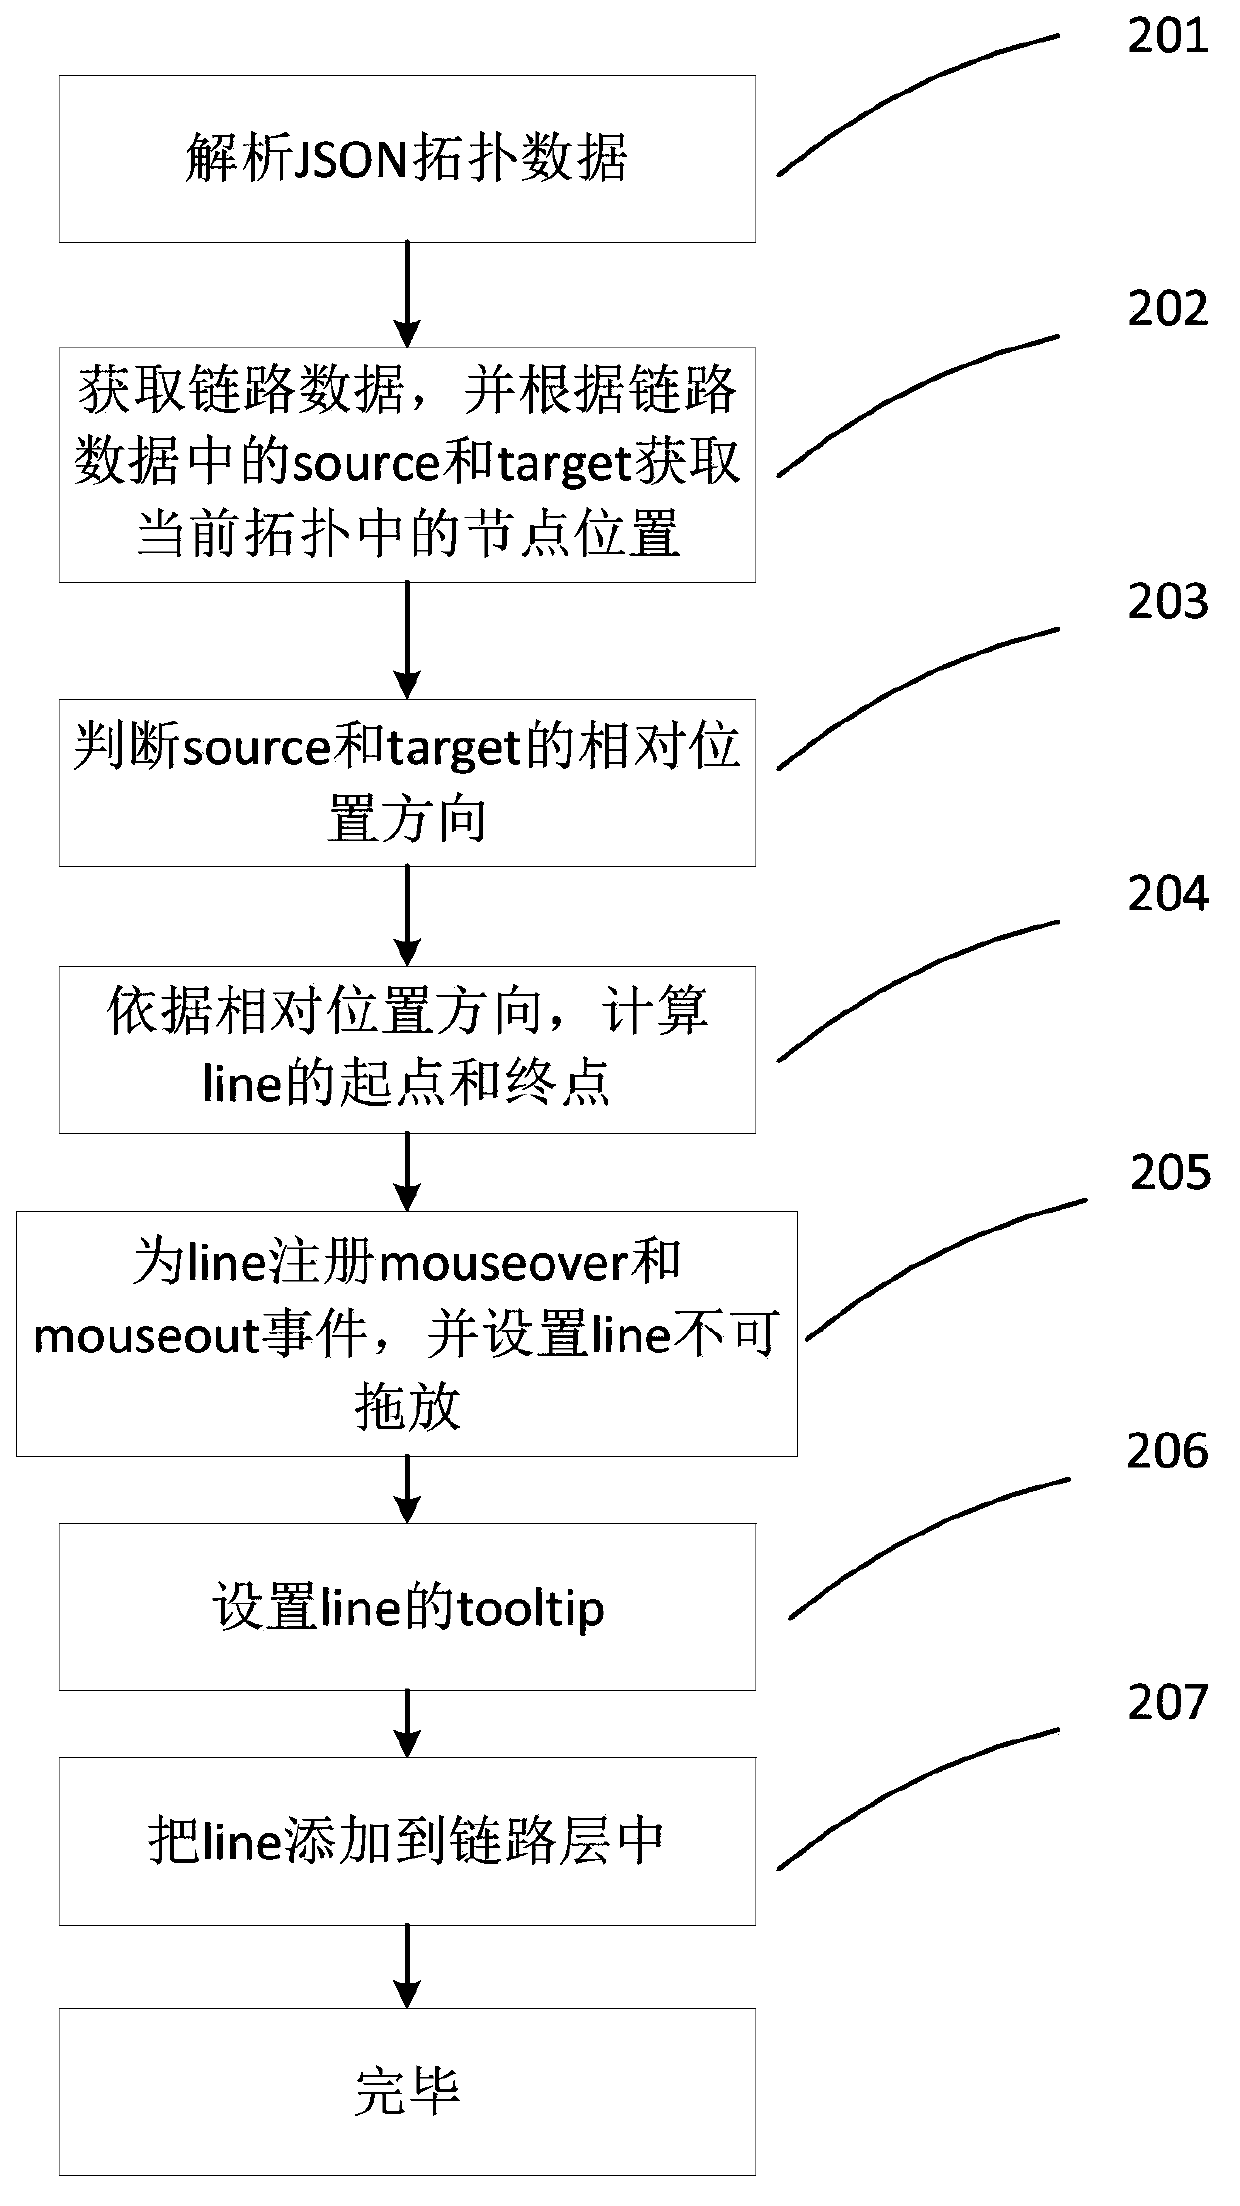
[0083] In the link layer, according to the relative position of the source node and the end node of the link, the position of the start point and the end point of the link is calculated;

[0084] In the dragging layer, when dragging the corresponding node, the dragging eleme...


PUM


Abstract

The invention discloses a layered network topology visualizing method and system. The method comprises that 101) a browser canvas is divided into a background layer, a link layer, a node layer, a drag layer and a text layer, and the corresponding layers are rendered according to the data types; and 102) during graphical element rendering in the different layers, background, link, node and words in topology data are described and represented as graphical elements of a browser, and corresponding interaction events are registered for the graphical elements via a scripting language. Concretely, in the link layer, according to the relative positions of a source node and an end node of a link, the origin and the terminal of the link are calculated, the link is represented as line elements in a page, and a network link is rendered via lining functions of the line elements on the page; and in the drag layer, a node is dragged and dropped to change the relative position of a topology element, and when the corresponding node is dragged, the drag element and other related elements are redrawn in the layer.

Description

technical field [0001] The invention relates to the field of IT technology, in particular to a layered network topology visualization method and system. Background technique [0002] With the development of network technology and the growth of services, it becomes more and more difficult for network management to quickly display network configuration changes, and it becomes more and more complicated to find the root cause of failures. The visualization of the network topology presents the network topology data to the user in an intuitive and graphical way, which is one of the more important functions in the network management system. The visualized network topology clearly displays the complex network to users, and can quickly find network elements and services, and quickly locate fault sources, helping users reduce the burden of operation and maintenance and reduce operation and maintenance costs. [0003] Traditional network visualization technologies present network topo...

Claims


Application Information

Patent Timeline
IPC IPC(8): H04L12/24H04L29/08
Inventor 党寿江刘学李艳霞程钢
Owner INST OF ACOUSTICS CHINESE ACAD OF SCI
Learn More