

A high-precision detection method for orbital frequency-shifted signals with low SNR based on sparse decomposition
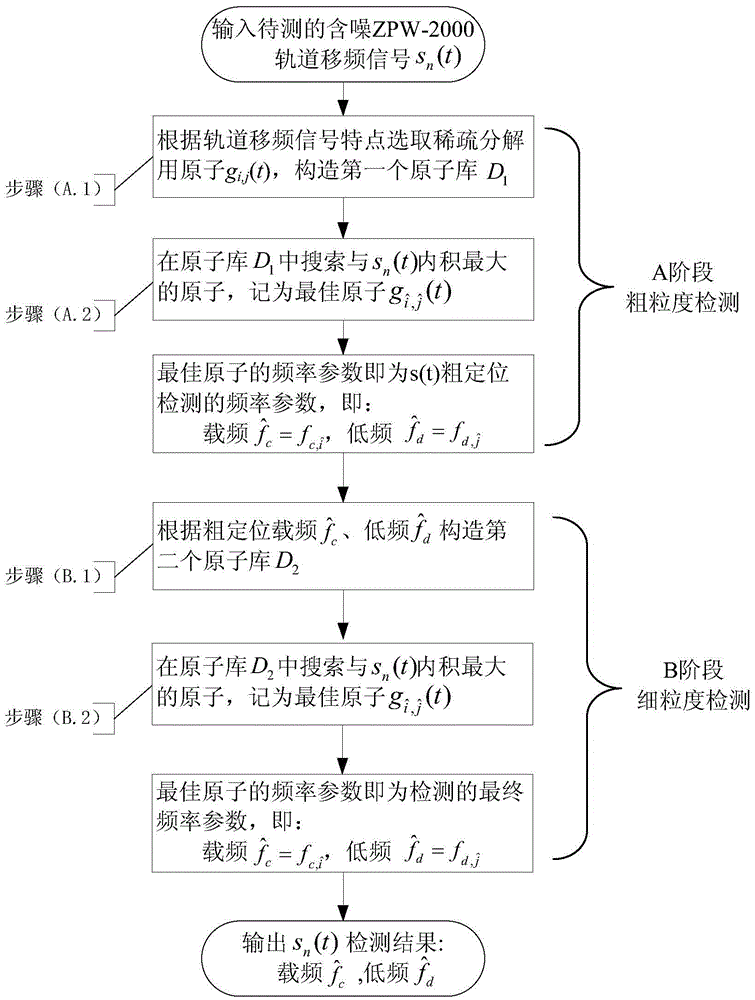
A low signal-to-noise ratio, sparse decomposition technology, applied in frequency measurement devices and other directions, can solve the problems of decoding speed influence, large low-frequency error, and lack of high-precision detection capabilities for low-frequency parameters of carrier frequency.
- Summary
- Abstract
- Description
- Claims
- Application Information
AI Technical Summary
Problems solved by technology
Method used
Image



Examples
Embodiment 1
[0042] In this embodiment, the simulation generates the ZPW-2000 orbit frequency shift signal s(t), the amplitude of s(t) is A=1, and the carrier frequency f c =1701Hz, low frequency f d =10.4Hz, sampling frequency f s =6000, data length N=8192. The local waveform of s(t) is as figure 2 (a) is shown in the sub-picture, 2(b) is the local waveform after s(t) is superimposed with -10dB Gaussian white noise, and the 2(c) is the local waveform after s(t) is superimposed with -10dB Gaussian noise Partial waveform diagram. The color noise in this experiment is obtained by passing white noise with a variance of 1 through a fourth-order band-pass filter. The transfer function of the filter is:
[0043] H ( z ) = 0.0201 * ( 1 - 2 z - 1 + z 4 ) 1 - 1.637 z - 1 + 2.237 z - 2 - 1.3072 z - 3
[0044] Among them, the normalized upper and lower cutoff frequencies of the filter are 0.2Hz a...
Embodiment 2
[0053] The frequency parameters of the ZPW-2000 track frequency shift signal are respectively selected as 8 nominal carrier frequencies and 18 nominal low frequencies, and a total of 8*18=144 track frequency shift signals are generated. Other experimental conditions and operating methods are the same as Experiment 1. Under SNR=-10dB Gaussian colored noise, the carrier frequency and low frequency of these 144 kinds of track frequency shift signals were tested, and satisfactory results were obtained. Table 3 shows part of the detection results of the nominal carrier frequency detection, and Table 4 shows part of the detection results of the nominal low frequency detection.
[0054] Table 3 Nominal carrier frequency detection results under nominal low frequency (Gaussian colored noise SNR=-10dB)
[0055]
[0056] Table 4 Nominal low frequency detection results at nominal carrier frequency (Gaussian colored noise SNR=-10dB)
[0057]
[0058] Table 3 and Table 4 show that under the Gauss...
PUM
 Abstract
Description
Claims
Application Information