A method for real-time display of test process through network diagram

A network diagram and testing technology, applied in the direction of software testing/debugging, etc., can solve the problem of not being able to feedback the test status in real time

Active Publication Date: 2016-09-14
STATE GRID CORP OF CHINA +3
View PDF4 Cites 0 Cited by
  • Summary
  • Abstract
  • Description
  • Claims
  • Application Information

AI Technical Summary

Problems solved by technology

[0004] In order to overcome the problem that the existing automated test methods cannot provide real-time feedback of the test status, the purpose of the present invention is to provide a method for real-time display of the test process through a network diagram. During the test process, the real-time feedback of the test status and results of the background test to the front page can clearly monitor the real-time situation of the current business process test, and can quickly and accurately locate the specific location of the error point in the business process

Method used


Image

  • A method for real-time display of test process through network diagram

Examples


Embodiment Construction

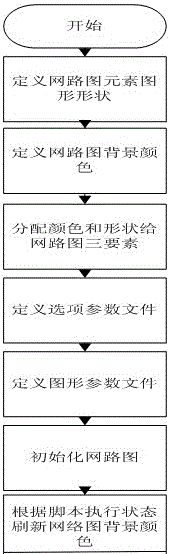
[0017] A method for real-time display of the testing process through a network diagram, see figure 1 , the method includes the following steps:

[0018] 1) Define the shape, including the definition of graphic attributes and formats: that is, define the graphic attributes of the function point frame, test script nodes, and relationship links, including the shape and other attributes of the graphic. Select VC_ARROW_RIGHT (arrow) for both frame and node shape of this method. In the SAP NETCHART network diagram, elements such as text descriptions and graphics in the frame and nodes are called fields. The specific position of each field is determined by the graphic format. By defining the format, the frame or node is divided into fields with multiple rows and columns, and different symbols are used. Indicates different meanings, and the following introduces the meanings of the symbols used in this method.

[0019] $Name: Indicates the definition text description; @Name: Indicate...


PUM


Abstract

The invention discloses a method for real-time display of test procedure by means of a network diagram. The method comprises the steps of sorting all the objects to be tested in an SAP system into multiple test processes, wherein each test process includes functions to be tested and test scripts used for testing the functions; with a single test process as a test object list and by means of the SAPNETCHART network diagram, representing function points in the test processes with a frame, representing the test scripts used for testing the functions with nodes, and connecting all the test scripts with a link according to the test executing sequence to form a test operation flow interface constructed by the network diagram. According to the method, the position of a mistake in the whole procedure can be positioned conveniently and quickly, a user can learn the execution states of all the test scripts before test execution is completed, the test is stopped if execution of a certain node is wrong, and therefore testing time is greatly saved.

Description

technical field [0001] The invention belongs to the field of automatic testing, in particular to a method for real-time display of testing process through a network diagram. [0002] Especially when it involves automated testing of business objects such as business processes and functional modules of each module of SAP, the business process is displayed in a network diagram, and a method of monitoring the test process by monitoring the changes in the graph in real time. Background technique [0003] With the development of automated testing applications in various fields, people's demand for visualization of the testing process has become increasingly urgent. Judging from the analysis results of automated testing methods used by informatization enterprises, automated testing can be carried out according to business processes, but basically the test results are displayed in the form of text output on the workbench, which has the following disadvantages: 1) The testing process...

Claims


Application Information

Patent Timeline
Patent Type & Authority Patents(China)
IPC IPC(8): G06F11/36
Inventor 张水凌杨铭李林
Owner STATE GRID CORP OF CHINA
Why Eureka
Try Eureka