Chart granularity adjusting method and device

A technology to adjust the direction and granularity, which is applied in the input/output process of data processing, instruments, electrical digital data processing, etc., and can solve problems such as low accuracy, poor user experience, and low efficiency

Inactive Publication Date: 2014-08-20
HUAWEI TECH CO LTD
View PDF6 Cites 5 Cited by
  • Summary
  • Abstract
  • Description
  • Claims
  • Application Information

AI Technical Summary

Problems solved by technology

[0005] In order to solve the problems of low efficiency, low accuracy, and poor user experience in adjusting the granular

Method used


Image

  • Chart granularity adjusting method and device
  • Chart granularity adjusting method and device
  • Chart granularity adjusting method and device

Examples


Embodiment 1

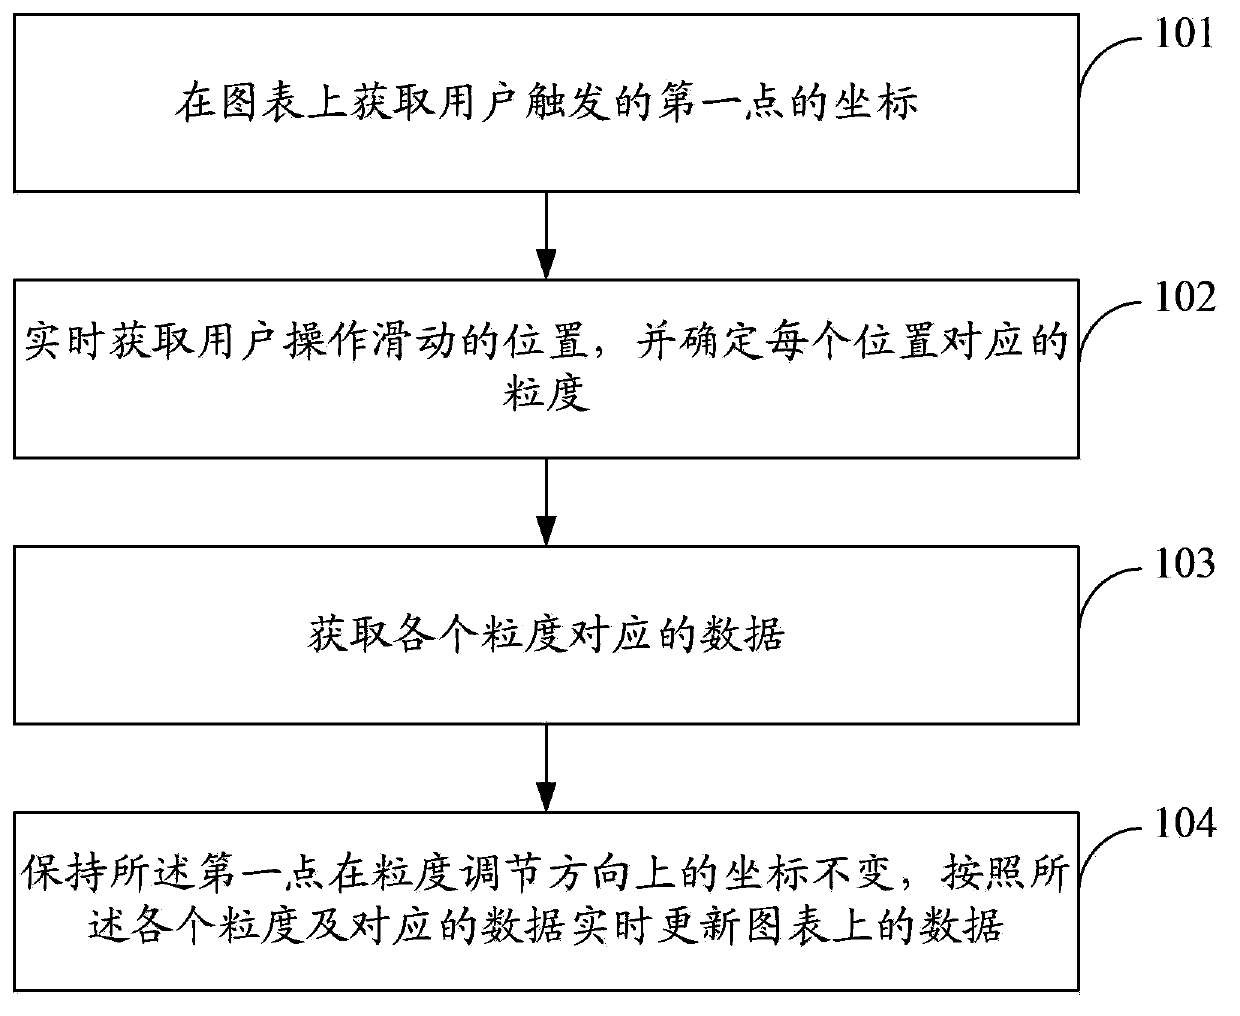
[0088] see figure 1 , this embodiment provides a method for adjusting the granularity of the graph, including:

[0089] 101: Obtain the coordinates of the first point triggered by the user on the chart;

[0090] 102: Obtain the sliding position of the user operation in real time, and determine the granularity corresponding to each position;

[0091] 103: Obtain data corresponding to each granularity;

[0092] 104: Keep the coordinates of the first point in the grain size adjustment direction unchanged, and update the data on the chart in real time according to each grain size and corresponding data.

[0093] In this embodiment, the graph refers to a two-dimensional data graph, which includes a first coordinate axis and a second coordinate axis that are perpendicular to each other, and usually uses two coordinate values ​​to represent data. For example, the first coordinate axis is time and the second coordinate axis is percentage; or the first coordinate axis is distance an...

Embodiment 2

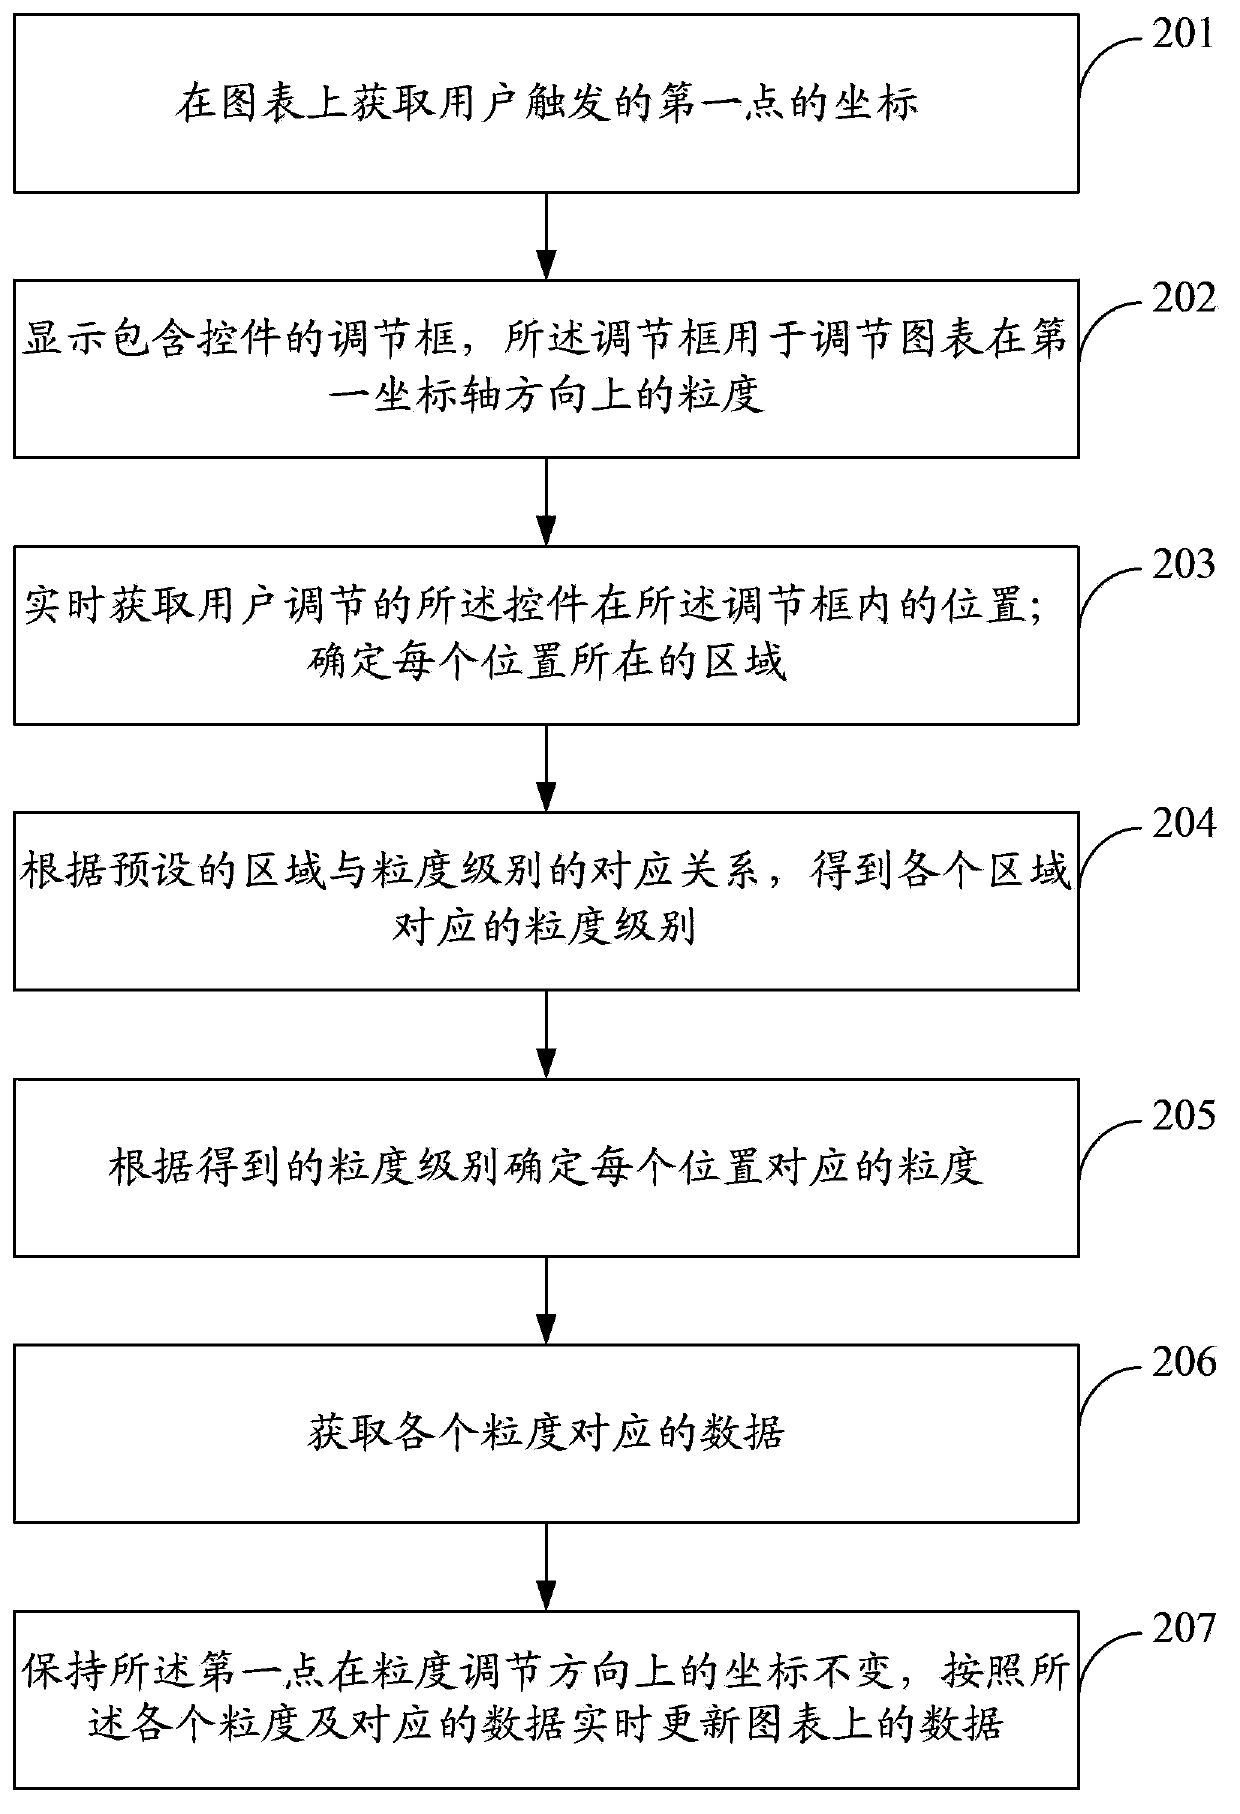
[0129] see figure 2 , this embodiment provides a method for adjusting the granularity of the graph, the method specifically includes:

[0130] 201: Obtain the coordinates of the first point triggered by the user on the chart;

[0131] In this embodiment, the graph refers to a two-dimensional data graph, and includes a first coordinate axis and a second coordinate axis that are perpendicular to each other; usually two coordinate values ​​are used to represent data.

[0132] For example, the first coordinate axis is time and the second coordinate axis is percentage; or the first coordinate axis is distance and the second coordinate axis is the number of users, and so on. Wherein, one of the first coordinate axis and the second coordinate axis is a horizontal direction, and the other is a vertical direction, which is not specifically limited in the present invention.

[0133] 202: Display an adjustment box containing controls, the adjustment box is used to adjust the granulari...

Embodiment 3

[0158] see Figure 6 , this embodiment provides a method for adjusting the granularity of the graph, the method specifically includes:

[0159] 601: Obtain the coordinates of the first point triggered by the user on the chart;

[0160] In this embodiment, the graph refers to a two-dimensional data graph, and includes a first coordinate axis and a second coordinate axis that are perpendicular to each other, usually two coordinates are used to represent data.

[0161] For example, the first coordinate axis is time and the second coordinate axis is percentage; or the first coordinate axis is distance and the second coordinate axis is the number of users, and so on. Wherein, one of the first coordinate axis and the second coordinate axis is a horizontal direction, and the other is a vertical direction, which is not specifically limited in the present invention.

[0162] In this embodiment, if the user uses a finger to trigger the screen, the contact point of the finger on the sc...


PUM


Abstract

The invention discloses a chart granularity adjusting method and device, and belongs to the field of data mining. The chart granularity adjusting method includes the steps of obtaining a coordinate of a first point triggered by a user on a chart, obtaining the positions slide and operated by the user in real time, determining granularities corresponding to the positions, obtaining data corresponding to the granularities, keeping the coordinate of the first point in the granularity adjusting direction to be unchanged, and updating data on the chart in real time according to the granularities and the corresponding data. The chart granularity adjusting device comprises a first triggering module, a first obtaining module and a first adjusting module. By means of the chart granularity adjusting method and device, real-tine adjustment and accurate adjustment on the chart granularities are achieved, the granularity adjusting efficiency and the granularity adjusting accuracy are improved, and user operation is simplified.

Description

technical field [0001] The invention relates to the field of data mining, in particular to a method and device for adjusting the granularity of graphs. Background technique [0002] When performing statistics, it is common to use charts to display the data. For example, in the network management system, the performance data is obtained every 5 minutes, and then a chart is constructed with time as the horizontal axis and performance data as the vertical axis, which can clearly reflect the change of performance data over time. However, due to the influence of factors such as data transmission and system refresh, the time granularity of the charts seen by operation and maintenance personnel is relatively coarse, such as hourly granularity, so it is not convenient for data statistics and analysis. In order to analyze data more accurately, it is often necessary to adjust the granularity of the chart to dig deeper into the data. [0003] At present, a common solution is to confi...

Claims


Application Information

Patent Timeline
IPC IPC(8): G06F3/0485
Inventor 梁冰谭严芳魏炜
Owner HUAWEI TECH CO LTD
Why Eureka
Try Eureka