Visualization display system of intelligent power network, and method thereof

A technology of smart grid and display system, applied in the field of smart grid, can solve the problems of ineffective integration of R&D resources, unified technical route, uneven quality, etc., and achieve the effect of various display methods and wide application.

Inactive Publication Date: 2014-08-27
陈国祥
View PDF0 Cites 53 Cited by
  • Summary
  • Abstract
  • Description
  • Claims
  • Application Information

AI Technical Summary

Problems solved by technology

[0003] At present, existing technical solutions usually only consider specific business scenarios, with different technical routes and uneven quality. It is difficult to r

Method used


Image

  • Visualization display system of intelligent power network, and method thereof
  • Visualization display system of intelligent power network, and method thereof
  • Visualization display system of intelligent power network, and method thereof

Examples


Embodiment Construction

[0038] In order to make the technical means, creative features, goals and effects achieved by the present invention easy to understand, the present invention will be further described below in conjunction with specific illustrations.

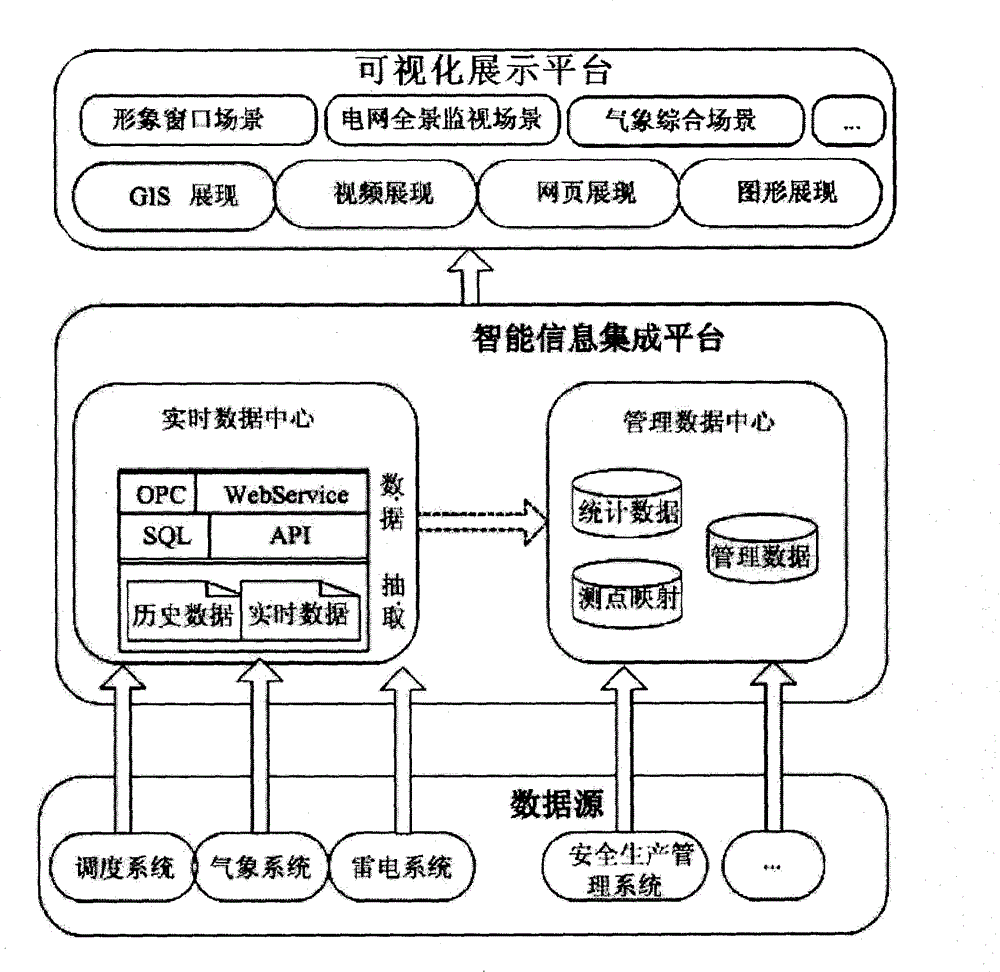
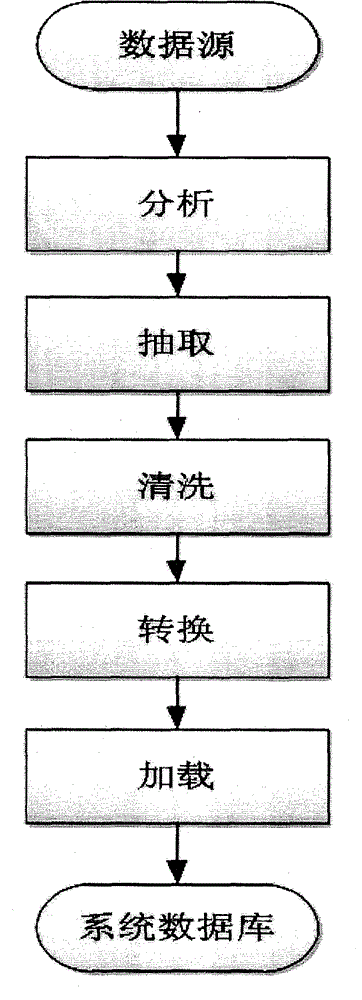
[0039] figure 1 Shown is a structural frame diagram of the visualized display system of the smart grid of the present invention, and the comprehensive display visualized system is composed of a data intelligence information integration platform and a visualized display platform. The data intelligent information integration platform realizes data analysis and data integration between multiple professional systems through ETL technology, and provides basic data sources for the visual display platform; data sources include dispatching system data, meteorological system data, lightning system data, safety production management System data, etc.; the data of the data intelligent information integration platform includes the real-time data center and ...


PUM


Abstract

The invention relates to a visualization display system of an intelligent power network. The visualization display system comprises a data intelligent information integration platform and a visualization display platform. The data intelligent information integration platform comprises an analysis module, a draw-off module, a cleaning module, a conversion module and a loading module. The visualization display platform comprises a GIS module, a graphic chart module and a video monitoring module. The advantages are as follows: a power network information visualization aspect with richer, more visual and more vivid display requirements is provided for users, and the system can carry out display in an omni-directional, stereoscopic, multi-angle and multilayer mode and satisfies various demands for visualization application of power network services; and the application is wide, the display modes are diversified, multiple presenting modes such as a video, a GIS thematic graph, a graphic chart and the like are supported, and the system and method are suitable for different demand scenes.

Description

technical field [0001] The invention relates to the technical field of smart grids, in particular to a visual display system and method for smart grids. Background technique [0002] With the continuous advancement of the informatization process of the power industry, users have put forward higher and more specific requirements in terms of information visualization. From the primary requirement of simply displaying information in the past, it has gradually changed to the advanced requirement of displaying information in richer, more intuitive and vivid means, such as graphics-based business process processing, animation effects, 3D images, etc. [0003] At present, existing technical solutions usually only consider specific business scenarios, with different technical routes and uneven quality. It is difficult to reuse between different application systems, and cannot effectively integrate R&D resources, unify technical routes, improve product reuse, Standardize application...

Claims


Application Information

Patent Timeline
IPC IPC(8): G06Q10/06G06Q50/06
Inventor 陈国祥
Owner 陈国祥
Why Eureka
Try Eureka