Webpage thermodynamic diagram generating method and device

A heat map and webpage technology, applied in the field of data processing, can solve the problems of small color contrast and the inability to directly observe the difference in clicks in different areas, so as to achieve the effect of increasing contrast and enhancing visual experience

Active Publication Date: 2014-12-10
BEIJING GRIDSUM TECH CO LTD
View PDF4 Cites 18 Cited by
  • Summary
  • Abstract
  • Description
  • Claims
  • Application Information

AI Technical Summary

Problems solved by technology

[0006] The present invention is proposed to solve the problem that the color contrast of different areas in the existing web page heat map is small, which leads to the inability to directly observe the difference between the hits in different areas

Method used


Image

  • Webpage thermodynamic diagram generating method and device
  • Webpage thermodynamic diagram generating method and device
  • Webpage thermodynamic diagram generating method and device

Examples


Embodiment Construction

[0027] It should be noted that, in the case of no conflict, the embodiments in the present application and the features in the embodiments can be combined with each other. The present invention will be described in detail below with reference to the accompanying drawings and examples.

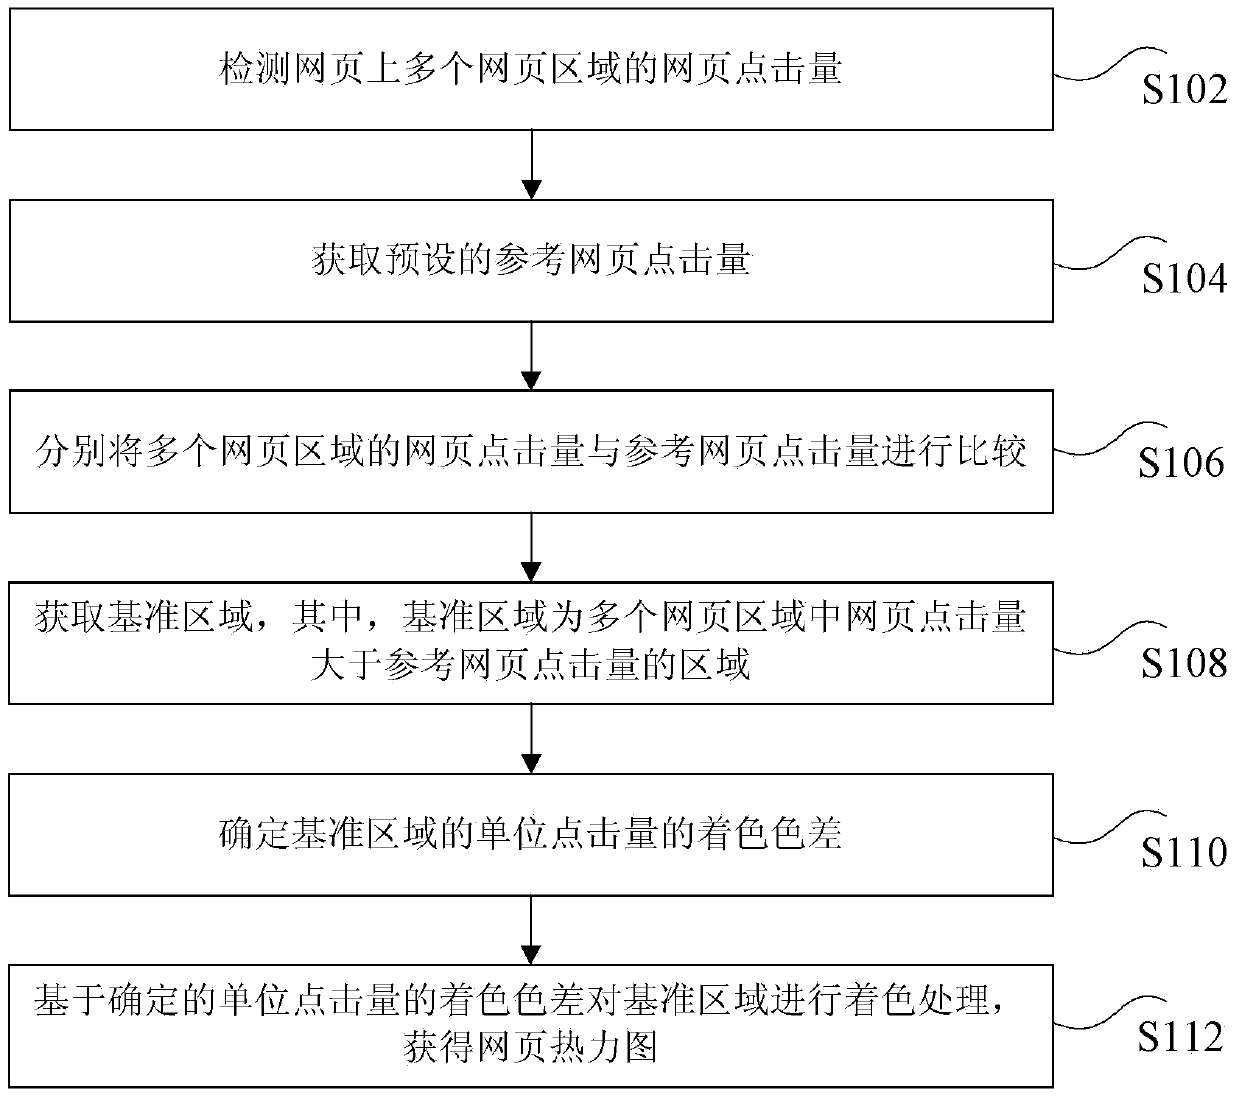
[0028] figure 1 is a flow chart of the first embodiment of the method for generating a web page heat map according to the present invention. Such as figure 1 As shown, the method includes the following steps:

[0029] Step S102 , detecting page hits of multiple web page areas on the web page.

[0030] When the user browses the webpage, he will further click on the interesting content on the webpage. Depending on the individual interests of different users, the number of clicks to different areas of the webpage may vary. On a web page, the number of hits can vary by several orders of magnitude in different areas. For example, for area A on the web page, because there are many interested us...


PUM


Abstract

The invention discloses a webpage thermodynamic diagram generating method and device. The webpage thermodynamic diagram generating method includes the steps that webpage click rates of a plurality of webpage areas on a webpage are detected; a preset reference webpage click rate is obtained; the webpage click rates of the webpage areas are respectively compared with the reference webpage click rate; datum areas are obtained, wherein the datum areas are the areas with the webpage click rates larger than the reference webpage click rate; coloring chromatic aberration of the click rate per unit in the datum areas is determined; based on the determined coloring chromatic aberration of the click rate per unit, the datum areas are colored to obtain a webpage thermodynamic diagram. Through the webpage thermodynamic diagram generating method and device, the color contrast ratio between the webpage areas with the different click rates in the webpage thermodynamic diagram is increased, and the effect of enhancing the vision experience degree of a user is achieved.

Description

technical field [0001] The present invention relates to the field of data processing, in particular to a method and device for generating a heat map of a web page. Background technique [0002] With the rise of the Internet, the number of netizens has increased rapidly, and the time spent by netizens on the Internet has become longer and longer, and the value of websites has become more and more prominent. At the same time, by analyzing the user's visit behavior on the website, it can help the website owner optimize the website design or change the website content, so as to maximize the value of the website, so the user's visit behavior on the website is also more and more concerned by the website owner . [0003] Among the existing methods for visualizing user behavior on websites, heat maps are a more intuitive method. The current heat map display method is to directly convert and display the user's quantifiable access behavior in different color shades, and this color c...

Claims


Application Information

Patent Timeline
Patent Type & Authority Applications(China)
IPC IPC(8): G06F17/30
CPCG06F11/3438G06F16/95
Inventor 钦滨杰陈俊宏
Owner BEIJING GRIDSUM TECH CO LTD
Why Eureka
Try Eureka