User exploration type information exhibiting method based on visualization technology

A user-technical technology, applied in the field of information processing, can solve problems such as not paying attention to the display of statistical information, and achieve the effect of efficient decision-making

Inactive Publication Date: 2015-01-14
TIANJIN UNIV
View PDF4 Cites 5 Cited by
  • Summary
  • Abstract
  • Description
  • Claims
  • Application Information

AI Technical Summary

Problems solved by technology

However, researchers in the field have paid little attention to the presentation of statistical information

Method used


Image

  • User exploration type information exhibiting method based on visualization technology
  • User exploration type information exhibiting method based on visualization technology
  • User exploration type information exhibiting method based on visualization technology

Examples


Embodiment Construction

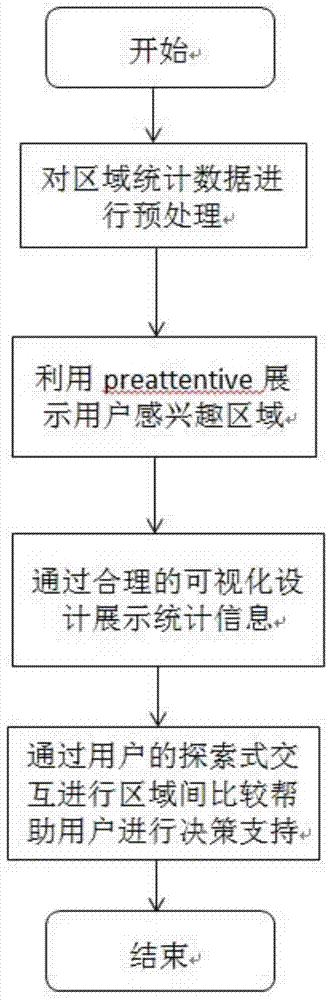
[0021] Taking Hong Kong as an example, this visualization method is used to display various data of Kowloon, Hong Kong. The land has a permanent population of more than 2 million and consists of five urban divisions and 120 constituency subdistricts. The flow of the user exploratory information display method based on visualization technology is as follows: figure 1 As shown, the process includes the following steps:

[0022] 1) Preprocessing the collected regional data: regional data includes GIS data and statistical data. GIS data includes geographical area boundaries, road information, house information, etc. Statistical data includes demographic data, economic data, and educational data, among others. In the preprocessing stage, the two kinds of data are matched, so that statistical data information can be intuitively displayed on the map.

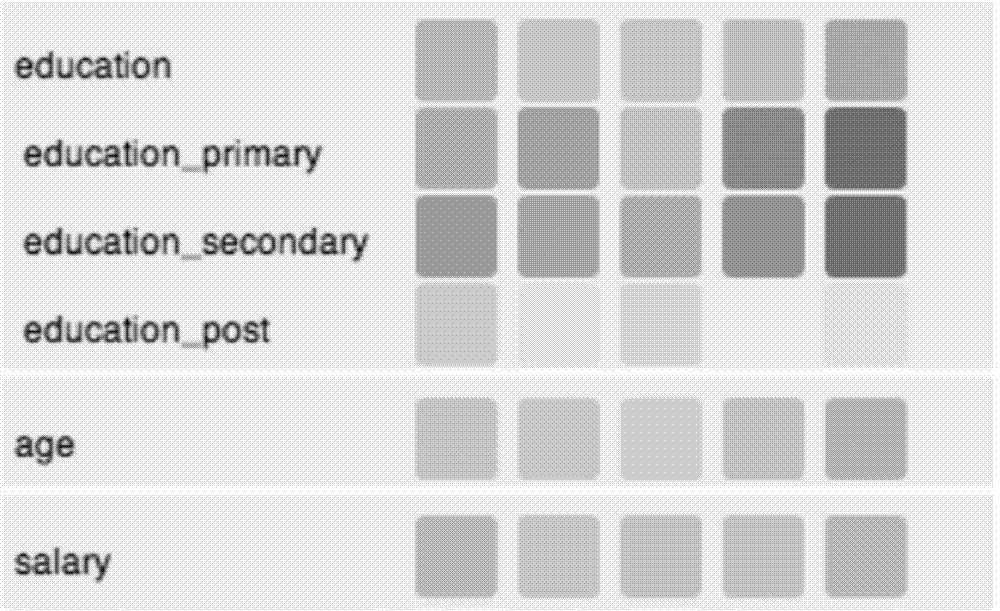
[0023] 2) Utilize the principle of pre-attentive processing (English: pre-attentive processing), allowing users to intuitively se...


PUM


Abstract

The invention discloses a user exploration type information exhibiting method based on a visualization technology. The user exploration type information exhibiting method comprises the following steps: 1, preprocessing collected data backstage and then visually displaying the processed data on a map interface, wherein the collected data comprises GIS (Geographic Information System) data and statistical data, and the statistical data comprises different dimensions of information related to the GIS data; 2, establishing a color lump view by a plurality of display areas according to the statistical data, and representing the different dimensions of information of the statistical data by using color and transparency of a color lump; 3, providing selection of an area-of-interest area for a user. The user exploration type information exhibiting method can be used for presenting various statistical data more intuitively and conveniently, and provides convenience for the user to observe the relationship among various areas and the comparison condition; in addition, prior domain knowledge of the user can be added to a whole model in the inquiry process, so that the knowledge of the user and machine intelligence are combined, the advantages are exerted, and the information exhibiting method is helpful for the user to make a decision more efficiently.

Description

technical field [0001] The invention relates to information processing technology, in particular to a method and application for displaying information under a geographic information system using visualization technology. Background technique [0002] In recent years, geographic information system has developed rapidly, and various decision support related to it, such as location selection and travel issues, have attracted more and more attention. The use of statistical information on GIS will play a vital role in people's decision support. [0003] Visual analysis is a new technology developed in recent years. It is the product of the development of information visualization and scientific visualization. It focuses on analytical reasoning with the help of interactive user interface. Information visualization technology is based on the modern information processing platform, according to the needs of users for information, using appropriate visual symbols to represent vario...

Claims


Application Information

Patent Timeline
Patent Type & Authority Applications(China)
IPC IPC(8): G06F17/30
CPCG06F16/29
Inventor 张加万蒋心仪陈辉康凯
Owner TIANJIN UNIV
Why Eureka
Try Eureka