K-line analysis method of earthquake trend
An analysis method, K-line technology, applied in the field of K-line analysis of earthquake trends, can solve the problems of low short-term forecast accuracy and rough forecast, and achieve the effects of complete computer programming, intuitive results, and fast analysis speed
- Summary
- Abstract
- Description
- Claims
- Application Information
AI Technical Summary
Problems solved by technology
Method used
Image
Examples
Embodiment Construction
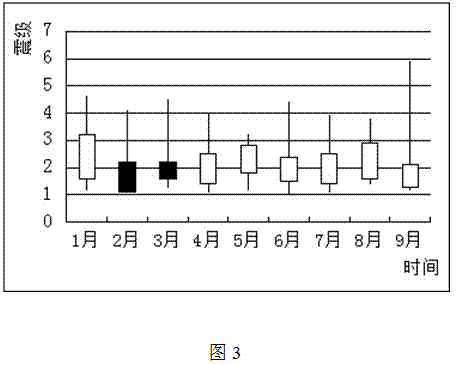
[0014] The K-line analysis method of earthquake trend includes: the definition method of seismic K-line, the establishment method of analysis model, the drawing method of graph, and the analysis method of graph.
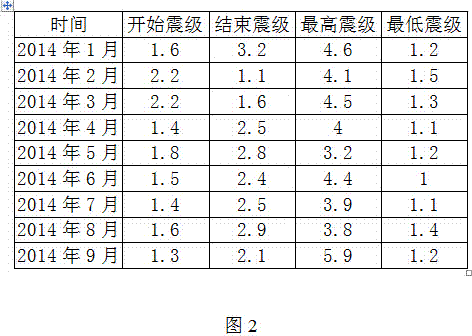
[0015] The K-line analysis method of the earthquake trend defines the K-line drawn by the start magnitude, end magnitude, lowest magnitude and highest magnitude within a unit time period as the earthquake K-line.
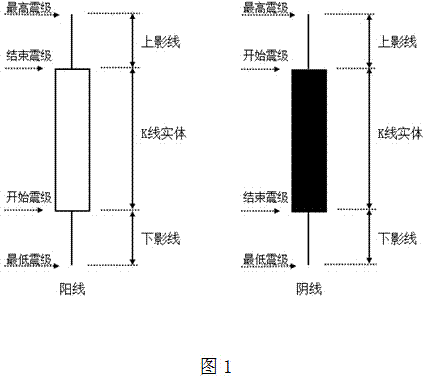
[0016] The method of drawing a single earthquake K line is as follows: define the magnitude of the first earthquake that occurs within a unit time period as the start magnitude, and the magnitude of the last earthquake as the end magnitude. First connect the highest magnitude and the lowest magnitude into a vertical line, and then connect the start magnitude and the end magnitude into a rectangular cylinder. The height of the cylinder is the absolute value of the difference between the start magnitude and the end magnitude, and the central axis of the c...
PUM
 Abstract
Description
Claims
Application Information
 - R&D
- Intellectual Property
- Life Sciences
- Materials
- Tech Scout
- Unparalleled Data Quality
- Higher Quality Content
- 60% Fewer Hallucinations
Browse by: Latest US Patents, China's latest patents, Technical Efficacy Thesaurus, Application Domain, Technology Topic, Popular Technical Reports.
© 2025 PatSnap. All rights reserved.Legal|Privacy policy|Modern Slavery Act Transparency Statement|Sitemap|About US| Contact US: help@patsnap.com


