Visualization method of time sequence relationship evolution of time sequence data

A technology of time series relationship and time series data, applied in visual data mining, digital data processing, structured data retrieval, etc., can solve the problems of limited display and exploration perspective, evolution of cognitive burden, and inability to provide visual models.

Active Publication Date: 2015-08-26
SICHUAN UNIV
View PDF1 Cites 14 Cited by
  • Summary
  • Abstract
  • Description
  • Claims
  • Application Information

AI Technical Summary

Problems solved by technology

The disadvantage of these methods is that any method provides limited display and exploration perspectives, which imposes a huge cognitive burden on users to comprehensively analyze and understand the evolution of temporal relationships.
In addition, there are few works focusing on temporal relationship evolution, but most of these works focus on

Method used


Image

  • Visualization method of time sequence relationship evolution of time sequence data
  • Visualization method of time sequence relationship evolution of time sequence data
  • Visualization method of time sequence relationship evolution of time sequence data

Examples


Embodiment Construction

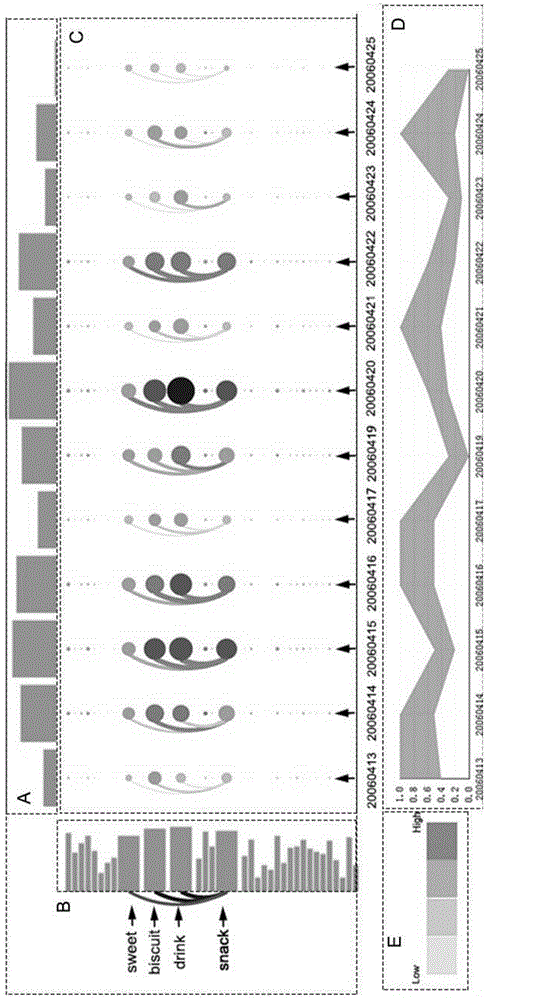
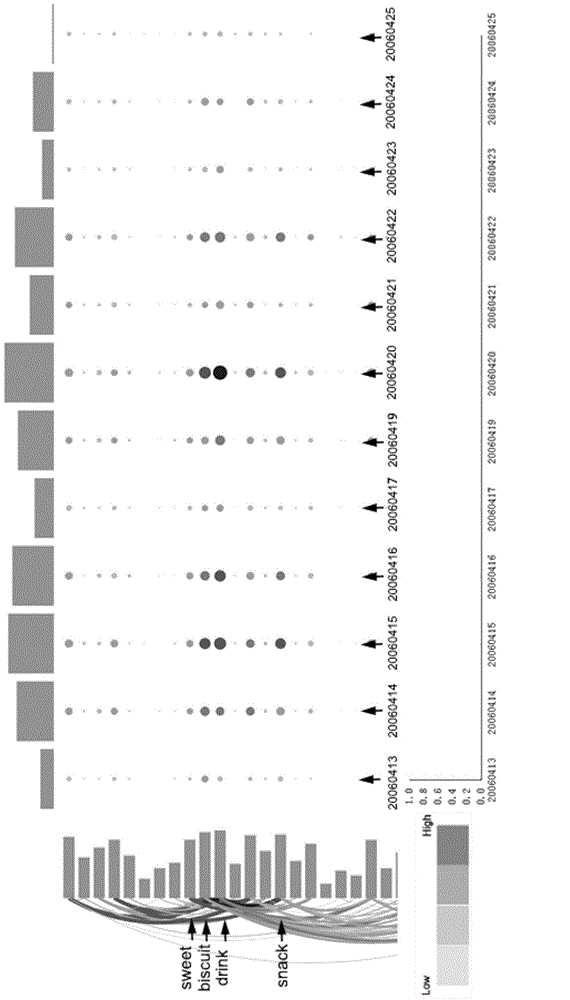
[0055] Below in conjunction with specific embodiment, the present invention will be further described: the system prototype Revoler interface of the visual view realized by the present invention is as follows figure 1 Shown:

[0056] (1) Time overview view, figure 1 (A): From left to right, it can be arranged in order of time from large to small or from small to large. The height of the rectangle corresponding to each time point corresponds to the total amount of related entities at this time point. The larger the total amount, the higher the rectangle .

[0057] entity overview view, figure 1 (B): It is used to represent the total distribution of entities in the data set. Each rectangle corresponds to each entity. The width of the rectangle represents the total amount of the corresponding entity. The larger the total amount, the wider the rectangle.

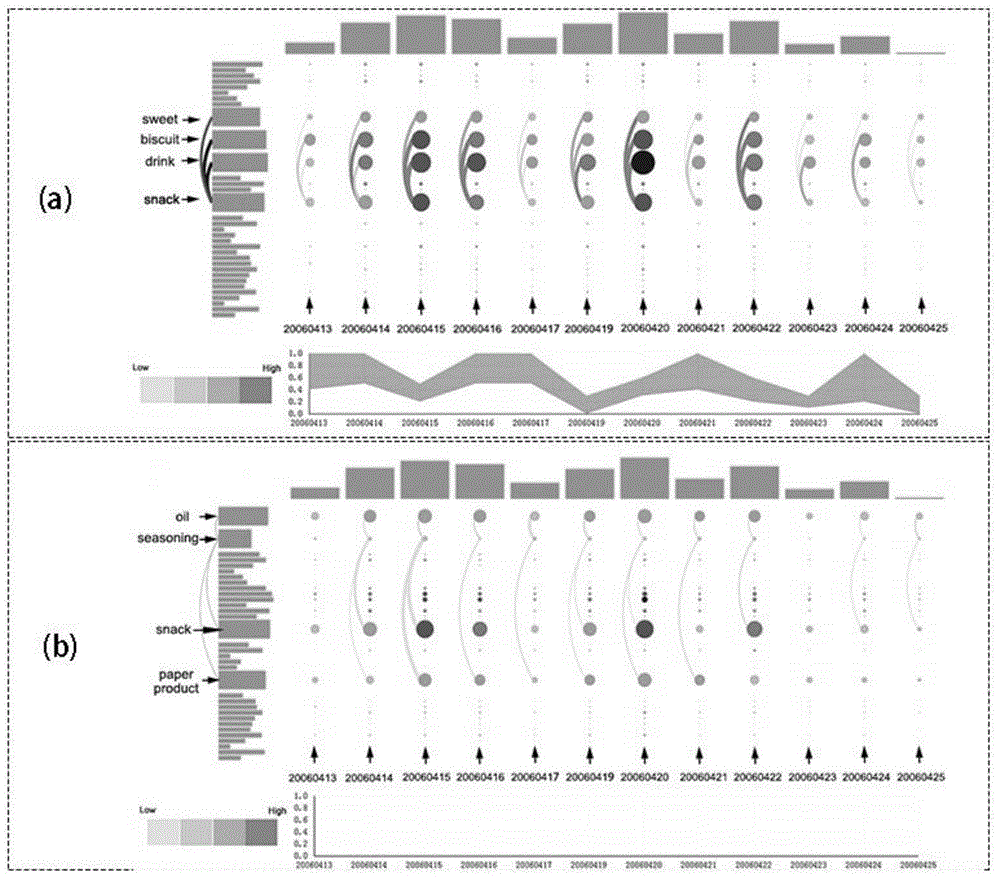
[0058] overall relationship evolution view, figure 1 (C): It is used to display the evolution of the overall relationship,...


PUM


Abstract

The invention discloses a visualization method of time sequence relationship evolution of time sequence data. According to the method, the heights of time rectangles in transverse arrangement are used for mapping the total quantity of entities in the corresponding time point; the widths of entity rectangles in longitudinal arrangement are used for mapping the total quantity of the entities; the radii and the color intensities of entity circles are used for mapping the number of corresponding entities on the corresponding time point; the widths and the color intensities of detail arc lines are used for mapping the intensity of the time sequence relationship between the two corresponding entities; the multi-view-angle analysis and interactive exploration on the time sequence relationship evolution are realized; and the time sequence relationship evolution condition between time sequence data is more visually and clearly shown. The method has higher universality, and is applicable to wider application backgrounds and application demands.

Description

technical field [0001] The invention relates to the technical field of time series relationship analysis of data, in particular to a visualization method for the evolution of time series relationship of time series data. Background technique [0002] Time-series data widely exists in scientific research and people's daily life, and it often contains a certain connection between different entities and time, that is, a sequential relationship. For example, the commodity purchase data includes the common purchase relationship between different commodities; the paper publication record includes the cooperation relationship between different institutions; the bank fund flow record includes the loan relationship between different accounts. At the same time, according to the relationship category, the temporal relationship can be divided into a single-category relationship and a multi-category relationship. If the temporal relationship between different entities is of the same cat...

Claims


Application Information

Patent Timeline
IPC IPC(8): G06F17/30
CPCG06F16/26
Inventor 朱敏贺庆来谢昭阳曾昂
Owner SICHUAN UNIV
Why Eureka
Try Eureka