Network topology visualization method with respect to geographical location information

A technology of geographic location information and network topology, which is applied in the field of network topology visualization of geographic location information, can solve the problem of high time complexity, and achieve the effect of clear layout range and real layout effect

Active Publication Date: 2015-11-25
UNIV OF ELECTRONICS SCI & TECH OF CHINA
View PDF5 Cites 16 Cited by
  • Summary
  • Abstract
  • Description
  • Claims
  • Application Information

AI Technical Summary

Problems solved by technology

When the force-guided layout algorithm calculates the internal force between nodes, it does not follow Hu Ke's law, but establishes a set of repulsion-gra...

Method used


Image

  • Network topology visualization method with respect to geographical location information
  • Network topology visualization method with respect to geographical location information
  • Network topology visualization method with respect to geographical location information

Examples


Embodiment Construction

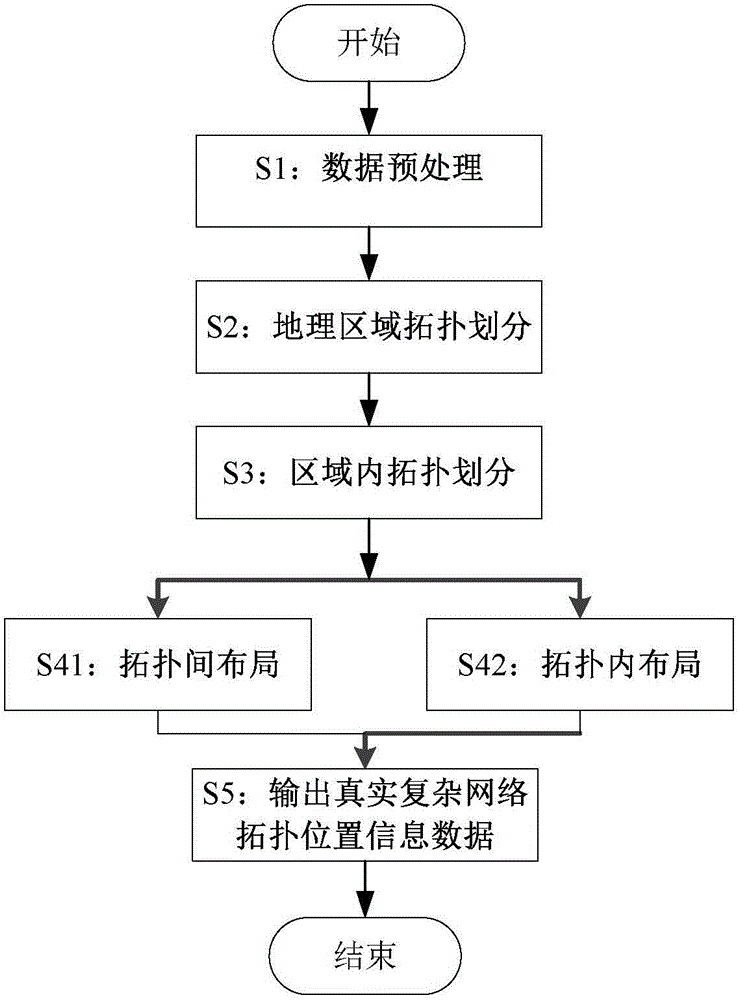
[0037] The present invention provides a network topology visualization method for geographic location information, which mainly involves preprocessing S1 of input data, dividing S2 geographical areas of network topology data, performing topology division S3 within geographical areas, topological layout S4, Output real complex network topology position information data S5, the present invention will be further described in detail below in conjunction with the accompanying drawings and specific implementation methods.

[0038] The flow chart of the network topology visualization method for geographic location information according to the present invention is as follows figure 1 As shown, it specifically includes the following steps:

[0039] S1: Preprocessing the input data

[0040] Analyze the text data of the real complex network topology, complete the data loading, and convert the points and edges in the text data into the data structure required by the later algorithm.

[...


PUM


Abstract

The present invention provides a network topology visualization method with respect to geographical location information, comprising: S1: performing pre-process of input data; S2: performing geographic area partitioning of the network topology data; S3: performing topology partitioning; S4: performing topology layout; and S5: performing output of real and complex network topology location information data and realizing visualization. According to the invention, the aesthetic property is not be changed in the case of increasing the geographical location information of the nodes, the location ranges of important nodes are more clear through the improved round layout algorithm, and the round layout may be not influenced by the connection relation of the nodes at the boundary and the nodes at the boundary in other topologies so that the layout effect is more true.

Description

technical field [0001] The invention belongs to the field of network topology visualization, and in particular relates to a network topology visualization method related to geographic location information. Background technique [0002] With the increasing scale of modern networks and the increasing complexity of network structures, it is no longer the most effective way to analyze and describe networks in the traditional text form. Using visualization methods and related technical means, the text description of the network is converted into graphics, so that the network structure can be quickly and clearly presented to the user, and it is convenient to provide more effective reference for the control, management and optimization of the network. The technology that embodies the network is what we call network visualization. [0003] Network visualization is to convert abstract data into intuitive images, so the layout of network nodes and the connections between them are the...

Claims


Application Information

Patent Timeline
IPC IPC(8): H04W4/02H04W64/00H04W16/18
CPCH04W4/02H04W16/18H04W64/00
Inventor 费高雷李健霖胡光岷
Owner UNIV OF ELECTRONICS SCI & TECH OF CHINA
Why Eureka
Try Eureka