Method for calculating the index parameter of grid investment analysis model
A technology of analysis model and calculation method, applied in the field of power grid project investment analysis, which can solve the problems of different structures, uneven quality and inability to guarantee the reliability of evaluation results.
- Summary
- Abstract
- Description
- Claims
- Application Information
AI Technical Summary
Problems solved by technology
Method used
Image
Examples
Embodiment 1
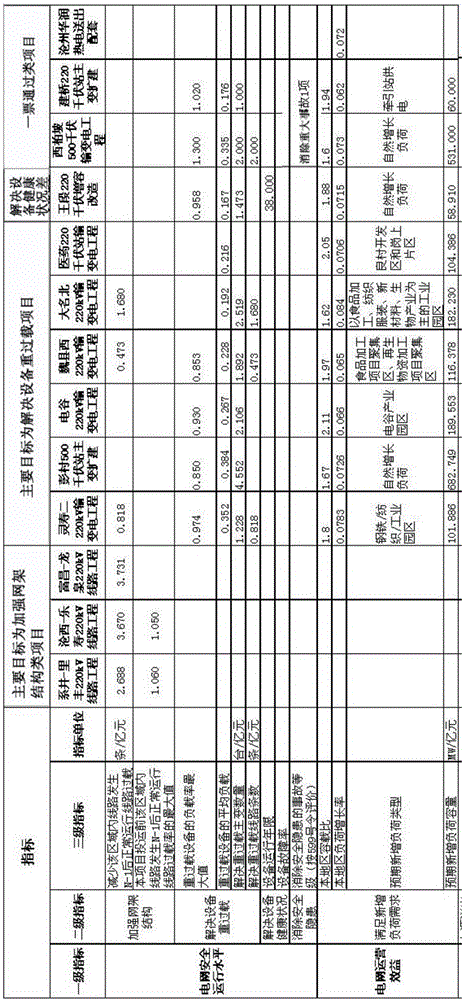
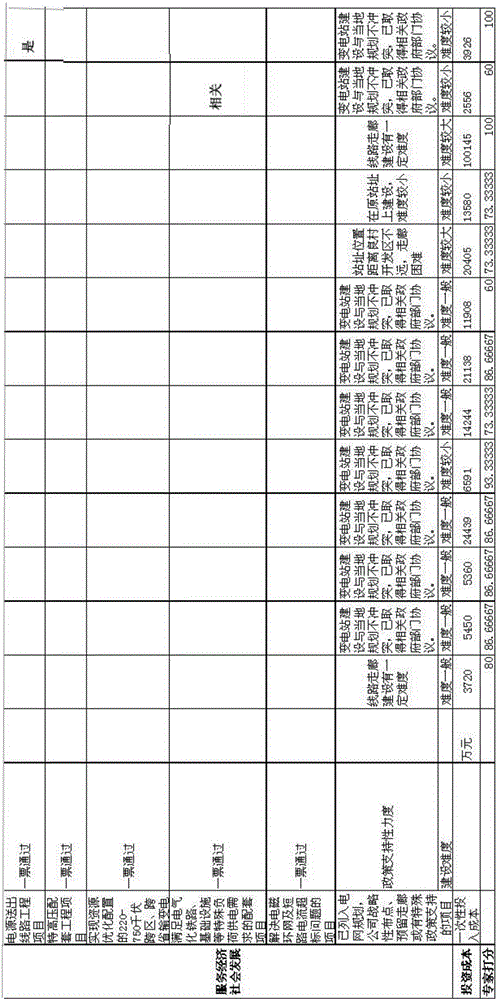
[0143] Example 1, 13 investment projects with a voltage level of 220-1000 kV are used as the basis for model training for calculation:
[0144] 2.1.1 Index quantification and normalization
[0145] Index quantification: Data statistics come from multiple work departments, resulting in inconsistent data units and forms; the representation method and measurement unit of the same parameter in multiple samples (that is, investment projects) may be inconsistent, so each parameter is first calculated according to the regulations. Convert the format to make it consistent; for example, the "load growth rate" indicator may be expressed as 5%, 0.05, 5, which needs to be converted to the specified format.
[0146] Normalization: The representation of the same parameter in multiple samples may be diverse and not comparable. For example, the representation of a parameter in multiple samples may be expressed by quantity, and some by ratio, which is not comparable ; For some indicators, in ...
Embodiment 2
[0237] In the second embodiment, 29 investment projects with a voltage level of 35-110 kV are used as the basis of model training for calculation.
[0238] The average score of the expert ratings of the 29 selected items is shown in Table 7
[0239]
[0240]
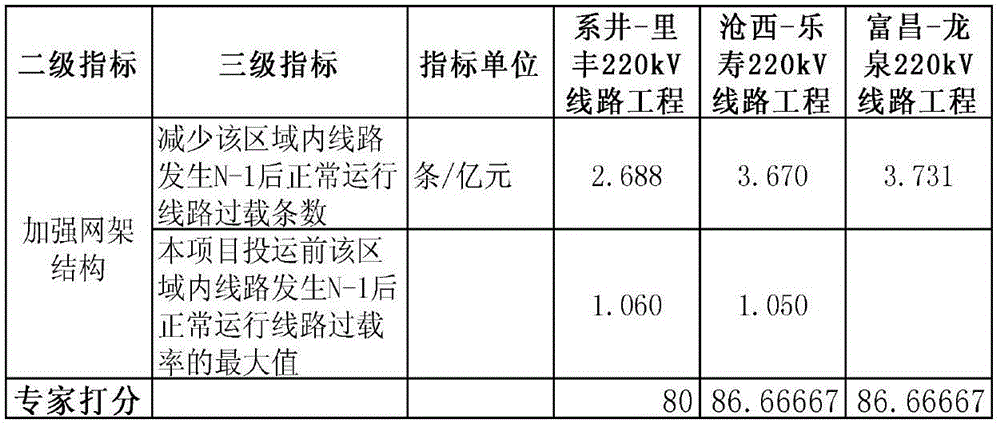
[0241] 3.1 First, 29 sample parameters are quantified and normalized, and the scoring mechanism is a 100-point system.
[0242] 3.2.1 After selecting the second-level index as strengthening the grid structure among the 29 samples, the sample set is as follows Figure 6 shown.
[0243] right Figure 6 After performing multiple linear regression on the three-level indicators in , the obtained coefficients are:
[0244] The constant term is 54.7;
[0245] Coefficient one is 1.7;
[0246] Then, the index score of strengthening grid structure = 54.7+1.7* unit investment reduces the number of overloaded lines;
[0247] The constant term in this formula is too large and the coefficient is too low, which is not a goo...
Embodiment 3
[0308] Select 39 investment projects with a voltage level of 10 kV and below as the basis for model training. The specific projects and average scores of experts are shown in Table 10:
[0309]
[0310]
[0311]
[0312] 4.1 Sample quantification and normalization
[0313] The samples of 10kV power grid investment projects are quantified and normalized, and the scoring mechanism is a 100-point system.
[0314] 4.2.1 Select the secondary index to strengthen the grid structure
[0315] The sample set obtained after selecting the second-level index from the above 39 investment projects as strengthening the grid structure is as follows: Figure 13 Shown:
[0316] Obviously, the two third-level indicators are not related to each other, and linear regression can be performed separately:
[0317] For the first three-level indicator, linear regression calculates the coefficients:
[0318] The constant term is 57.49111989;
[0319] Coefficient 1 is 8.716084235;
[0320] ...
PUM
 Abstract
Description
Claims
Application Information
 - R&D
- Intellectual Property
- Life Sciences
- Materials
- Tech Scout
- Unparalleled Data Quality
- Higher Quality Content
- 60% Fewer Hallucinations
Browse by: Latest US Patents, China's latest patents, Technical Efficacy Thesaurus, Application Domain, Technology Topic, Popular Technical Reports.
© 2025 PatSnap. All rights reserved.Legal|Privacy policy|Modern Slavery Act Transparency Statement|Sitemap|About US| Contact US: help@patsnap.com


