Supercharge Your Innovation With Domain-Expert AI Agents!

An Efficient and Flexible Radar Spectrum Display Method

A display method and flexible technology, applied in the field of efficient and flexible radar spectrum display, can solve the problems of limited screen resolution, inefficient drawing, and inflexibility of display devices, so as to improve efficiency and flexibility, improve drawing efficiency, and improve efficiency obvious effect

Active Publication Date: 2019-09-20
广州辰创科技发展有限公司
View PDF8 Cites 0 Cited by
  • Summary
  • Abstract
  • Description
  • Claims
  • Application Information

AI Technical Summary

Problems solved by technology

[0004] Due to the limited screen resolution of the display device, when there are many signal sampling points, many sampling points will be repeatedly mapped to the same screen position, and it is inefficient to draw all the points every time the spectrum data is updated.
Moreover, when the user interacts with the spectrum curve, such as obtaining the maximum or minimum value of a certain point on the spectrum, it is inflexible and inefficient to reversely locate the sampling point data through the mapped point

Method used


Image

  • An Efficient and Flexible Radar Spectrum Display Method
  • An Efficient and Flexible Radar Spectrum Display Method
  • An Efficient and Flexible Radar Spectrum Display Method

Examples


Embodiment

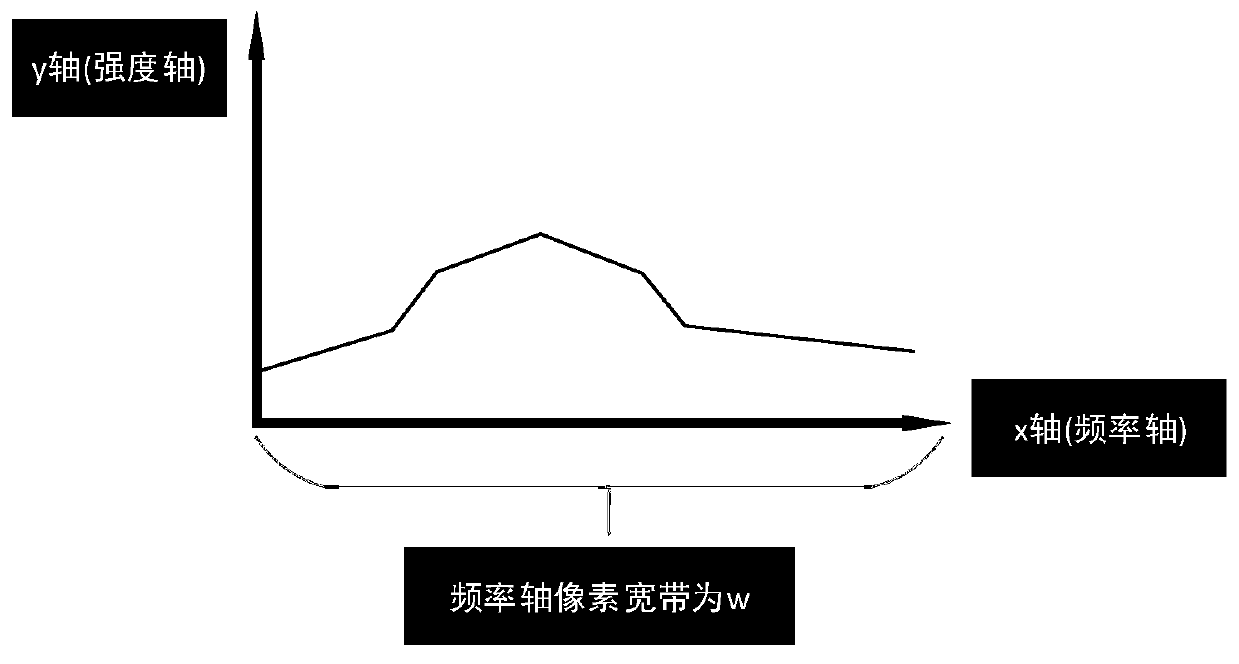
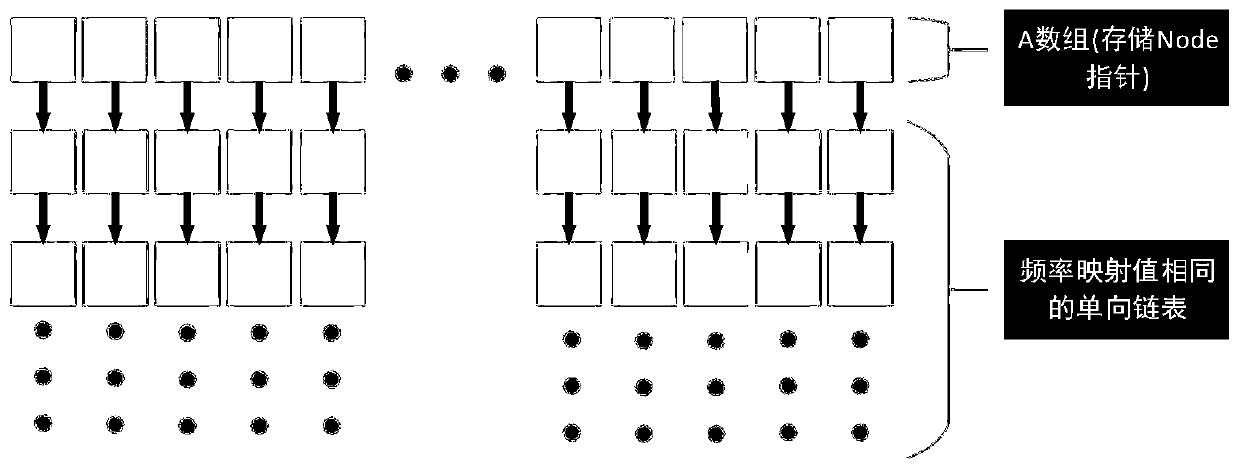
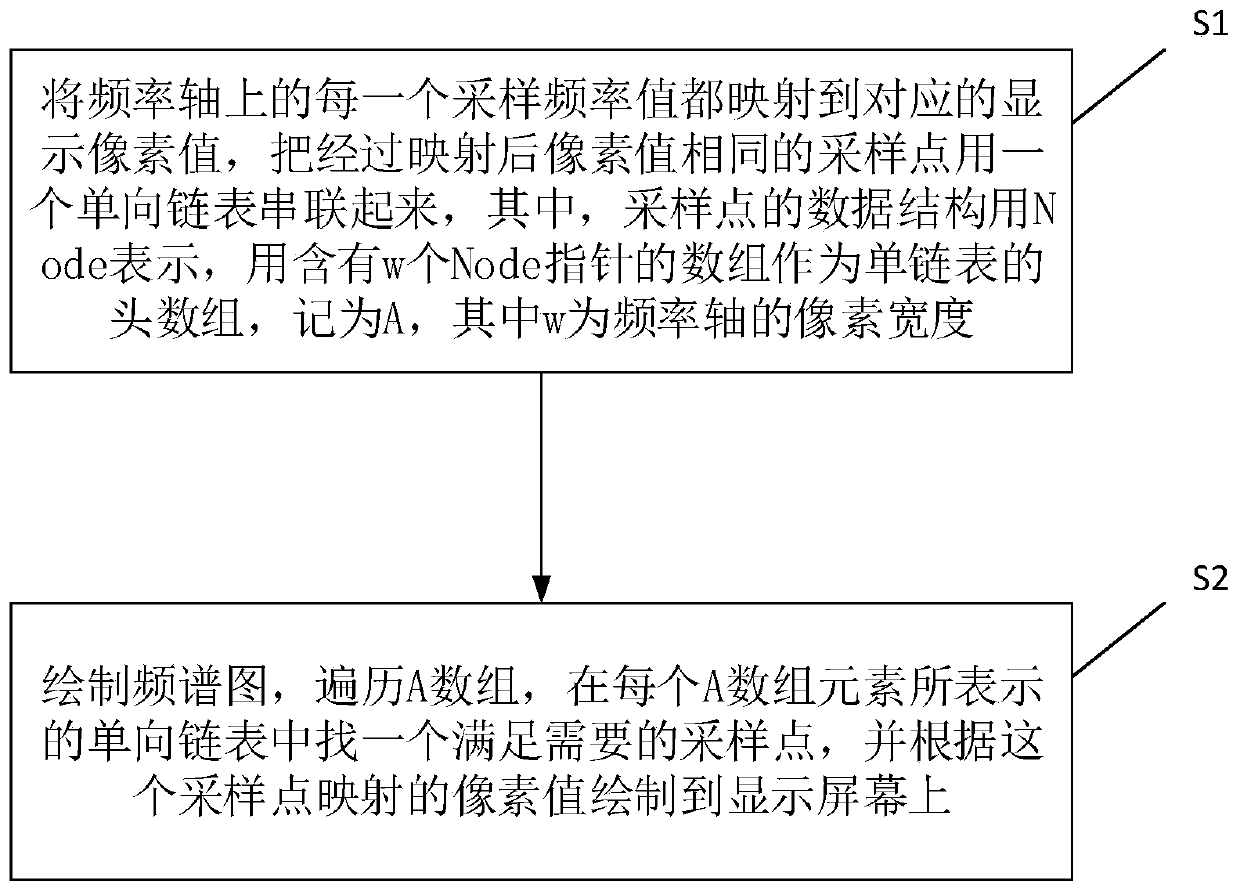
[0022] like figure 1 , the x-axis is the frequency axis, the y-axis is the intensity axis, and the pixel width of the frequency axis is w. The center frequency and frequency resolution are determined during initialization, that is, the frequency range and frequency interval are determined. In the case of high bandwidth and high resolution, the number of sampling data points is particularly large, which may reach hundreds of thousands or even millions. point, so when the corresponding frequency value is mapped to the x-axis, many mapped values ​​are the same, that is to say, they will be superimposed together. In order to manage these superimposed points, you can use a sampling point with the same pixel value after mapping. Singly linked lists are concatenated. Then how many such one-way linked lists are there? When there are too many sampling points, each pixel on the frequency axis has a frequency mapping, so there are at most w such one-way linked lists. Assuming that Node...


PUM


Abstract

The invention discloses an efficient and flexible radar spectrum display method which comprises the following steps: S1, each sampling frequency value on a frequency axis is mapped to a correspondingdisplay pixel value, and sampling points with the same pixel value after mapping are connected in series by a one-way linked list, wherein the data structure of each sampling point is represented withNode, an array containing w Node pointers is used as the header array of each one-way linked list and is recorded as A, and w is the pixel width of the frequency axis; and S2, a spectrogram is drawn,the arrays A are traversed, a desirable sampling point is found in the one-way linked list represented with the elements of each array A, and the sampling points are drawn on a display screen according to the pixel values mapped by the sample points. A corresponding linked list data structure is established according to the pixel width of the spectrum display area, and radar spectrum display is made efficient, flexible and accurate through reasonable abstraction of the sampling points.

Description

technical field [0001] The invention relates to the technical field of radar spectrum display, in particular to an efficient and flexible radar spectrum display method. Background technique [0002] In radar signal analysis, there are more and more analysis scenarios for high-bandwidth and high-resolution signals, and high-bandwidth and high-resolution signals are characterized by a large number of sampling points and a large amount of data. How to be efficient, flexible, and efficient in signal analysis Accurate display of signal spectrum is a major development trend. [0003] At present, the mainstream radar signal spectrum display first establishes a two-dimensional linear space with the frequency as the x-axis and the signal strength as the y-axis, and then calculates the mapping of the sampling point to the newly established two-dimensional space according to the frequency and intensity values ​​of the sampling point. Coordinates, and finally connect all mapping points...

Claims


Application Information

Patent Timeline
Patent Type & Authority Patents(China)
IPC IPC(8): G01R23/16
Inventor 郭磊
Owner 广州辰创科技发展有限公司
Features
  • R&D
  • Intellectual Property
  • Life Sciences
  • Materials
  • Tech Scout
  • Unparalleled Data Quality
  • Higher Quality Content
  • 60% Fewer Hallucinations
Learn More